
Rapid Vulnerability Assessment of Coastal Insular Ecosystems: Application to Algerian Islands
 10.21463/jmic.2026.15.2.08
Abstract
Assessing the vulnerability of insular environments has become a major challenge in the context of increasing anthropogenic pressures and climate-change impacts. This study proposes a rapid environmental vulnerability assessment methodology, here applied to the best of the authors' knowledge in the international peer-reviewed literature to all Algerian coastal islands. The framework is based on a Global Vulnerability Index (GVI) integrating 21 ecological, socio-economic and environmental criteria, weighted using a hierarchical Analytic Hierarchy Process (AHP) with two levels (cluster and sub-criterion) to ensure that all pairwise comparison matrices satisfy Saaty's consistency threshold (CR < 0.10). This approach enables the prioritization of pressure levels affecting insular ecosystems using accessible data, while ensuring methodological robustness and reproducibility. A total of 36 representative insular sites were selected from 611 identified along the Algerian coastline and analyzed under five thematic scenarios: a balanced Normal scenario, plus Fishing, Tourism, Urbanization and Ecological-Sensitivity scenarios. The results were integrated into a Geographic Information System (GIS) to produce vulnerability maps. Spatial analysis highlights clear regional contrasts: marked heterogeneity in the western sector (GVI 0.21 – 0.80), more uniform vulnerability in the central sector driven by diffuse urbanization (GVI 0.40 – 0.51), and dominant fishing pressures in the eastern sector (GVI 0.36 – 0.56). A Monte-Carlo sensitivity analysis (±10 % and ±20 % perturbations of the AHP weights, 1 000 iterations) confirmed the robustness of the rankings (mean Spearman ρ > 0.98). A Chi-square goodness-of-fit test against a uniform distribution further confirmed that the GVI discriminates significantly between sites (χ² = 92.6, df = 4, p < 0.001). The methodology provides an operational decision-support tool for coastal management.
Keywords
Vulnerability, Anthropogenic pressure, Insular ecosystems, Modelling, Algeria
1. Introduction
The assessment of ecological quality in coastal and marine environments has become a major concern in recent decades due to growing anthropogenic pressures (Bentaallah, 2022; Ducrotoy, 2018). Accelerated coastal urbanization, intensive tourism development, overfishing, unregulated aquaculture, and pollution from industrial and domestic sources are among the factors contributing to the degradation of the ecological integrity of marine ecosystems (Grooten and Almond, 2018). Combined with the impacts of climate change, these factors further exacerbate biodiversity loss (Bara Dème et al., 2024; Magnan et al., 2009), particularly in the Mediterranean, a semi-enclosed sea where climate-change effects are intensified by the confined nature of the ecosystem (Leoni Silva, 2022).
Insular environments exhibit specific vulnerabilities due to their limited surface area, relative isolation, and the concentration of human pressures over small spatial extents (Pillet, 2021; Pinel, 2024; Schultz, 2022). To monitor the ecological status of these areas and inform sustainable management policies, various assessment tools have been developed. These include biotic indices (e.g. AMBI, BENTIX, ITI) that use benthic communities as bioindicators (Borja et al., 2000; Carlier et al., 2022; Parent, 2019; Simboura and Zenetos, 2002; Word, 1978), abiotic parameters such as water quality and contaminant levels (Belhouari, 2018; Bouchoucha et al., 2019; Lasne et al., 2022), and more complex approaches integrating ecological and socio-economic dimensions. Despite their scientific rigor, these methods often face practical limitations: they require costly and time-consuming fieldwork, advanced technical analysis, and expert knowledge that is often unavailable to local managers and decision-makers operating under urgent conditions (Buonocore et al., 2021; Smit et al., 2021).
In this context, "rapid assessment" approaches have emerged as pragmatic alternatives, combining scientific reliability with ease of application. Widely used in both marine and terrestrial settings, these methods aim to produce reliable diagnostics using relevant yet accessible indicators (Archer-Rand et al., 2021; Pascal et al., 2020). Several international programmes have demonstrated the relevance of such approaches, especially in Mediterranean and tropical regions where limited resources hinder the implementation of in-depth assessments (Angelidis and Kamizoulis, 2005; Obura and Grimsditch, 2009).
Building on these antecedents, this study develops an original rapid assessment methodology specifically applied to Algerian insular environments. The approach is based on the analysis of 21 weighted criteria encompassing ecological, socio-economic and environmental dimensions, combined into a Global Vulnerability Index (GVI). Drawing on easily accessible data coastal population density, intensity of tourism activity, fishing pressure, and degree of urbanization carefully selected for their relevance in reflecting the state of insular ecosystems, the methodology aims to provide coastal managers with a reliable operational tool that balances simplicity and scientific robustness.
Two methodological hypotheses guide this work: (H1) under a hierarchical AHP procedure, 21 heterogeneous criteria can be combined into a single Global Vulnerability Index whose underlying pairwise comparisons all satisfy Saaty's consistency requirement (CR < 0.10); and (H2) the resulting GVI rankings are robust to plausible expert uncertainty in the weights, i.e. they should remain stable under moderate (±10 % to ±20 %) random perturbations of the AHP weights. These hypotheses are tested formally in Section 2.5 and the results are discussed in Section 3. The work stands at the intersection of in-depth scientific diagnosis and the concrete needs of environmental planning for the conservation of Algerian insular ecosystems.
2. Methodology
2.1. Study area
This study was conducted on insular environments along the Algerian Mediterranean coastline, extending from the Moroccan border to the Tunisian border. A comprehensive inventory identified 611 insular features, including islands, islets and rocky formations. From this inventory, 36 sites were selected for the application of the rapid assessment method. The selection followed four operational criteria: (i) ecological importance, as documented in the BANBIOM database, the EMODnet biodiversity layer (EMODnet, 2025) and existing protected-area inventories; (ii) surface area above 0.05 ha to ensure that meaningful biophysical attributes could be measured; (iii) documented levels of anthropogenic pressure (presence of urbanization, fishing fleet, tourism or maritime traffic within a 5 km buffer); and (iv) socio-economic relevance, defined by adjacency to populated municipalities or to a protected area. Sites that did not satisfy at least three of these four criteria were excluded. The selected sites span a wide range of environmental contexts and are subject to various gradients of anthropogenic pressures, including coastal urbanization, tourism development, fishing, aquaculture and maritime transport.
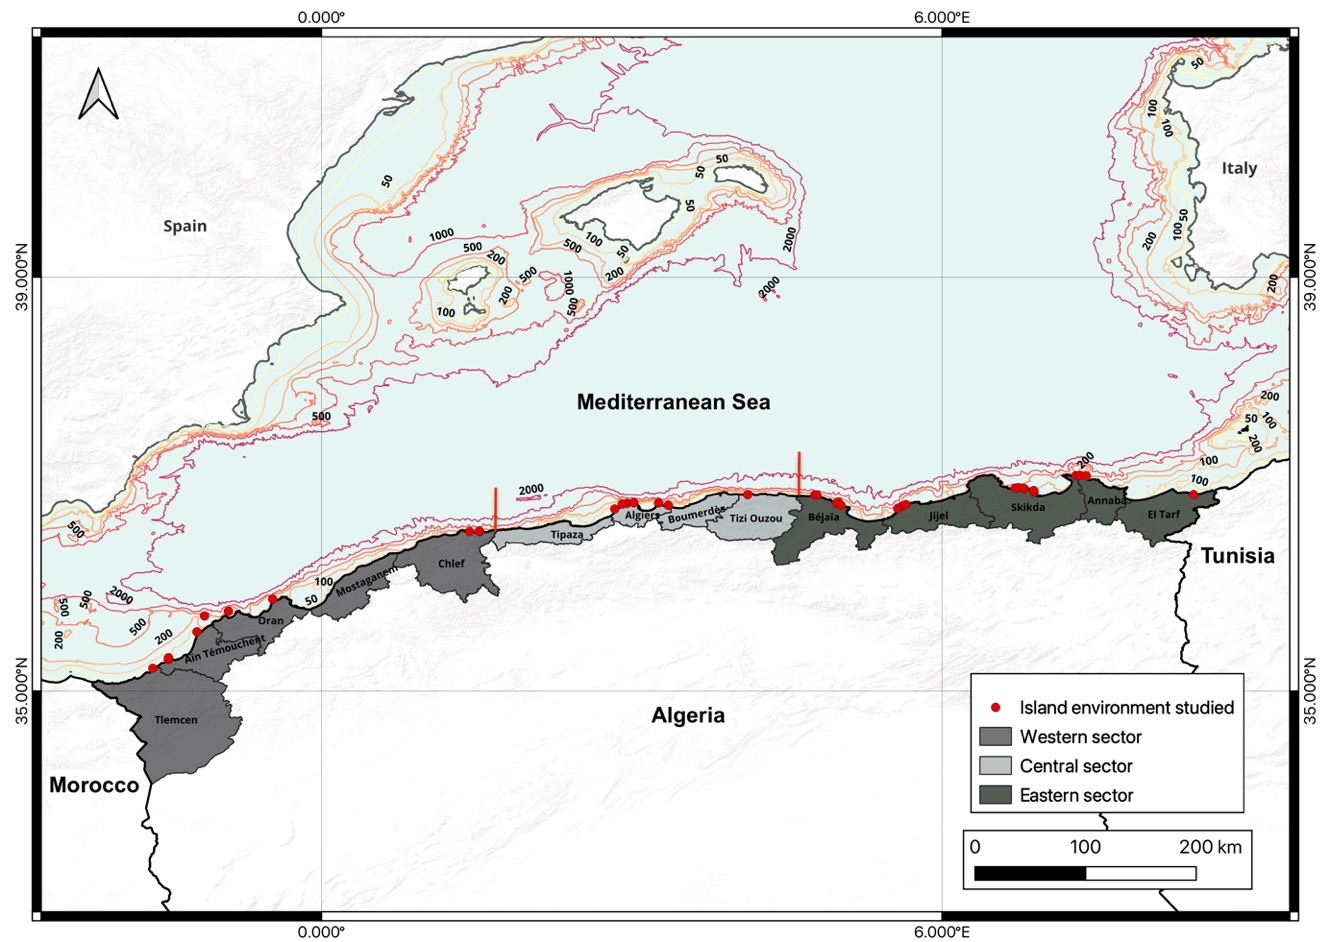
2.2. Data Sources
The data used for this assessment come from a combination of sources, including field observations, previous studies (Garrabou et al., 2019), satellite-image processing via Google Earth Pro, and Geographic Information System (GIS) analysis. Public databases include the European Marine Observation and Data Network EMODnet (EMODnet, 2025; https://emodnet.ec.europa.eu/, accessed January 2026) the Algerian National Marine Biodiversity Database (BANBIOM), and the CNRDPA Map Viewer. For each of the 36 selected insular sites, a set of variables was collected, including geographic coordinates, distance to the mainland, surface area, nature and proximity of pollution sources, density and type of tourist activity, coastal population pressure, surrounding urbanization level, fishing and aquaculture activities, maritime-traffic density, as well as ecological parameters related to biodiversity and potential impacts of climate change.
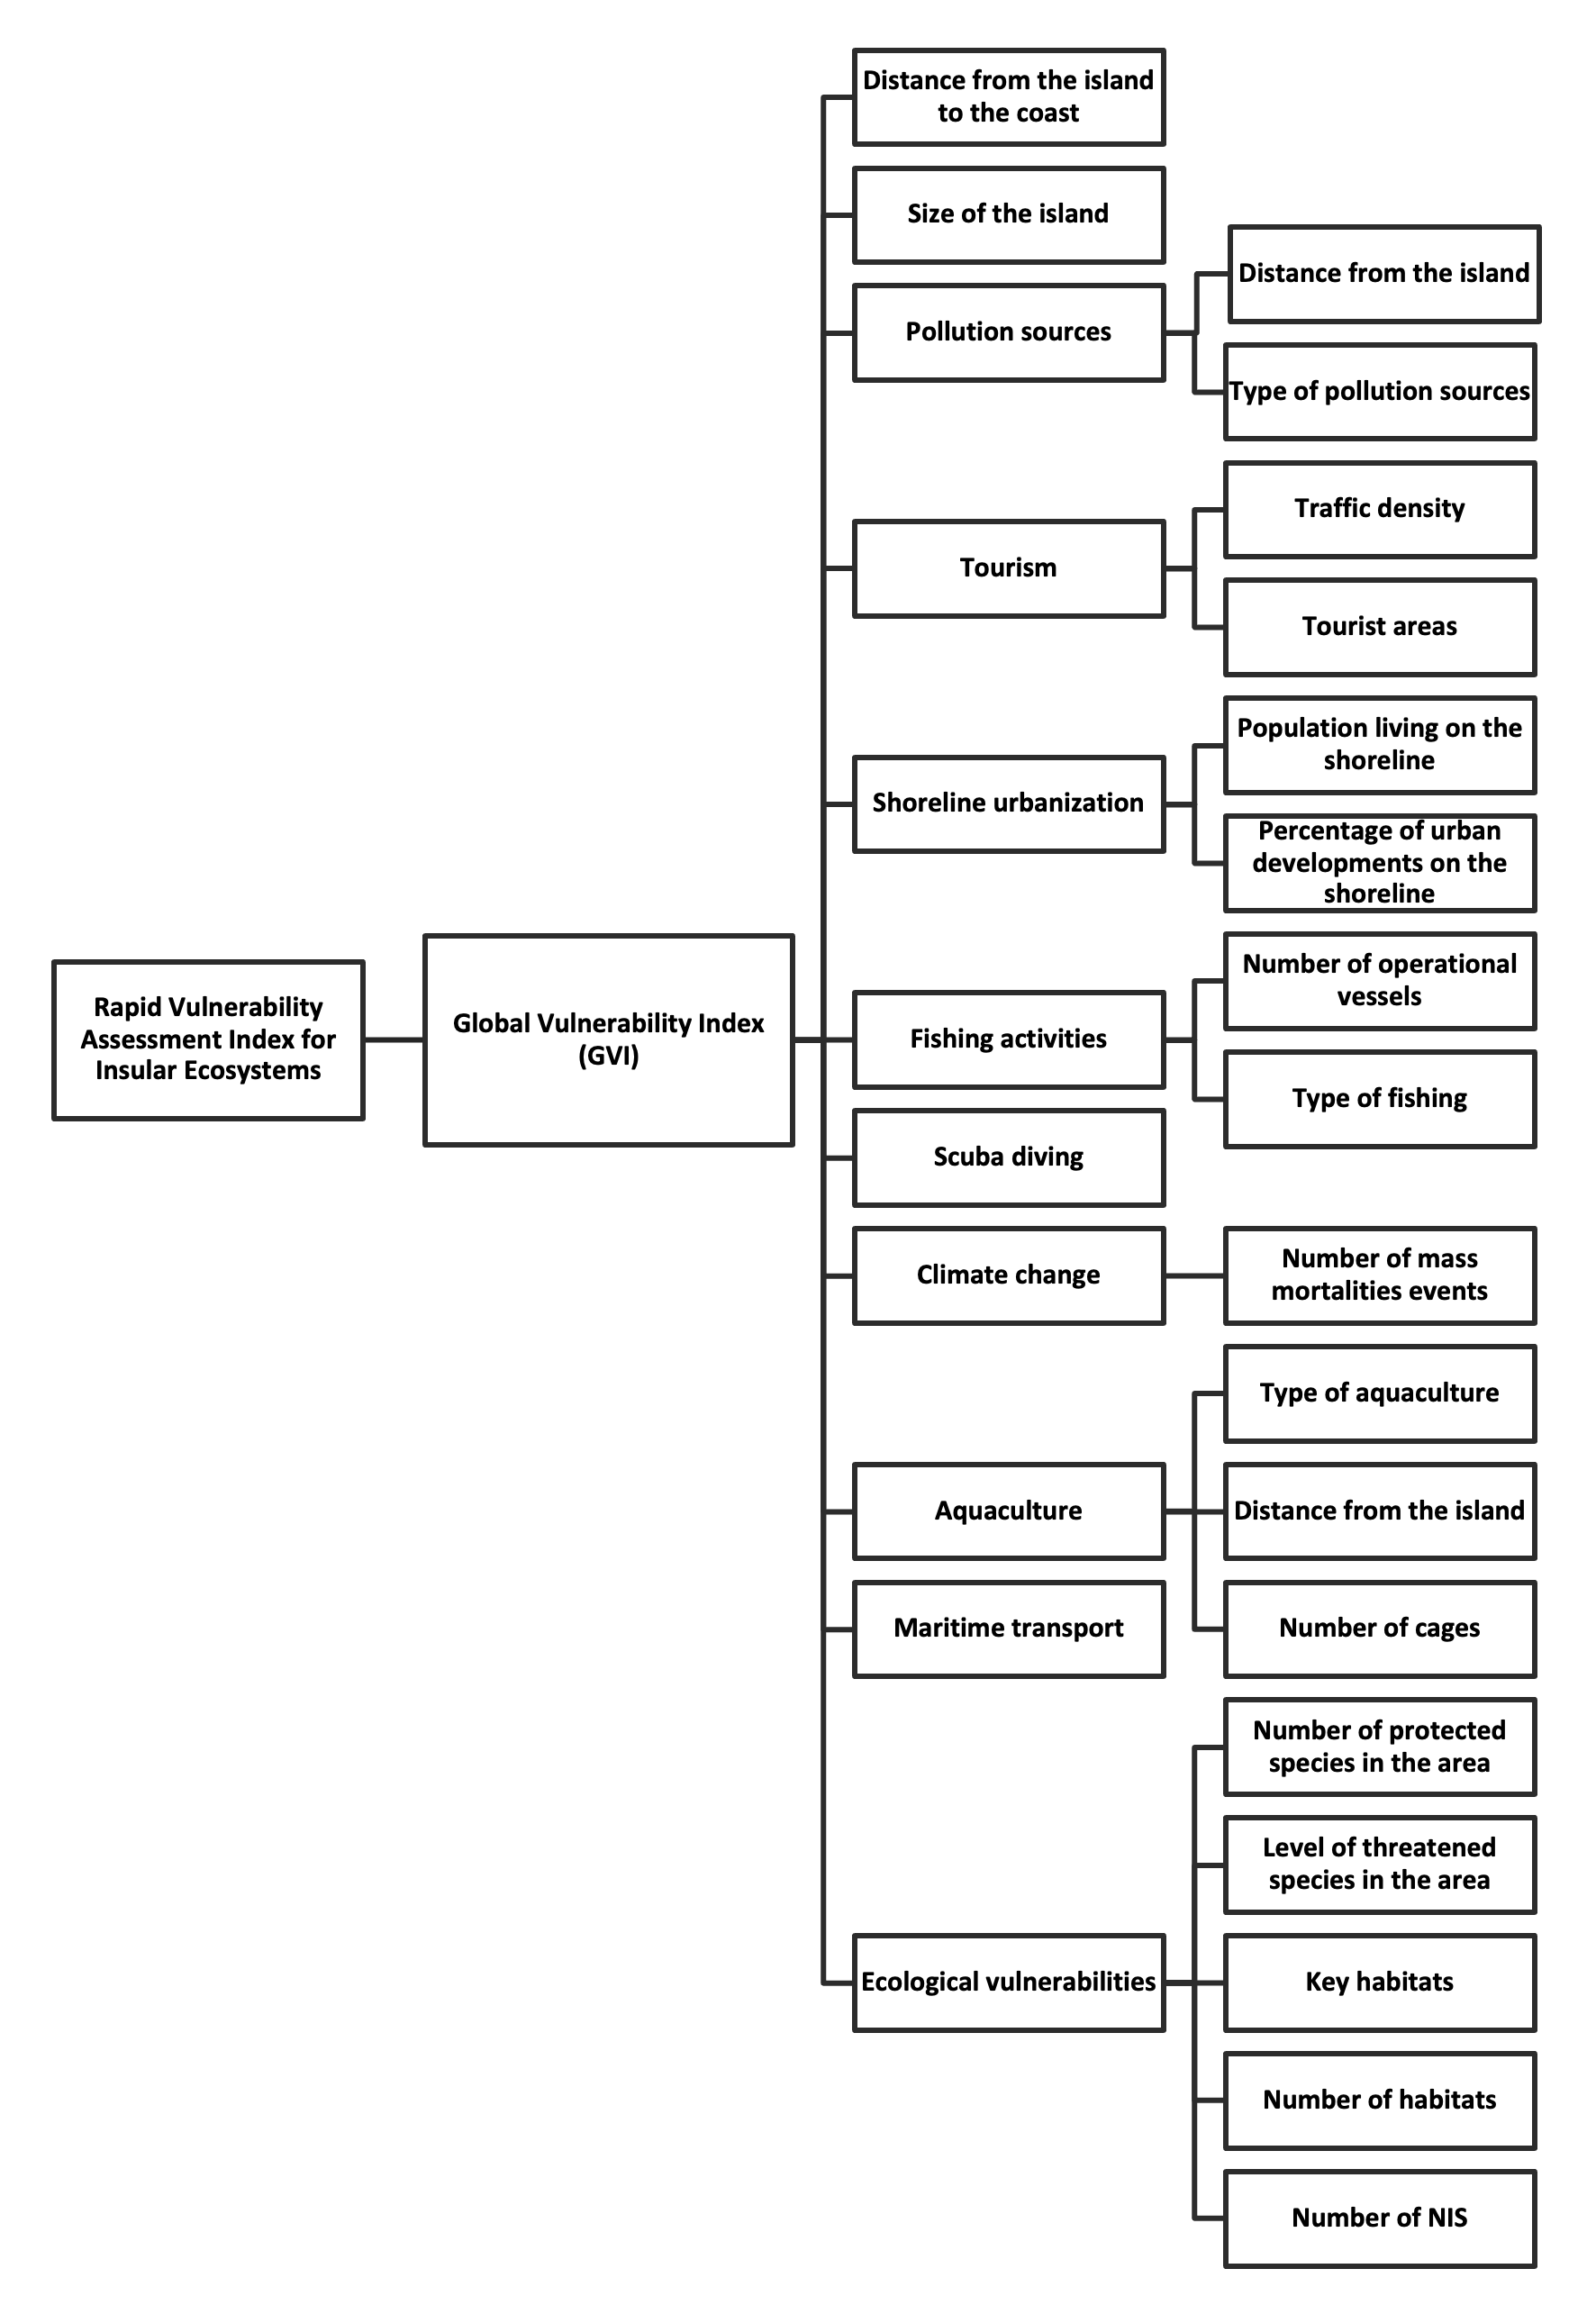
The 21 sub-criteria were organized in a three-level conceptual model (Figure 2). At the top level, three dimensions Environmental, Anthropogenic and Ecological capture the main families of pressures and sensitivities. At the middle level, the dimensions are decomposed into 11 thematic clusters (e.g. Pollution, Tourism, Urbanization, Fishing, Aquaculture, Climate change). At the bottom level, each cluster groups one to five operational sub-criteria.
2.3. Construction of the Insular Vulnerability Index
2.3.1. Operational scoring of raw data
For each of the 21 sub-criteria, the raw field or remote-sensing data are converted into a dimensionless vulnerability score on the interval [0, 1], where 0 denotes absence of risk or impact and 1 denotes the maximum level of risk or impact. The mapping from raw value to score is based on predefined risk classes (Table 2). The class boundaries and the scores assigned to each class were established by a structured expert-elicitation procedure described in Section 2.3.2 and verified against the empirical distributions observed in the 36 study sites. This class-based scoring constitutes the data harmonization stage of the methodology. The min–max rescaling formula (Asara-Marfo et al., 2013; Noorbakhsh, 1998; Yoo et al., 2014) is applied only to the two strictly continuous sub-criteria (Distance to coast and Island size) prior to assigning their class scores; for the 19 other sub-criteria, scoring is directly class-based on categorical or ordinal data (e.g. fishing-gear type, presence of key habitats). A worked example illustrating the two routes is given in Appendix A of the Supplementary Material. This clarifies the apparent ambiguity between the rescaling formula and the discrete scores reported in Table 2.
$$ \mathrm{Score}(X) =\frac{(X-X_{\min})}{(X_{\max}-X_{\min})} \qquad \text{where} \qquad \mathrm{Score}(X)\in[0,1] $$
2.3.2. Justification of class boundaries and scores
The class boundaries and within-class scores in Table 2 were established by combining three sources: (i) published Mediterranean thresholds for the corresponding pressure (e.g. SPA/BD Protocol guidelines for coastal urbanization buffers; PNUE/PAM-CAR/ASP, 2005); (ii) an empirical examination of the cumulative distribution of each variable across the 36 study sites, with class boundaries placed close to natural breaks (Jenks-like inspection); and (iii) a structured expert-elicitation panel of five Algerian and Mediterranean marine scientists with field experience on the study sites. The non-linear score distribution of the population sub-criterion (0 / 0.02 / 0.13 / 0.34 / 0.74 / 1.0) follows a saturating function: a small population on the coastal strip causes negligible disturbance to a small island, whereas the marginal effect grows non-linearly above ~30 000 inhabitants per municipality (Khatib Zagh, 2017; MATE, 2006; Rabehi et al., 2022). This choice was preferred to a linear mapping because field observations on the Bay of Algiers islets show that the ecological footprint scales with the saturation of coastal infrastructure rather than with the raw count of inhabitants. The full set of references, class boundaries and elicited scores is reported in Table 2.
2.3.3. Criteria weighting by hierarchical AHP
To reflect the relative importance of each criterion in the overall assessment, weights were established using the Analytic Hierarchy Process (AHP) developed by Saaty (1990) and Saaty and Vargas (2001), and applied to environmental vulnerability assessment by Li et al. (2009) and Nguyen et al. (2016). Because the present study compares 21 sub-criteria, a single 21 × 21 pairwise comparison matrix systematically produces a Consistency Ratio (CR) above Saaty's acceptability threshold of 0.10 a well-known limitation of AHP for n > 9 (Saaty, 1990). To address this, the AHP was applied in a two-level hierarchical structure:
- Level 1: Cluster pairwise comparison matrix. An 11 × 11 matrix compares the 11 thematic clusters (Figure 2). For each thematic scenario, the cluster priorities reflect the focus of the scenario (e.g. the Fishing scenario gives priority to the Fishing and Aquaculture clusters).
- Level 2: Within-cluster pairwise comparison matrices. Within each multi-criterion cluster, a smaller (2 × 2 to 5 × 5) pairwise comparison matrix yields local weights w_local summing to 1 inside the cluster.
The global weight of each sub-criterion is the product w_global = w_cluster × w_local. For each of the five scenarios, this procedure yields seven matrices (one Level-1 and six Level-2 matrices); CR was computed for all of them with the Saaty random-index values (RI₁₁ = 1.51, RI₅ = 1.12, etc.). All 35 matrices satisfy CR < 0.10 (largest CR = 0.018 in the Level-2 Ecological matrix; full results in the Supplementary Material). The complete pairwise comparison matrices and their CR values are reported in the Supplementary Material (Appendix B), in line with standard AHP reporting practice (Saaty, 1990).
Five thematic scenarios were developed: a balanced reference scenario (Normal GVI) and four overweighting scenarios Fishing, Tourism, Urbanization/Population, and Ecological Sensitivity. The Normal scenario distributes priority broadly among ecological, anthropogenic and environmental clusters. The four thematic scenarios shift priority toward the cluster(s) that name them. This approach tests the sensitivity of the model to weighting variations and provides decision-makers with customizable analysis tools tailored to local challenges.
2.3.4. Integration of the Global Vulnerability Index
The 21 weighted sub-criteria are aggregated into a single Global Vulnerability Index (GVI) according to Equation (2):
$$ GVI = \sum_{i=x=1}^{n} S_x W_i $$
Where:
𝑆x is the [0, 1] score assigned to sub-criterion i,
𝑊i is its global weight under the chosen scenario,
n is the number of sub-criteria.
The five scenario-specific GVIs are:
- Normal GVI : balanced weighting of all criteria.
- Fishing GVI : overweighting of fishing and aquaculture criteria.
- Tourism GVI : overweighting of tourism, diving and maritime-transport criteria.
- Urbanization/Population GVI : overweighting of coastal urbanization and population criteria.
- Ecological-Sensitivity GVI : overweighting of ecological-vulnerability and climate-change criteria.
2.4. Vulnerability mapping
To interpret the indices, the GVI values were grouped into five vulnerability classes (Table 1). This classification follows the approach of Li et al. (2009) for the eco-environmental vulnerability assessment of the Danjiangkou Reservoir (China), which used a Fuzzy AHP framework integrating natural, social and anthropogenic factors and produced a five-class typology ranging from very low to extremely high vulnerability.
| Vulnerability Class | Description | GVI Interval |
|---|---|---|
| 1 | Low vulnerability | 0<GVI≤0.2 |
| 2 | Moderately vulnerable | 0.2<GVI≤0.4 |
| 3 | Vulnerable | 0.4<GVI≤0.6 |
| 4 | Highly vulnerable | 0.6<GVI≤0.8 |
| 5 | Extremely vulnerable | 0.8<GVI≤1 |
All calculated indices were integrated into a Geographic Information System (GIS) to produce thematic vulnerability maps, enabling spatial visualization of pressure levels.
2.5. Validation strategy
Two complementary validation steps were applied: an internal consistency test on the GVI class distribution, and a Monte-Carlo sensitivity analysis on the AHP weights.
2.5.1. Chi-square goodness-of-fit on the vulnerability-class distribution
A Chi-square goodness-of-fit test (Agresti, 2007) was applied to verify that the model effectively discriminates between vulnerability levels, rather than concentrating all sites in a single class. The procedure was the following: (i) the Normal-scenario GVI was computed for each of the 36 sites; (ii) the 36 continuous GVI values were binned into the five vulnerability classes of Table 1 (intervals 0 – 0.2, 0.2 – 0.4, 0.4 – 0.6, 0.6 – 0.8, 0.8 – 1.0); (iii) the observed frequencies were compared against the uniform null distribution (H₀: GVI values are evenly distributed across the five classes, i.e. the model does not discriminate); (iv) the test statistic χ² = Σ (Oₖ − Eₖ)² / Eₖ was computed with df = 5 − 1 = 4. We note that the version of this test reported in earlier drafts of this manuscript (χ² = 1.71, df = 140) rested on an incorrect treatment of the continuous GVI; the corrected formulation above is the one used here, and its observed frequencies, expected frequencies and χ² components are reported in full in the Supplementary Material (Appendix C).
2.5.2. Sensitivity analysis
Because the AHP weights inevitably carry expert-judgment uncertainty, the robustness of the GVI rankings was tested by Monte-Carlo perturbation. For each of two perturbation amplitudes (±10 % and ±20 % of each weight), 1 000 perturbed weight vectors were generated by multiplying every weight by an independent uniform random factor in [1 − a, 1 + a], with a = 0.10 or 0.20, and renormalizing the vector to sum to 1. For each perturbed vector, the 36 site-level GVI values were recomputed. Robustness was quantified by (i) the coefficient of variation (CV) of GVI at each site across the 1 000 perturbations, and (ii) the Spearman rank correlation between the baseline ranking and each perturbed ranking.
2.6. Data processing and analysis
Score scaling, AHP weight derivation and GVI computation were performed in Microsoft Excel (deterministic operations) and verified independently in Python (NumPy 1.26, SciPy 1.11) for the eigenvalue-based AHP weights and the Monte-Carlo sensitivity analysis. Results were presented as comparative histograms grouped by geographic sector (West, Central, East), to facilitate the spatial analysis of vulnerability variations.
3. Results and discussion
3.1. Scoring scheme
Table 2 reports the scoring scheme applied to the 21 sub-criteria. For each sub-criterion, the table lists the unit, the class boundaries, the score assigned to each class, and the literature reference or expert source supporting the choice. The full justification of class boundaries and scores is provided in Section 2.3.2.
| Attribute | Sub-attribute | Unit | Class | Score | Reference / rationale |
|---|---|---|---|---|---|
| Distance to coast | / | Meter (m) | < 500 | 1.0 | Google Earth Pro; expert panel (n=5); high exposure to shoreline pressures |
| [500–1000] | 0.5 | Linear gradient on rescaled distance (Eq. 1) | |||
| >1000 | 0 | Distance beyond which shoreline pressures are buffered (PNUE/PAM-CAR/ASP, 2005) | |||
| Island size | / | Hectare (ha) | < 1 | 1.0 | Small insular surfaces are highly sensitive to disturbance (Pillet, 2021) |
| [1–5[ | 0.72 | Empirical natural breaks on the 611 inventoried sites | |||
| [5–10] | 0.22 | ||||
| >10 | 0 | ||||
| Pollution sources | Distance from island | Meter (m) | < 500 | 1.0 | Pollution-buffer guidelines, Mediterranean coastal-zone management (MATE, 2006) |
| [500–1000] | 0.5 | Linear interpolation | |||
| >1000 | 0 | ||||
| Type of pollution | – | No pollution | 0 | Expert panel | |
| Industrial | 0.8 | Industrial discharges typically combine metals and hydrocarbons (Belhouari, 2018) | |||
| Domestic | 0.4 | Lower toxicity than industrial sources (Bouchoucha et al., 2019) | |||
| Agricultural | 0.8 | Eutrophication risk from nutrient run-off (Lasne et al., 2022) | |||
| Mixed | 1.0 | Cumulative effect of multiple sources (expert panel) | |||
| Tourism | Traffic density | Frequency | Lowly frequented | 0 | Expert panel; field observations |
| Moderately frequented | 0.5 | ||||
| Highly frequented | 1.0 | ||||
| Tourist areas | Count | 0 | 0 | Linear scaling on count of complexes (range 0–4) | |
| Near 1 complex | 0.25 | ||||
| Near 2 complexes | 0.5 | ||||
| Near 3 complexes | 0.75 | ||||
| Near 4 complexes | 1.0 | ||||
| Shoreline urbanization | Coastal population (3 main municipalities) | Inhabitants | < 10 000 | 0 | Saturating function fitted on the 36-site distribution (Khatib Zagh, 2017) |
| [10 000–15 000[ | 0.02 | ||||
| [15 000–30 000[ | 0.13 | ||||
| [30 000–50 000[ | 0.34 | ||||
| [50 000–75 000[ | 0.74 | ||||
| ≥ 75 000 | 1.0 | ||||
| % urban development (3 main municipalities) | % | ]0–33] | 0.17 | Tertile-based natural breaks of urban-development index (Rabehi et al., 2022) | |
| ]33–66] | 0.5 | ||||
| ]66–100] | 0.83 | ||||
| Fishing activities | Operational vessels | Count | < 50 | 0 | FAO scaling for artisanal fishing pressure (Mennad et al., 2021a, b) |
| [50–200[ | 0.17 | ||||
| [200–500] | 0.67 | ||||
| >500 | 1.0 | ||||
| Type of fishing | – | Angling | 0.2 | Increasing pressure with gear diversification (Mennad et al., 2021b) | |
| Angling + Small-scale | 0.4 | ||||
| Angling + Small-scale + Sardine | 0.8 | ||||
| Angling + Small-scale + Sardine + Trawlers | 1.0 | Cumulative gear combinations including bottom-impact gear | |||
| Scuba diving | / | Dives / year | < 50 | 0 | Expert panel; reef-disturbance thresholds (Obura & Grimsditch, 2009) |
| [50–100[ | 0.17 | ||||
| [100–200[ | 0.67 | ||||
| ≥ 200 | 1.0 | ||||
| Aquaculture | Type of aquaculture | – | None | 0 | Increasing effluent and habitat impact |
| Algae farming | 0.2 | ||||
| Shellfish farming | 0.4 | ||||
| Crustacean farming | 0.8 | ||||
| Fish farming | 1.0 | Highest nutrient load and benthic impact | |||
| Distance from island | Meter (m) | < 50 | 1.0 | Aquaculture buffer guidelines (expert panel) | |
| [50–200[ | 0.74 | ||||
| [200–500[ | 0.32 | ||||
| [500–1000] | 0.08 | ||||
| >1000 | 0 | ||||
| Number of cages | Count | 0 | 0 | Scaling by infrastructure footprint | |
| [1–3[ | 0.4 | ||||
| [3–5] | 0.8 | ||||
| >5 | 1.0 | ||||
| Maritime transport | / | – | Tourist boat | 0.3 | Expert panel; cumulative-impact ordering |
| Tourist + Commercial | 0.6 | ||||
| Tourist + Commercial + Petrochemical tanker | 1.0 | Worst case (oil-spill exposure) | |||
| Ecological vulnerabilities | Protected species | Count | < 10 | 0 | Quartile-based scaling on BANBIOM data |
| [10–20[ | 0.25 | ||||
| [20–30] | 0.75 | ||||
| >30 | 1.0 | ||||
| Threat level of species | – | Regulated | 0 | IUCN-based ordering (Garrabou et al., 2019) | |
| Threatened / endangered | 0.5 | ||||
| Very threatened | 1.0 | ||||
| Key habitats | – | Absence | 0 | Presence/absence of Coralligenous, Posidonia or Cystoseira beds | |
| Presence | 1.0 | ||||
| Number of habitats | Count | < 3 | 0 | Habitat-richness quartiles on the 36 sites | |
| [3–5[ | 0.14 | ||||
| [5–10] | 0.64 | ||||
| >10 | 1.0 | ||||
| Number of NIS (Non-Indigenous Species) | Count | < 5 | 0 | Saturating function; mass-invasion thresholds in Mediterranean (Garrabou et al., 2019) | |
| [5–10[ | 0.01 | ||||
| [10–50[ | 0.13 | ||||
| [50–200] | 0.62 | ||||
| >200 | 1.0 | ||||
| Climate change | Mass-mortality events | Count | 0 | 0 | Mediterranean MME database (Garrabou et al., 2019) |
| [1–3] | 0.67 | ||||
| >3 | 1.0 |
3.2. Weight assignment and consistency
Applying the hierarchical AHP described in Section 2.3.3 yielded the global weights summarized in Table 3. For each of the five scenarios, all seven underlying pairwise comparison matrices (one at Level 1, six at Level 2) satisfy CR < 0.10 (Table 4). The largest CR observed across the 35 matrices is 0.018, well below the 0.10 threshold.
| Attribute | Sub-attribute | Normal | Fishing | Tourism | Ecological | Urbanization |
|---|---|---|---|---|---|---|
| Distance to coast | / | 0.0311 | 0.0347 | 0.0313 | 0.0366 | 0.0358 |
| Island size | / | 0.0216 | 0.0246 | 0.0248 | 0.0260 | 0.0274 |
| Pollution sources | Distance | 0.0404 | 0.0299 | 0.0240 | 0.0408 | 0.0605 |
| Type | 0.0809 | 0.0598 | 0.0480 | 0.0816 | 0.1211 | |
| Tourism | Traffic density | 0.0485 | 0.0368 | 0.0978 | 0.0336 | 0.0383 |
| Tourist areas | 0.0485 | 0.0368 | 0.0978 | 0.0336 | 0.0383 | |
| Shoreline urbanization | Population | 0.0485 | 0.0368 | 0.0360 | 0.0336 | 0.1098 |
| % urban development | 0.0485 | 0.0368 | 0.0360 | 0.0336 | 0.1098 | |
| Fishing activities | Operational vessels | 0.0448 | 0.1007 | 0.0286 | 0.0336 | 0.0303 |
| Type of fishing | 0.0448 | 0.1007 | 0.0286 | 0.0336 | 0.0303 | |
| Scuba diving | / | 0.0444 | 0.0532 | 0.1651 | 0.0583 | 0.0575 |
| Aquaculture | Type | 0.0299 | 0.0654 | 0.0191 | 0.0224 | 0.0202 |
| Distance | 0.0299 | 0.0654 | 0.0191 | 0.0224 | 0.0202 | |
| Number of cages | 0.0299 | 0.0654 | 0.0191 | 0.0224 | 0.0202 | |
| Maritime transport | / | 0.0615 | 0.0736 | 0.1325 | 0.0632 | 0.1017 |
| Ecological vulnerabilities | Protected species | 0.0376 | 0.0197 | 0.0211 | 0.0485 | 0.0168 |
| Threatened species | 0.0249 | 0.0131 | 0.0140 | 0.0323 | 0.0112 | |
| Key habitats | 0.0425 | 0.0223 | 0.0239 | 0.0549 | 0.0190 | |
| Number of habitats | 0.0197 | 0.0103 | 0.0111 | 0.0275 | 0.0088 | |
| Number of NIS | 0.0464 | 0.0243 | 0.0261 | 0.0549 | 0.0208 | |
| Climate change | Mass-mortality events | 0.1758 | 0.0897 | 0.0962 | 0.2067 | 0.1017 |
| SUM | — | 1.0000 | 1.0000 | 1.0000 | 1.0000 | 1.0000 |
| Scenario | Matrix | n | CR | Status |
|---|---|---|---|---|
| Normal | Level-1 (Clusters) | 11 | 0.0090 | Acceptable |
| Level-2 (Pollution) | 2 | 0.0000 | Acceptable | |
| Level-2 (Tourism) | 2 | 0.0000 | Acceptable | |
| Level-2 (Urbanization) | 2 | 0.0000 | Acceptable | |
| Level-2 (Fishing) | 2 | 0.0000 | Acceptable | |
| Level-2 (Aquaculture) | 3 | 0.0000 | Acceptable | |
| Level-2 (Ecological) | 5 | 0.0175 | Acceptable | |
| Fishing | Level-1 (Clusters) | 11 | 0.0081 | Acceptable |
| Level-2 (six sub-matrices, n ≤ 5) | ≤ 5 | ≤ 0.0175 | Acceptable | |
| Tourism | Level-1 (Clusters) | 11 | 0.0092 | Acceptable |
| Level-2 (six sub-matrices, n ≤ 5) | ≤ 5 | ≤ 0.0175 | Acceptable | |
| Urbanization | Level-1 (Clusters) | 11 | 0.0088 | Acceptable |
| Level-2 (six sub-matrices, n ≤ 5) | ≤ 5 | ≤ 0.0175 | Acceptable | |
| Ecological | Level-1 (Clusters) | 11 | 0.0050 | Acceptable |
| Level-2 (six sub-matrices, n ≤ 5) | ≤ 5 | ≤ 0.0131 | Acceptable |
The weighting reveals that, in the Normal scenario, mass-mortality events and ecological criteria carry the highest global weights, followed by pollution sources and the urbanization-related criteria. The four thematic scenarios redistribute weights coherently: the Fishing scenario assigns ~30 % of the total weight to the Fishing and Aquaculture clusters; the Tourism scenario raises the Diving, Tourism and Maritime-transport weights to a combined ~0.50; the Urbanization scenario concentrates ~0.30 of the total weight on the Population, % urban development and Pollution criteria; and the Ecological scenario allocates ~0.42 of the total weight to the Ecological-vulnerability and Climate-change clusters. This adaptability is a deliberate feature of the model: it lets stakeholders interrogate the GVI under different management priorities without changing the underlying data.
3.3. Statistical validation and sensitivity
3.3.1. Chi-square goodness-of-fit
Under the Normal scenario, the 36 sites distribute across the five vulnerability classes as follows: 0 in Class 1 (Low), 5 in Class 2 (Moderate), 30 in Class 3 (Vulnerable), 0 in Class 4 (High) and 1 in Class 5 (Extreme). Against the uniform null distribution (expected frequency 7.2 per class), the Chi-square statistic is χ² = 92.6, df = 4, which largely exceeds the critical value χ²₀.₀₅,₄ = 9.49 (p < 0.001). The null hypothesis of uniform distribution across the five classes is therefore rejected with high confidence: the model successfully discriminates between vulnerability levels rather than concentrating sites in a single class. The dominant class (Vulnerable) reflects the fact that Algerian insular environments are, on the whole, exposed to moderate-to-high anthropogenic pressures with a few notable outliers at both ends of the distribution.
3.3.2. Robustness to weight perturbations
The Monte-Carlo sensitivity analysis described shows that GVI rankings are highly robust. Across 1 000 perturbations at the ±10 % level, the mean coefficient of variation (CV) of site GVI is 1.35 %, and the mean Spearman rank correlation between perturbed and baseline rankings is 0.994. At the more demanding ±20 % level, the mean CV rises to 2.70 % and the mean Spearman ρ remains at 0.986. These values empirically support hypothesis H2: plausible expert-judgment uncertainty in the AHP weights does not destabilize the GVI rankings, and the management implications of the present analysis are therefore not sensitive to the precise numerical weights but to the overall priority structure encoded in the scenarios.
3.4. Visualization of insular vulnerability
3.4.1. Western sector
The western sector displays marked variability in vulnerability indices. The Normal-scenario GVI averages 0.49, with values ranging from 0.21 (Mokrane Island, Tlemcen) to 0.80 (Plane Island, Oran). Plane Island records the highest GVI not only in the western sector but across all 36 sites, while Mokrane Island is the least vulnerable. This contrast reflects the coexistence of near-pristine islands and others under intense anthropogenic pressure. The Aïn Témouchent islands (Cap Figalo, Leïla, Rachgoun) show intermediate vulnerability (GVI 0.46 – 0.53), while the Chlef islands (Bouchghal, Sradjil, Hezirite, Kef Doumia) exhibit slightly lower values (0.39 – 0.47).
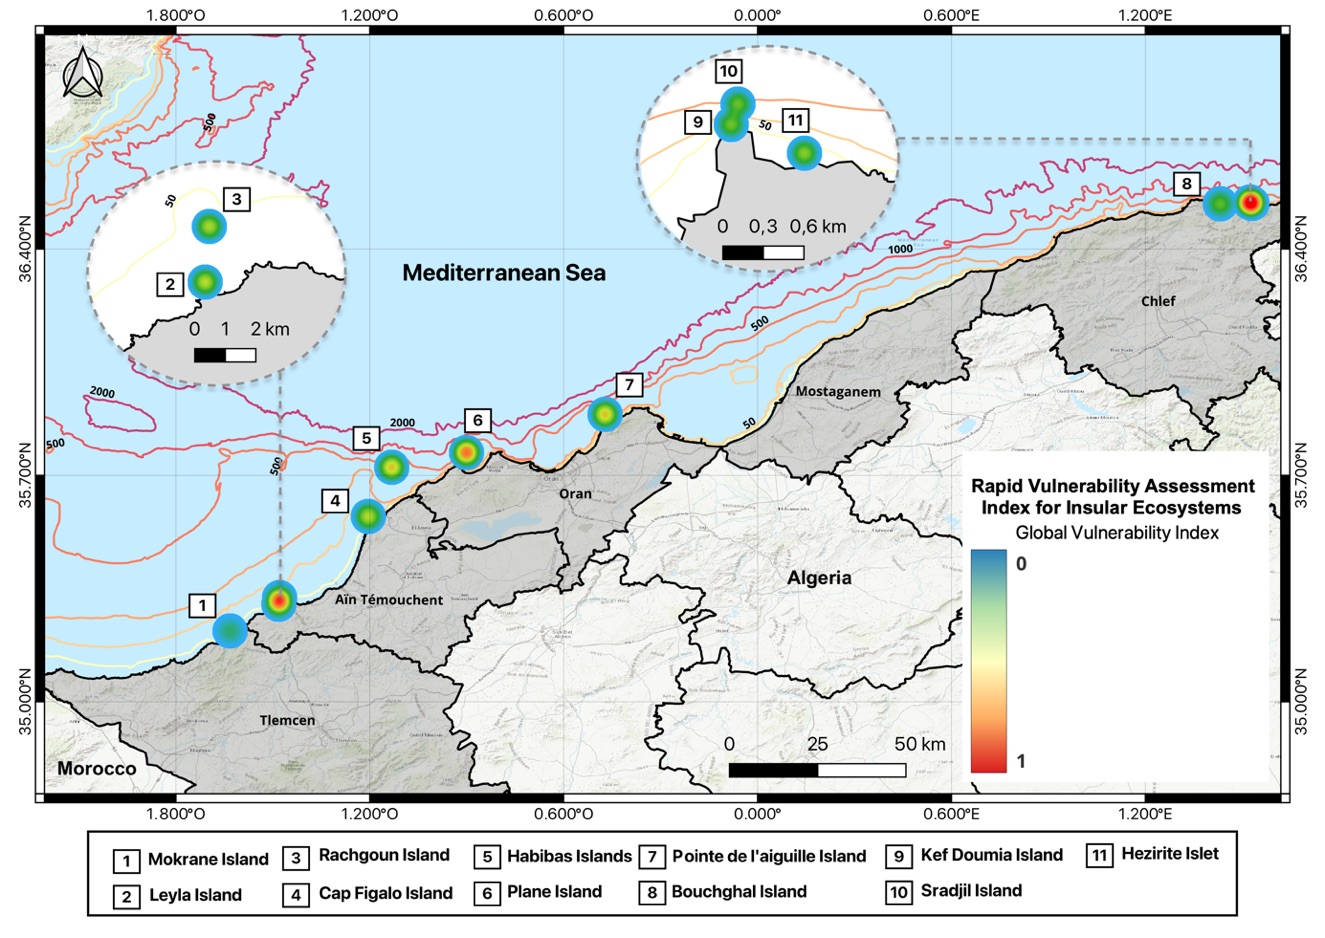
Several factors explain these results. Plane Island, near Oran, is subject to intense anthropogenic pressures and high ecological sensitivity (Davoine et al., 2021). It displays the highest tourism-pressure index of all sites (~0.86), reflecting yachting and beach recreation, together with elevated fishing pressure (~0.74), high urbanization pressure (~0.84) and high ecological sensitivity (~0.80). Conversely, Mokrane Island, a small isolated islet in Tlemcen, experiences only low tourist activity (~0.19) and limited human influence, and its ecological-sensitivity GVI remains moderate (~0.14).
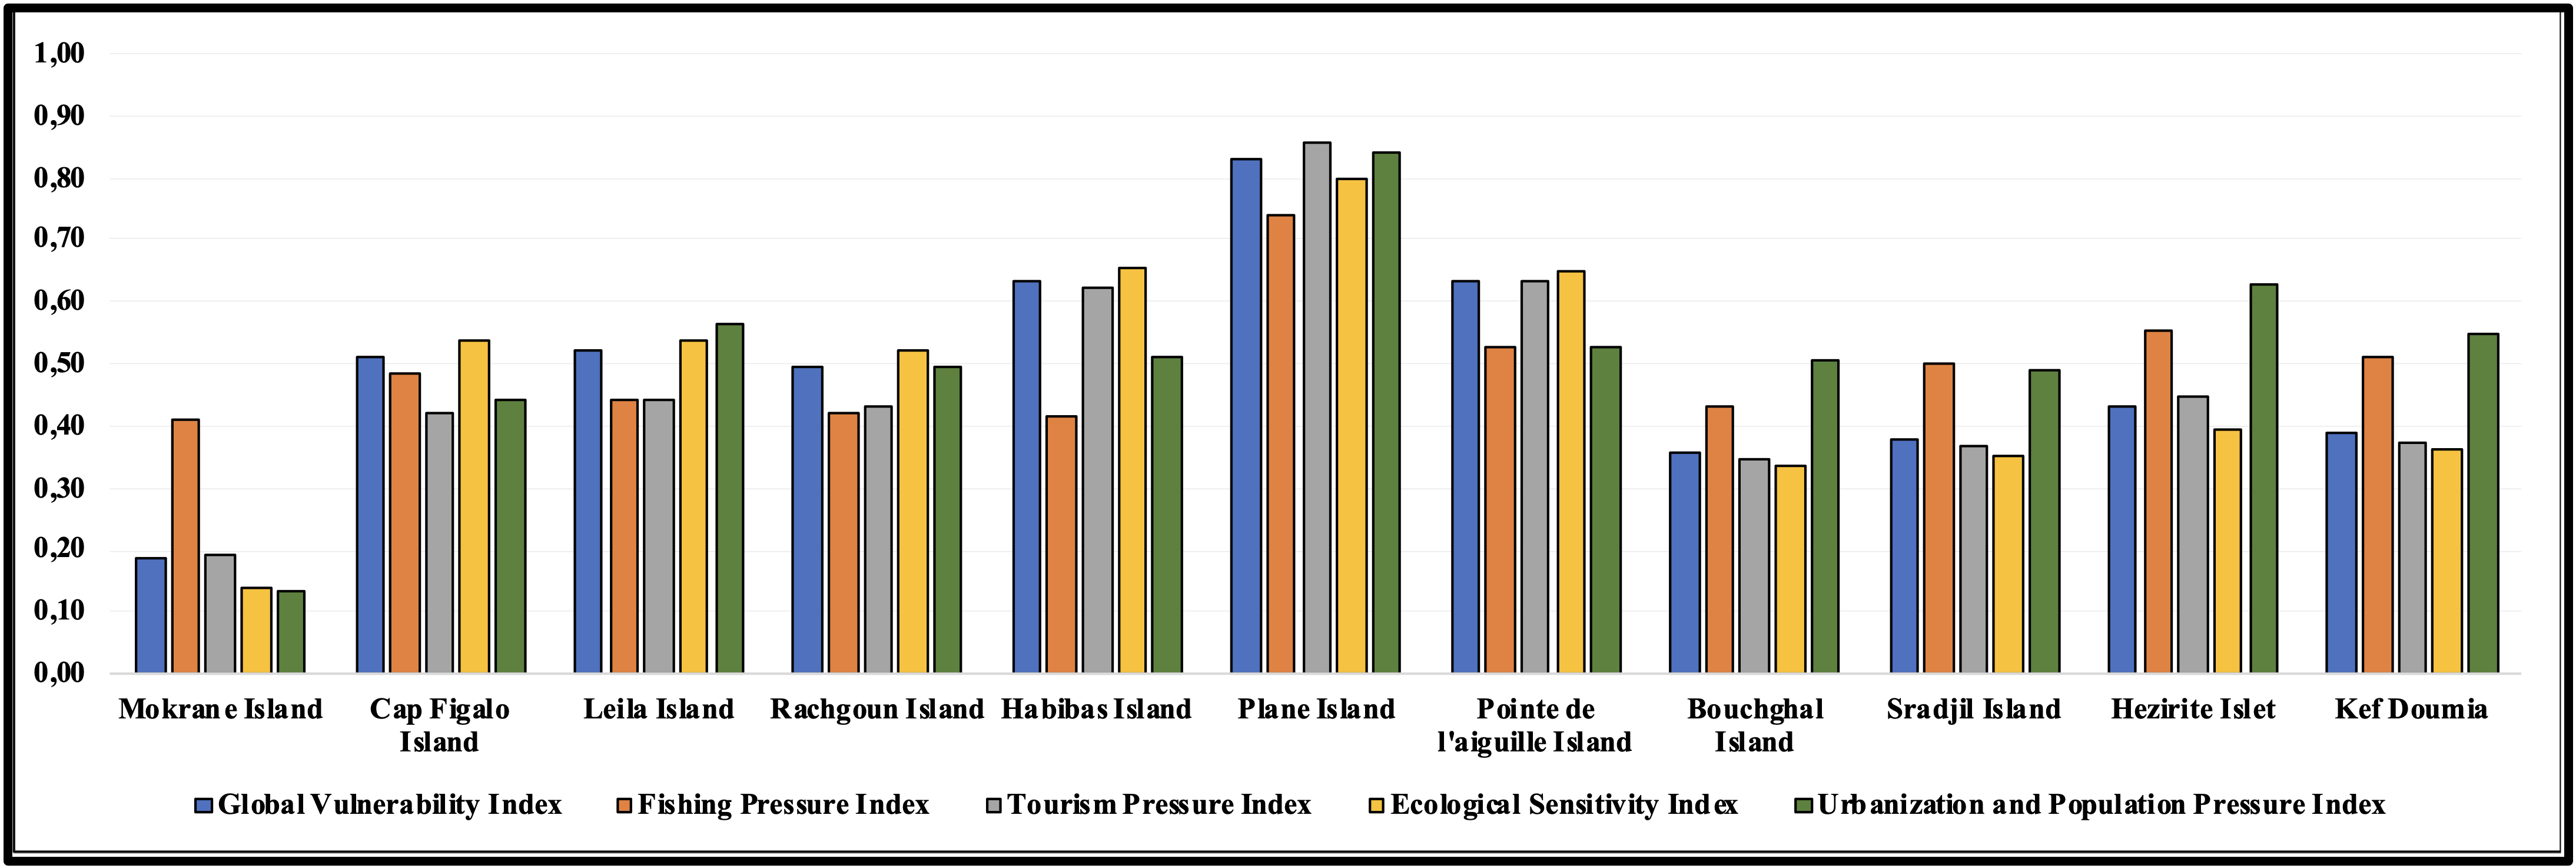
In general, tourism pressure dominates in the western sector, particularly around Oran. Beyond Plane Island, other Oranese sites such as the Habibas Islands and Pointe de l'Aiguille islet also show high tourism-pressure indices (~0.62 to ~0.64) and notable ecological sensitivity. The Habibas archipelago is a marine nature reserve since 2003 (PNUE/PAM-CAR/ASP, 2005), home to endemic species, nesting seabirds and coral habitats (Benabdi et al., 2016; Mouret, 2008), which explains its high ecological-sensitivity index (~0.66). Other islands in the sector (Aïn Témouchent, Chlef) experience more moderate pressures: the Chlef islands show fishing and tourism indices between ~0.4 and ~0.5. The western sector therefore presents a mosaic of situations, from highly vulnerable islands near urban and tourist hubs to relatively pristine sites; this heterogeneity calls for differentiated management.
3.4.2. Central sector
The central sector displays moderate and homogeneous vulnerability. The mean Normal-scenario GVI is 0.44, with values ranging from 0.41 (File Island) to 0.51 (El Djamila islet). All seven sites fall within a relatively narrow range (~0.40 to 0.51), reflecting similar environmental and anthropogenic conditions. No site reaches the extremes observed in the West.
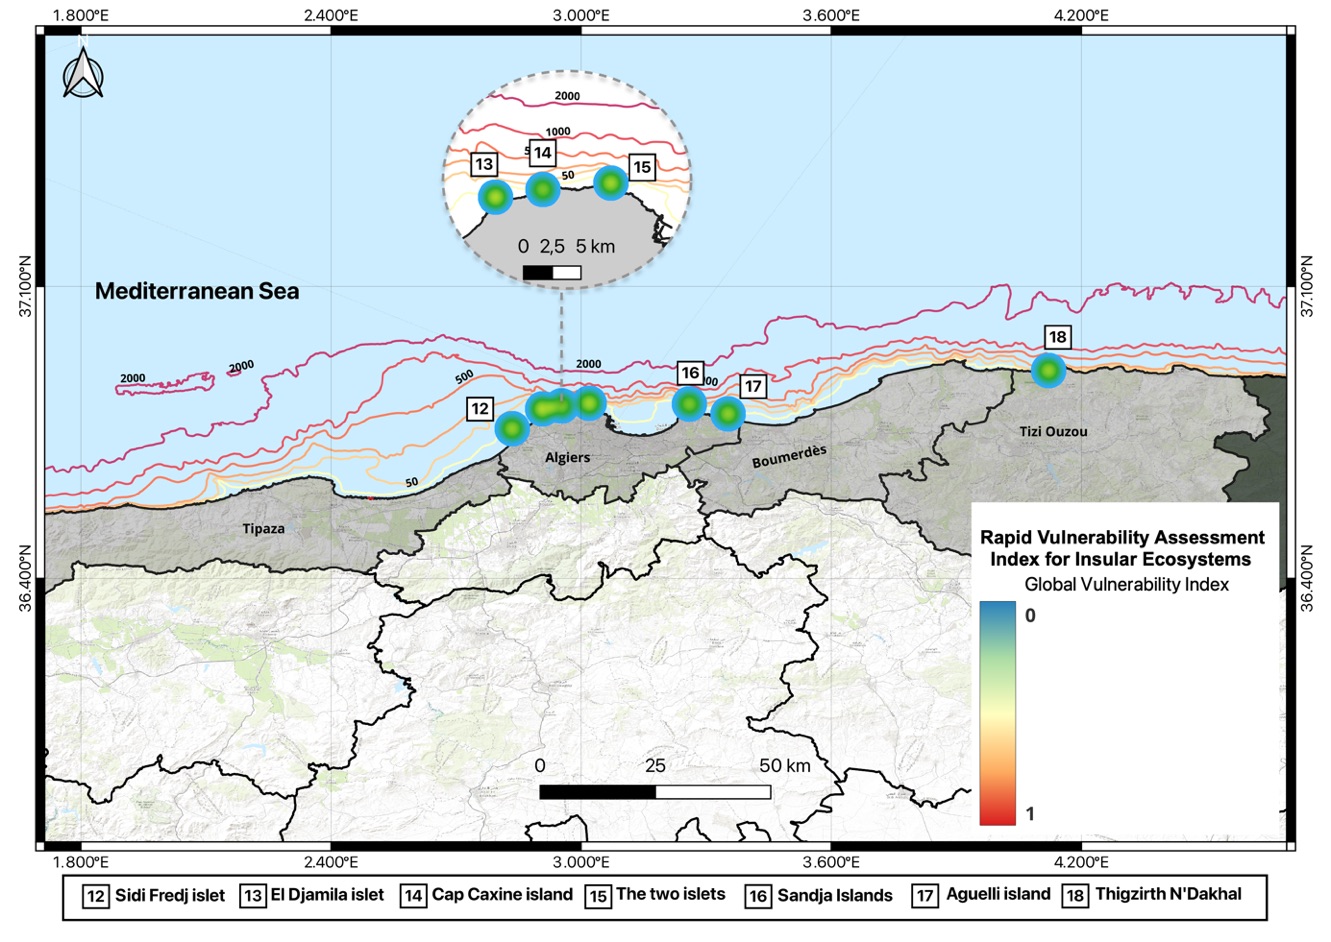
This moderate uniformity is largely explained by the influence of the Algiers urban hub and the absence of either highly isolated or highly touristic sites. Urbanization is the dominant factor (MATE, 2006): the Bay-of-Algiers islets are directly affected by their proximity to the metropolis (urbanization index ~0.71 on the Deux Îlots; ~0.65 on the Sidi Fredj islet). In contrast, tourism pressure remains lower than in the West (~0.41 to ~0.52) and consists mostly of local recreational uses; fishing pressure is also moderate (~0.29 to ~0.45). A notable exception is the Thigzirth N'Dakhal islet off Tigzirt (Tizi Ouzou), where artisanal fishing pressure reaches ~0.59 confirming that, outside of the Algiers core, artisanal fishing remains active.
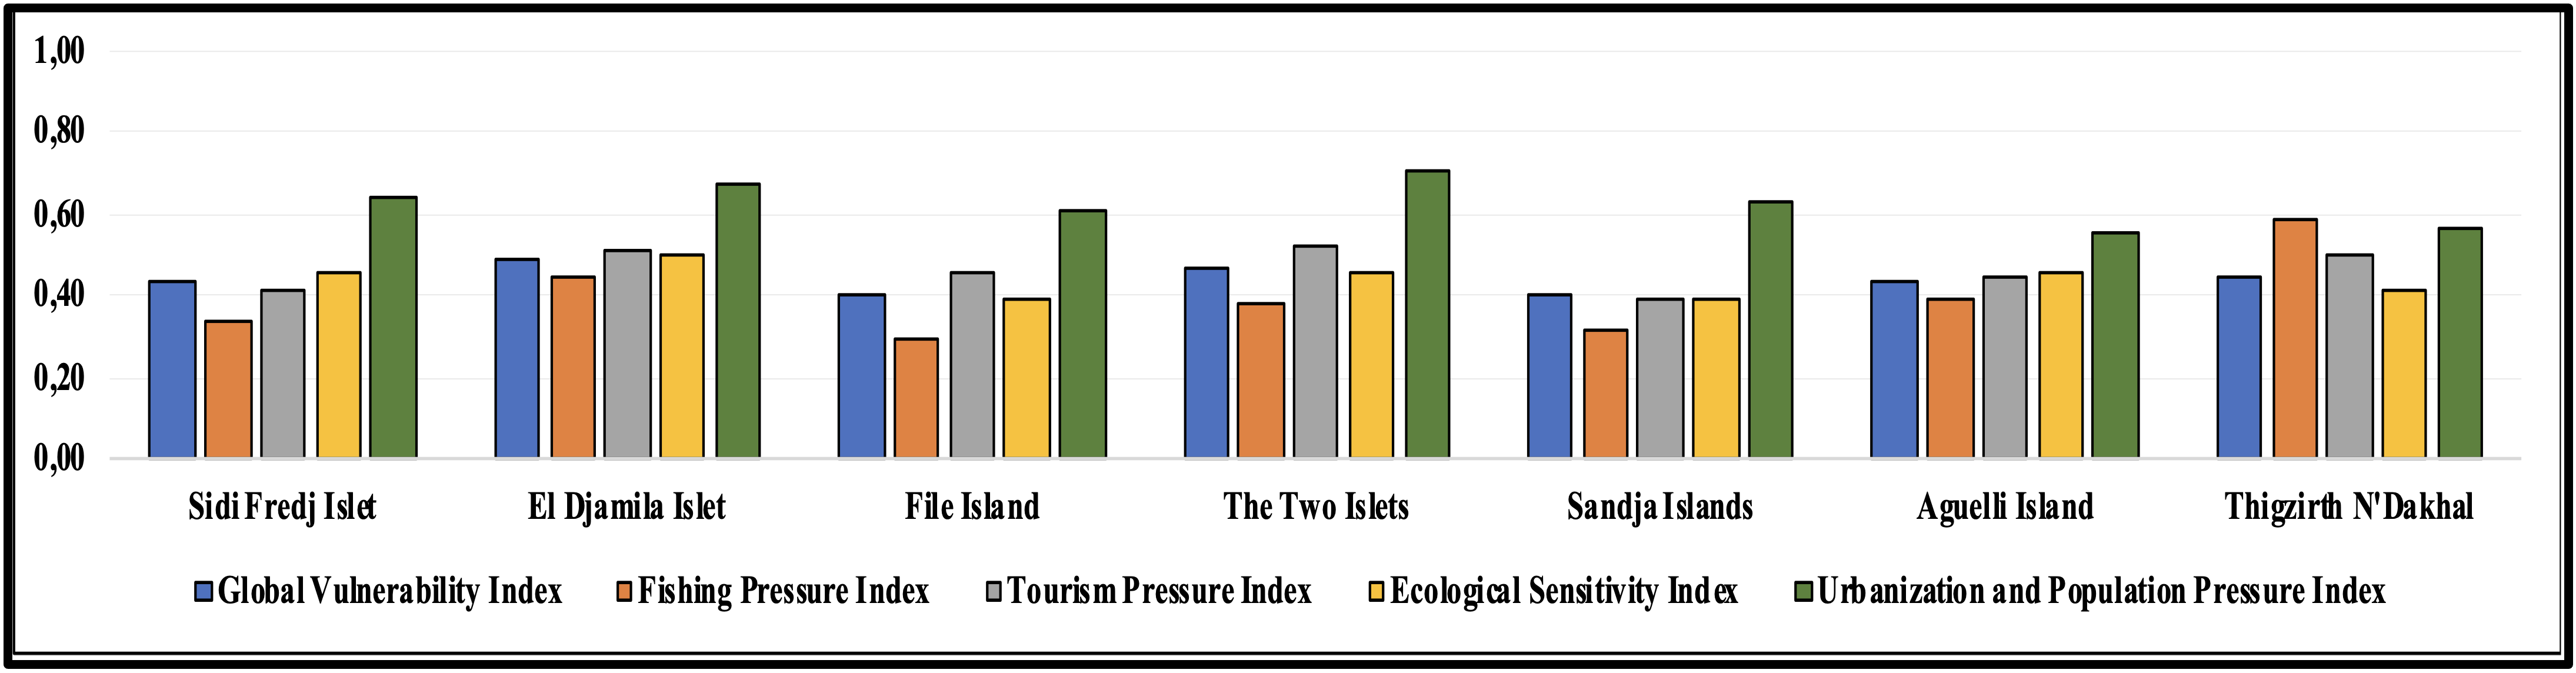
In summary, the central insular environments share an intermediate vulnerability profile dominated by their densely urbanized surroundings. Management efforts should primarily aim to reduce urban impacts (e.g. wastewater control and ecological restoration of affected islets) rather than focusing on tourism regulation, which is virtually nonexistent here, or on marginal fishing activity. Notably, the central sector currently lacks a marine protected area dedicated to the Algiers islets a gap that could be addressed in future coastal-zone management.
3.4.3 Eastern sector
In the eastern sector, vulnerability indices are comparable to the central sector but with a different pressure profile. The mean Normal-scenario GVI is 0.45, with values ranging from 0.36 (Fadhoua Island, Skikda) to 0.56 (Petit Cavallo Islet, Jijel). Most of the 18 sites fall in the 0.40 – 0.50 range, indicating moderate and relatively consistent vulnerability across the eastern coastal region. The lowest value remains substantially above the 0.21 of Mokrane in the West.
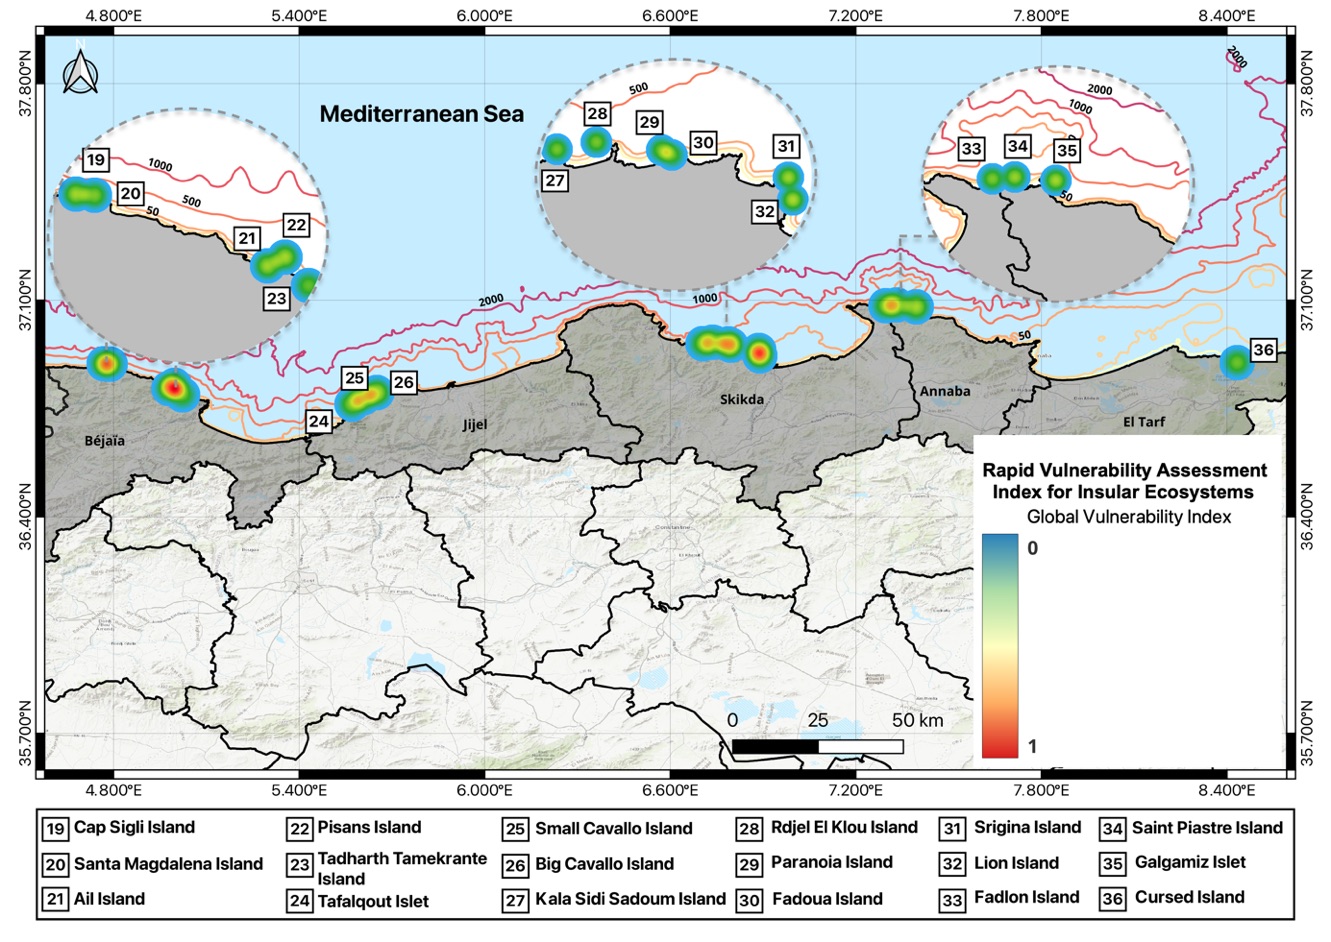
Despite this relative homogeneity, the eastern sector reveals a distinct profile: fishing pressure is the dominant factor much more than in the other sectors. Several Skikda islands record very high fishing-pressure indices (Lion Island ~0.67; Srigina ~0.65; Paranoia and Rdjel El Klou ~0.56). In Jijel, both Grand and Petit Cavallo islets also show significant fishing pressure (~0.43 to ~0.49). These observations align with the fact that fishing remains a major economic activity along Algeria's eastern coastline (Mennad et al., 2021a, 2021b). Tourism pressure is lower than in the West but is non-negligible on accessible islands: Petit Cavallo (~0.64), Srigina and Lion (~0.55 – 0.59). Ecological sensitivity is generally moderate (0.45 – 0.55); a few sites notably the Taza islets in Jijel National Park host coral communities and seabirds of regional importance. Urbanization varies with proximity to coastal bays (~0.73 on Pisans islet near Béjaïa, ~0.49 on Maudite Island in El Tarf near El Kala). Overall, anthropogenic pressure in the East is real but moderate, mainly distributed between fishing, tourism and urbanization.
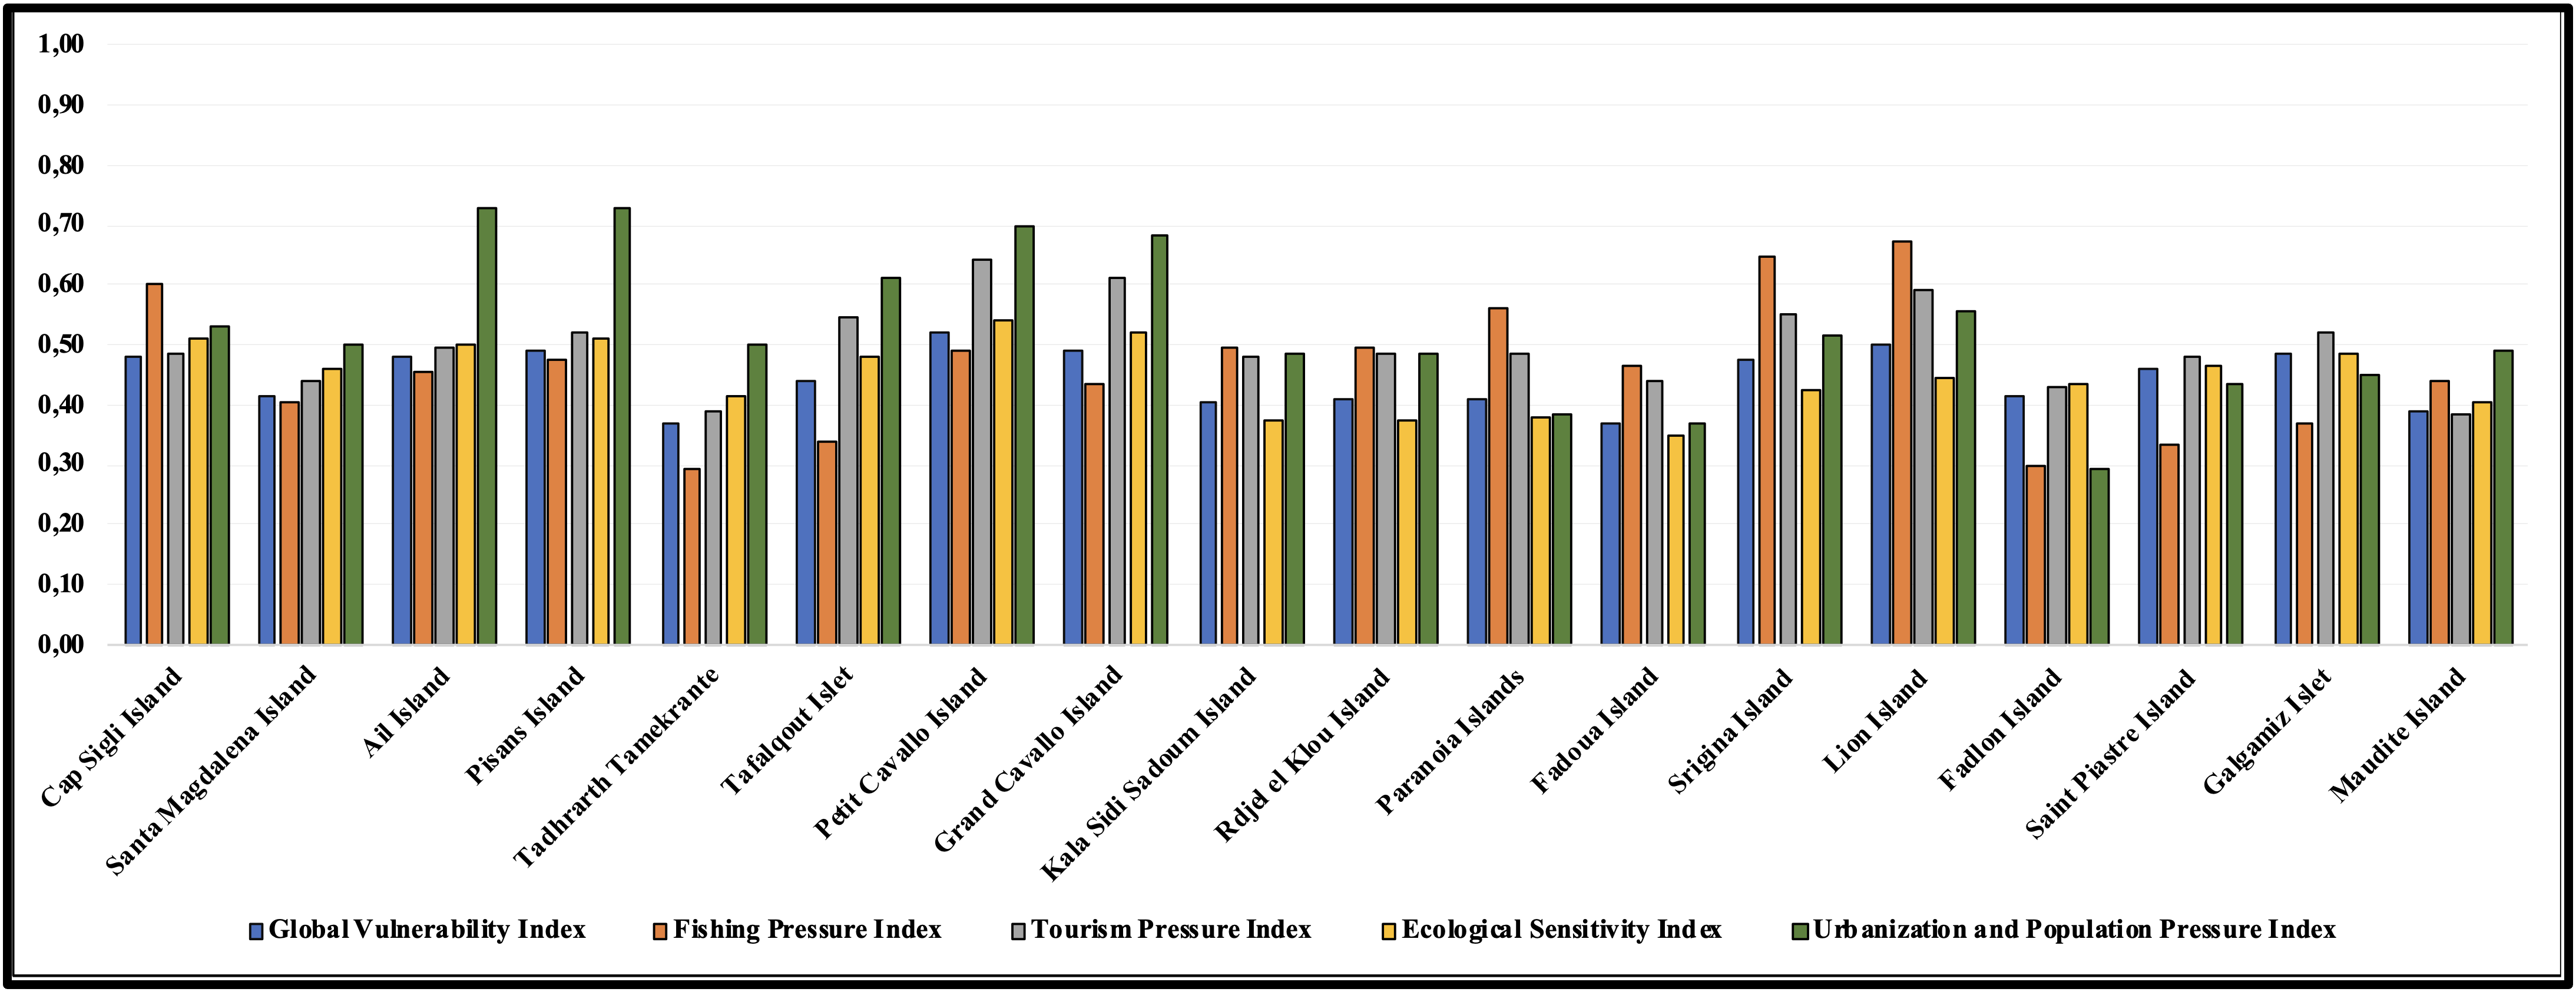
These characteristics reflect both traditional activities and the emergence of ecological awareness. The strong footprint of coastal fishing argues for sustainable management of fishery resources, especially as the local authorities describe these insular environments as fragile and unregulated (MATE, 2014). Diversification efforts are emerging, notably ecotourism alternatives in the Taza National Park and around El Aouana (MATE, 2014), with the objective of channelling human visitation in a sustainable way while easing pressure on marine resources. Partial protection already exists in the El Kala National Park (El Tarf) and the Taza National Park (Jijel), and both the Taza islets and the Habibas marine reserve have been identified as pilot sites for integrated coastal-zone management in Algeria (AFD, 2018).
3.5. Limitations and perspectives
Several limitations of the present methodology should be acknowledged so that subsequent applications can build on a clear methodological footing.
First, the model relies on a combination of secondary sources, remote-sensing data and expert elicitation; it does not yet incorporate ground-truthing of the ecological state of each site by in-situ surveys. While this is consistent with the rapid-assessment design philosophy of the methodology (Angelidis and Kamizoulis, 2005; Archer-Rand et al., 2021), future iterations would benefit from cross-validation against independent ecological-quality indicators such as the AMBI, the M-AMBI, or the Ecological Quality Status of Posidonia oceanica meadows (Borja et al., 2000; Buonocore et al., 2021).
Second, the GVI is a single-point snapshot. Scoring thresholds (Table 2) are static and do not yet capture temporal dynamics such as seasonal tourism peaks, multi-year fishing-fleet trajectories or climate-driven shifts in mass-mortality-event frequency. Periodic recomputation (e.g. every 3 – 5 years) and the introduction of a temporal-trend component are obvious extensions.
Third, only 36 of the 611 inventoried insular features were analysed. The four selection criteria stated in Section 2.1 were applied consistently but remain qualitative. A more formal site-selection procedure for instance, a stratified random sampling design that respects the size, isolation and protection-status distributions of the 611 sites would strengthen the inference from sample to population.
Fourth, certain ecologically significant pressures are not yet represented in the criteria set. Posidonia oceanica meadow condition, finer water-quality parameters (turbidity, nutrients, hydrocarbons) and marine-litter density are notable gaps. Adding these criteria is straightforward within the present hierarchical AHP architecture and is recommended for the next iteration of the model.
Fifth, expert elicitation introduces an irreducible component of subjectivity into the weighting. The Monte-Carlo sensitivity analysis demonstrates that rankings remain robust under ±20 % weight perturbations, but a Delphi-style multi-round elicitation across a larger international expert panel would further consolidate the weights and broaden the geographical applicability of the framework.
4. Conclusion
This study proposes a rapid assessment method for evaluating the vulnerability of coastal insular environments, applied to the best of the authors' knowledge in the international peer-reviewed literature across the entire Algerian coastline. By combining a grid of 21 ecological, socio-economic and environmental criteria with weights derived from a hierarchical Analytic Hierarchy Process (AHP) whose consistency ratios all satisfy Saaty's CR < 0.10 threshold, the Global Vulnerability Index (GVI) classifies sites by their level of exposure to anthropogenic pressures.
The results reveal significant regional contrasts, reflecting specific dynamics across the different coastal sectors. The western sector stands out for its high heterogeneity, encompassing both nearly pristine sites and others heavily degraded; this disparity reflects the coexistence of protected or remote islands and insular environments subject to intense human use, particularly in areas with high tourism activity (Senouci, 2022). The central sector shows a more homogeneous pattern of vulnerability, attributed to the widespread influence of the Algiers metropolitan area where dense urbanization exerts diffuse but persistent pressure across all sites (Rabehi et al., 2022). The eastern sector occupies an intermediate position: anthropogenic pressures are significant but generally more moderate than in the West, with a profile dominated by fishing activities closely linked to traditional local economies (Mennad et al., 2021b). Each region is therefore subject to a specific combination of pressures shaped by its socio-economic context: the West, marked by tourism and ecological richness; the Centre, influenced by urban density; and the East, shaped by artisanal fishing.
Beyond these regional patterns, the methodological contribution of the work is twofold. First, the hierarchical AHP design ensures that the weighting scheme is fully consistent (CR < 0.10 for all 35 underlying matrices) and reproducible, in line with standard AHP practice (Saaty, 1990; Saaty and Vargas, 2001). Second, the Monte-Carlo sensitivity analysis shows that the rankings are robust to plausible weight uncertainty (mean Spearman ρ > 0.98 under ±20 % perturbation), which strengthens the operational value of the GVI as a decision-support tool for coastal management.
Beyond its methodological contributions, this study carries direct implications for the coastal communities whose livelihoods depend upon Algeria's insular environments. Although Algeria's islands are uninhabited, the populations of adjacent mainland shores fishing villages, harbour communities, and tourism operators are both the primary drivers of the pressures the GVI captures and the principal users of the ecological and cultural resources these sites provide. In the western sector, unregulated tourism threatens not only sensitive marine habitats but also the traditional practices of nearby coastal populations. In the central sector, urban pressure from the Algiers metropolitan area degrades the insular environments that surrounding communities rely upon for fishing and recreation. In the eastern sector, the intermediate vulnerability profile masks a fragile equilibrium between artisanal fishing economies and ecological capacity one that climate variability or expanded commercial effort could rapidly destabilise. By providing transparent, reproducible, and updatable vulnerability scores, the GVI offers coastal managers a decision-support tool that can be developed in dialogue with these communities, serving both scientific knowledge and the resilience of the coastal societies whose livelihoods depend on the health of Algeria's insular environments.
Acknowledgement
The authors would like to express their sincere gratitude to Professor Hafferssas for his invaluable support in the statistical verification of the model developed in this work. His rigorous expertise and insightful guidance greatly contributed to the methodological robustness of this study. The authors also thank the five members of the expert-elicitation panel for their time and field knowledge.
Appendices
References
- AFD. 2018. Gérer durablement les littoraux algériens. Project report. Available at: https://www.afd.fr/fr/projets/gerer-durablement-les-littoraux-algeriens [Accessed: 25 June 2025].
- Agresti, A., 2007. An Introduction to Categorical Data Analysis, 1st ed, Wiley Series in Probability and Statistics. Wiley. https://doi.org/10.1002/0470114754
- Angelidis, M.O., Kamizoulis, G., 2005. A Rapid Decision-Making Method for the Evaluationof Pollution-Sensitive Coastal Areas in the Mediterranean Sea. Environmental Management 35: 811–820. https://doi.org/10.1007/s00267-003-0300-2
- Archer-Rand, S., Whomersley, P., O’Connor, J., Dosell, A., 2021. Rapid Assessment of Seabed Habitats Around Pitcairn Island in Aid of Activity Management During the COVID-19 Global Pandemic. Front. Mar. Sci. 8: 640505. https://doi.org/10.3389/fmars.2021.640505
- Asara-Marfo, D., Birol, E., Gonzalez, C., Moursi, M., Perez, P., Schwarz, J., Zeller, M., 2013. Prioritizing countries for biofortification interventions using country-level data.
- Bara Dème, E. hadj, Touron-Gardic, G., Failler, P., 2024. Latent and open conflicts in artisanal fisheries of the ecoregion within the Sub-Regional Fisheries Commission (CSRP) member states: Current tensions and future challenges. VertigO Volume 24.
- Belhouari, B., 2018. Assessment of the state of littoral waters in Algeria : Guidelines and recommendations. Environmental and Water Sciences public Health and Territorial Intelligence Journal, 41-44 Pages. https://doi.org/10.48421/IMIST.PRSM/EWASH-TI-V2I1.11299
- Benabdi, M., Ben Hadj, S., Charbonnel, E., Harmelin, J.G., Lelong, P., Robert, P., 2016. Etat de référence de l’ichtyofaune de la réserve marine des îles Habibas (Algérie).
- Bentaallah, M.E.A., 2022. Biodiversité et Changements Globaux. Polycopié de cours, L3 Écologie et Environnement. Département des Sciences Biologiques, Faculté des Sciences et de la Technologie, Université de Relizane, Algérie.
- Borja, A., Franco, J., Pérez, V., 2000. A Marine Biotic Index to Establish the Ecological Quality of Soft-Bottom Benthos Within European Estuarine and Coastal Environments. Marine Pollution Bulletin 40: 1100–1114. https://doi.org/10.1016/S0025-326X(00)00061-8
- Bouchoucha, M., Derolez, V., Munaron, D., Gonzalez, J.-L., Cimiterra, N., Tomasino, C., 2019. Directive Cadre sur l’Eau. Bassin Rhône Méditerranée Corse - Année 2018 (No. n° 2017-1887). Ifremer, Laboratoire Environnement Ressources Provence Azur Corse.
- Buonocore, E., Grande, U., Franzese, P.P., Russo, G.F., 2021. Trends and Evolution in the Concept of Marine Ecosystem Services: An Overview. Water 13, 2060. https://doi.org/10.3390/w13152060
- Carlier, A., Desroy, N., Fabri-Ruiz, S., Vogel, C., Biseau, A., Bacher, C., Ulrich, C., Cuif, M., 2022. Analyse comparative des protocoles de réalisation des états de référence des suivis halieutiques et benthiques dans le cadre des autorisations des parcs éoliens en mer et de leurs raccordements (Expertise). DGEC - Direction Générale de l’Energie et du Climat, Ministère de la Transition Energétique, Paris-La Défense.
- Davoine, P., Josselin, D., Pinet, F., 2021. 16th Spatial Analysis and Geomatics Conference. La Rochelle.
- Ducrotoy, J.-P., 2018. Les milieux estuariens et littoraux: une approche scientifique pour les préserver et les exploiter durablement. Lavoisier-Tec & doc, Paris.
- EMODnet., 2025. European Marine Observation and Data Network [database on the Internet]. Available from: https://emodnet.ec.europa.eu/ (Accessed: January 2026).
- Garrabou, J., Gómez-Gras, D., Ledoux, J.-B., Linares, C., Bensoussan, N., López-Sendino, P., Bazairi, H., Espinosa, F., Ramdani, M., Grimes, S., Benabdi, M., Souissi, J.B., Soufi, E., Khamassi, F., Ghanem, R., Ocaña, O., Ramos-Esplà, A., Izquierdo, A., Anton, I., Rubio-Portillo, E., Barbera, C., Cebrian, E., Marbà, N., Hendriks, I.E., Duarte, C.M., Deudero, S., Díaz, D., Vázquez-Luis, M., Alvarez, E., Hereu, B., Kersting, D.K., Gori, A., Viladrich, N., Sartoretto, S., Pairaud, I., Ruitton, S., Pergent, G., Pergent-Martini, C., Rouanet, E., Teixidó, N., Gattuso, J.-P., Fraschetti, S., Rivetti, I., Azzurro, E., Cerrano, C., Ponti, M., Turicchia, E., Bavestrello, G., Cattaneo-Vietti, R., Bo, M., Bertolino, M., Montefalcone, M., Chimienti, G., Grech, D., Rilov, G., Tuney Kizilkaya, I., Kizilkaya, Z., Eda Topçu, N., Gerovasileiou, V., Sini, M., Bakran-Petricioli, T., Kipson, S., Harmelin, J.G., 2019. Collaborative Database to Track Mass Mortality Events in the Mediterranean Sea. Front. Mar. Sci. 6: 707. https://doi.org/10.3389/fmars.2019.00707
- Grooten, M., Almond, R.E.A., 2018. Living planet report 2018: aiming higher. WWF-World Wide Fund for Nature, Gland, Switzerland.
- Khatib Zagh, N., 2017. Contribution à l’évaluation de la pollution marine dans la côte algéroise. Combinaison des méthodes biologiques et physicochimiques. Université des Sciences et de la Technologie Houari Boumediene.
- Lasne, G., Fernandez, J.-M., Laugier, T., Letourneur, Y., Payri, C.É., Soulard, B., Tessier, E., Van Wynsberge, S., 2022. Guide pour le suivi de la qualité du milieu marin en Nouvelle-Calédonie. https://doi.org/10.34928/DR77-SZ84
- Leoni silva, V., 2022. Ecology of Rhizostoma pulmo in the southern European seas : From biogeography to population dynamics / Valentina Leoni silva ; sous la direction de Juan Carlos Molinero Vargas. Université de Montpellier.
- Li, L., Shi, Z.-H., Yin, W., Zhu, D., Ng, S.L., Cai, C.-F., Lei, A.-L., 2009. A fuzzy analytic hierarchy process (FAHP) approach to eco-environmental vulnerability assessment for the danjiangkou reservoir area, China. Ecological Modelling 220: 3439-3447. https://doi.org/10.1016/j.ecolmodel.2009.09.005
- Magnan, A., Garnaud, B., Billé, R., Gemenne, F., Hallegatte, S., 2009. Des impacts du changement climatique aux enjeux de l’adaptation.
- MATE. 2014. La Mise En Oeuvre De La Convention Sur La Diversite Biologique Au Niveau National (Rapport National No. 5ème).
- MATE. 2006. Programme d’Aménagement Côtier “Zone côtière algéroise” Rapport final intégré. Ministère de l’aménagement du territoire et de l’environement.
- Mennad, M., Bouhadja, M., Khouas, B., Bahria, D., Bernardon, M., 2021a. Informations socioéconomiques sur la pêche à Annaba, Algérie. FAO. https://doi.org/10.4060/cb1914fr
- Mennad, M., Mekhazni, L., Mokrane, Z., Inal, A., Filali, T., Bernardon, M., 2021b. L’approche écosystémique des pêches sur la côte ouest de Béjaïa en Algérie. FAO. https://doi.org/10.4060/cb6886fr
- Mouret, V., 2008. Petites îles de Méditerranée 08.
- Nguyen, A.K., Liou, Y.-A., Li, M.-H., Tran, T.A., 2016. Zoning eco-environmental vulnerability for environmental management and protection. Ecological Indicators 69: 100–117. https://doi.org/10.1016/j.ecolind.2016.03.026
- Noorbakhsh, F. 1998., A Modified Human Development Index. World Development 26: 517–528. https://doi.org/10.1016/S0305-750X(97)10063-8
- Obura, D., Grimsditch, G. 2009., Resilience assessment of coral reefs: assessment protocol for coral reefs, focusing on coral bleaching and thermal stress. IUCN, Gland, Switzerland.
- Parent, B. 2019. Développement d’un indice biotique basé sur les foraminifères benthiques: application sur la façade méditerranéenne française.
- Pascal, D.M., Corinne, C., Patrice, M., Michel, V., Yann, L.C., Antoine, G., Clémentine, G., Jocelyne, P.-H., Cyril, R., Carolyne, V., 2020. Method for the rapid assessment and potential mitigation of the environmental effects of development actions in riparian zone. Journal of Environmental Management 276: 111187. https://doi.org/10.1016/j.jenvman.2020.111187
- Pillet, V., 2021. Détection et attribution des changements morphologiques côtiers récents en milieu insulaire tropical (Polynésie française, Caraïbe).
- Pinel, R., 2024. Usages et conservations des milieux marins : les sociétés humaines à l’ère des changements globaux. Regards croisés sur l’insularité à La Réunion et à Tahiti.
- PNUE/PAM-CAR/ASP., 2005. Propositions pour inscription sur la liste des ASPIM. Septième Réunion des Points Focaux Nationaux pour les ASP. SÉVILLE.
- Rabehi, W., Guerfi, M., Mahi, H., 2022. Cartographie de la vulnérabilité des communes de la baie d’Alger: Approche socio-économique et physique de la côte. mediterranee. https://doi.org/10.4000/mediterranee.8625
- Saaty, T. 1990. How to make a decision: The Analytic Hierarchy Process. European Journal of Operational Research 48.
- Saaty, T.L., Vargas, L.G., 2001. Models, Methods, Concepts & Applications of the Analytic Hierarchy Process, International Series in Operations Research & Management Science. Springer US, Boston, MA. https://doi.org/10.1007/978-1-4615-1665-1
- Schultz, M., 2022. Evaluation du potentiel de l’imagerie multispectrale satellitaire pour le suivi des récifs coralliens à La Réunion.
- Senouci, R., 2022. Évolution spatio-temporelle du littoral de Mostaganem : Morphologie, Occupation du sol et Identification des sites à géo-risques côtiers. Université de Mostaganem-Abdelhamid Ibn Badis.
- Simboura, N., Zenetos, A., 2002. Benthic indicators to use in Ecological Quality classification of Mediterranean soft bottom marine ecosystems, including a new Biotic Index. Medit. Mar. Sci. 3, 77. https://doi.org/10.12681/mms.249
- Smit, K.P., Bernard, A.T.F., Lombard, A.T., Sink, K.J., 2021. Assessing marine ecosystem condition: A review to support indicator choice and framework development. Ecological Indicators 121, 107148. https://doi.org/10.1016/j.ecolind.2020.107148
- Word, J.Q., 1978. The Infaunal Trophic Index (Annual report). Southern California Coastal Water Research Project.
- Yoo, G., Kim, A.R., Hadi, S., 2014. A methodology to assess environmental vulnerability in a coastal city: Application to Jakarta, Indonesia. Ocean & Coastal Management 102: 169–177. https://doi.org/10.1016/j.ocecoaman.2014.09.018