A Closer Look at the Ulot Watershed in Samar Island Natural Park (SINP): Physical Characteristics and Anthropogenic Impacts
Abstract
The Ulot Watershed, situated in Samar Island Natural Park (SINP) Philippines, yields critical ecosystem services to the communities surrounding it. This study assessed the physical characteristics, natural landscapes, anthropogenic features and political boundaries of Ulot Watershed which prove crucial to the overall functionality of the watershed. Covering approximately 87,986 hectares, the watershed bounded by the municipalities of San Jose de Buan, Maslog and Dolores in the north, by Hinabangan and Taft in the south, by Can-avid in the east, and by San Jorge in the west, features a diverse range of physical characteristics, including significant elevation gradients (0 to 798.04 meters) and a complex hydrological network with a total stream length of 2,611 km. The analysis of slope distribution reveals a predominance of steep terrains, necessitating effective land management strategies to mitigate erosion risks. Rainfall data over 21 years indicates a moderately wet climate, influencing water availability and vegetation dynamics. Despite its ecological significance, the watershed faces pressures from anthropogenic activities of around 12,600 people, notably unsustainable farming practices and deforestation, leading to biodiversity loss and compromised water quality. This study underscores the urgent need for integrated conservation and management strategies to safeguard the Ulot Watershed’s natural landscapes and ecological integrity, ensuring it continues to provide essential ecosystem services to local communities.
Keywords
Samar Island, watershed conservation, GIS, Ulot watershed, watershed characterization
Introduction
A watershed is an area of land where all the water, whether from rain or streams, flows into one common point. Rivers, wetlands, and reservoirs are all considered as watersheds (DAO, 2021; Aldridge and Baker, 2017). Also called "drainage basins" or "catchments," watersheds greatly vary in size, ranging from less than 10,000 hectares to more than 50,000 hectares (DAO 2021-41 s. of 2021). The Philippines has 421 watersheds that span 21 million hectares, covering 70% of the country’s 30-million-hectare land area (ERDB, 2022). Of the 421 watersheds, 131 are categorized as critical watersheds spanning 14.2 million hectares or 47% of the total watershed area (FMB, 2021). These watersheds are incredibly important because they provide essential support to rural communities, especially those involved in farming and forestry (Baguinon et al., 2007; Baliton et al., 2017). When these areas are well managed, they offer essential services like supplying water for homes, farms, and businesses, and also providing wood and other natural resources. They also shelter a wide variety of plants and animals, while playing key roles in preventing floods, managing droughts, and keeping the local climate in check. Furthermore, watersheds are vital for industries like tourism, fishing, forestry, agriculture, and mining, making them crucial for both environmental health and economic growth (PCAARRD, 1999).
Understanding watersheds is key to managing water resources in a sustainable way. It allows us to figure out how much water is available, keep track of its use, and ensure its continued availability for the communities and various industries. In areas that are ecologically sensitive, knowing more about a watershed helps pinpoint places that need special attention, whether for protection or restoration, to maintain services like clean water, carbon storage, and wildlife habitats (Postel and Thompson, 2005). With climate change affecting water cycles, studying watersheds has become even more critical to help us handle challenges like water shortages and flooding (IPCC, 2014).
One of the Philippines’ largest watersheds is the Ulot watershed, which covers around 87,536 hectares. Of this, about 56,680 hectares are part of the Samar Island Natural Park (International Model Forest Network, 2022). The name was derived from the word "Ulot" in Waray dialect, which means monkey, a common wildlife in the area. The natural landscape is rich with dense rainforests and diverse river ecosystems, which are home to endangered species like the Philippine Eagle and the Samar Tarictic Hornbill (DENR, 2019). Ulot Watershed drains mostly to the Ulot River, the longest river system in SINP playing a critical role in aquatic ecosystem sustainability and the village communities in the vicinities. However, the Ulot Watershed is threatened by human activities, particularly agriculture and eco-tourism. While these activities provide livelihoods for local people, they also create challenges for the long-term sustainability of the watershed's natural resources (Lasco and Pulhin, 2006). Furthermore, despite being one of the eight most important watersheds in the Eastern Visayas region of the Philippines, the Ulot watershed remains unexplored and underexamined. Thus, there is a need to study it. Understanding watershed boundaries is crucial for effective management and conservation, as it shows where regulation is needed (Baguinon et al., 2007). Knowing its slope, elevation, and land cover is also important since these physical features heavily influence water quality and availability (Dingman, 2015; Ponce, 2014). Geographic Information System (GIS) has been used for many years as a tool in analyzing watersheds, including but not limited to boundary delineation, sub‑watershed partitioning, and analysis of terrain, slope and drainage networks, using digital elevation models (DEMs). GIS enables scientists and researchers to have a detailed geomorphological and morphometric assessment, making it a reliable decision support tool in management (Choi et al., 2005; Colby, 2019; Kaira et al. 2024)
This study aims to conduct a characterization and assessment of the Ulot Watershed by delineating its geo-political boundaries, evaluating its physical characteristics, identifying its natural landscapes, and analyzing the potential impacts of anthropogenic activities on the Ulot River and the neighboring village communities. This will enhance understanding of the Ulot Watershed and provide data for its sustainable management. This study also hopes to provide insights on appropriate conservation strategies to adopt, support sustainable development in the area and contribute to achieving several Sustainable Development Goals (SDGs), including SDG 2 (Zero Hunger), SDG 6 (Clean Water and Sanitation), SDG 11 (Sustainable Cities and Communities), SDG 12 (Responsible Consumption and Production), SDG 14 (Life Below Water), and SDG 15 (Life on Land).
Materials and Methods
Study Area
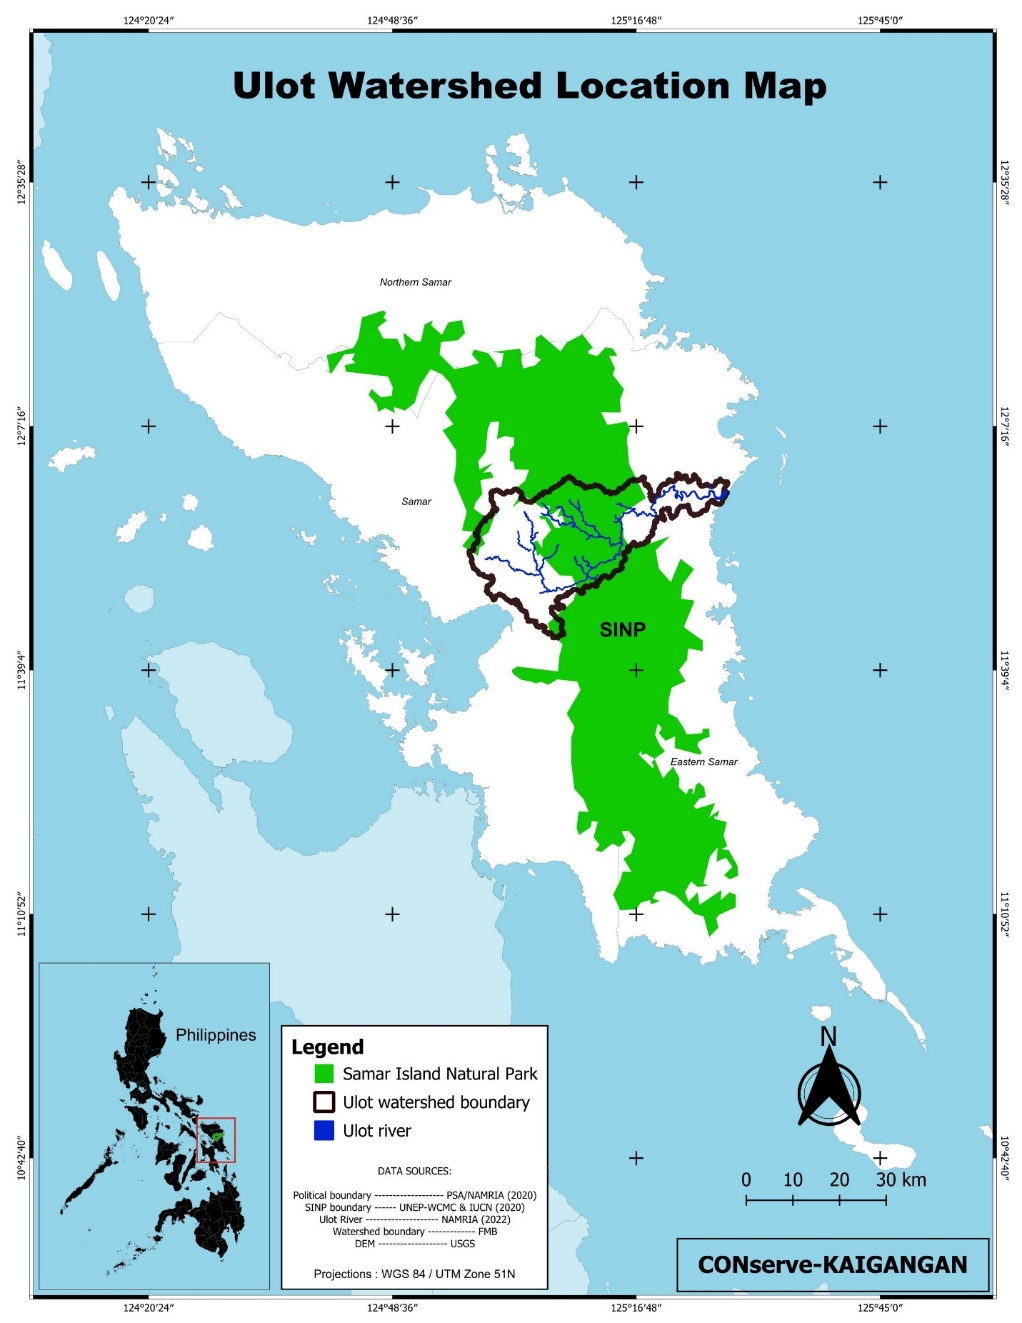
Ulot watershed, also known as the Can-avid Watershed, is located at the central part of Samar Island, approximately between 11° 50’ 34” North, 124° 56’ 38” East and 11° 59’ 25” North, 125° 26’ 55” East (Figure 1). It has a total land area of about 87,986 hectares. About 56,680 hectares of Ulot watershed are part of the Samar Island Natural Park (SINP) (International Model Forest Network, 2022). It is one of the largest watersheds in the Philippines, one of the 29 watersheds on Samar Island, and the eight most important watershed in the region. At the heart of this watershed is the Ulot River, the longest river in Samar, which runs over 90 kilometers and, including its tributaries, extends to more than 500 kilometers (House Bill No. 6000). The river starts in the municipalities of San Jose de Buan, Jiabong, and Motiong, flows through Paranas, and eventually reaches Can-avid in Eastern Samar. A recent study on Ulot River conducted by Ciasico et al. (2023), found that it stretches 112 kilometers from its headwaters to the river’s mouth and has a span of about 52 meters and is 3 meters deep. During heavy rains, the river can rise to 6 meters, which is higher than the riverbanks at 4 meters, causing the floodplain to expand to 13 meters wide (Ciasico et al., 2023).
Data Acquisition
This study began with the acquisition of key spatial and non-spatial datasets relevant to the Ulot Watershed. The official boundary of the watershed was sourced from the Forest Management Bureau (FMB). The administrative boundary data at the provincial, municipal and barangay levels were obtained from Philippine Statistics Authority (PSA) and NAMRIA (2020). The climate type was derived from the Philippines’ climate classification system under the Modified Coronas Classification (MCC). Other climate parameters, particularly rainfall records, were obtained from four meteorological stations surrounding the Ulot Watershed: Borongan (Eastern Samar), Catarman (Northern Samar), Catbalogan (Samar), and Guiuan (Eastern Samar). These data were provided by the Climate and Agrometeorological Data Section (CADS) of the Philippine Atmospheric, Geophysical and Astronomical Services Administration (PAGASA). The use of multiple stations was necessary to adequately capture the spatial variability in rainfall across the watershed.
Land cover data for 2020 were obtained from Geoportal Philippines (www.geoportal.gov.ph), the national database of GIS-based spatial data, and were processed by the National Mapping and Resource Information Authority (NAMRIA). Soil data were also acquired from Geoportal Philippines and are officially provided by the Bureau of Soils and Water Management (BSWM). BSWM applies a national, series-based soil classification system that is closely aligned with the United States Department of Agriculture (USDA) Soil Taxonomy but expressed using locally named soil series for land-use and crop planning. Data on rivers and streams of Samar Island were likewise downloaded from Geoportal Philippines.
Elevation data were obtained from the Digital Elevation Model (DEM) with a high resolution of 5 m x 5 m derived from Interferometric Synthetic Aperture Radar (SAR) data, sourced from the United States Geological Survey (USGS) website (usgs.gov, 2015) and distributed by NAMRIA. Slope data were sourced from the SINP Protected Area Management Board of the Department of Environment and Natural Resources (DENR-PAMB). Information on the natural landscape feature and anthropogenic activities within the Ulot watershed was collected through actual field observations and targeted literature review.
| Parameters | Data Set | Data Type | Data Format | Sources |
|---|---|---|---|---|
| Watershed Boundary | Ulot Watershed | polygon | Shapefile (.shp) | FMB, n.d. |
| Political Boundaries | Administrative boundary (Province, Municipality, Barangay) | polygon | Shapefile (.shp) | PSA/NAMRIA, 2020 |
| Climate | Climate Type | polygon | Shapefile (.shp) | PAGASA, 2024 |
| Rainfall | Annual Rainfall | attribute data | Comma-separated values (.csv) | PAGASA, 2024 |
| Soil | Soil type | polygon | Shapefile (.shp) | BSWM, n.d. |
| Land cover | Land Cover 2020 | polygon | Shapefile (.shp) | NAMRIA, 2020 |
| Rivers and Streams | River network | line | Shapefile (.shp) | NAMRIA, 2020 |
| Elevation | Digital Elevation Model (5m × 5m resolution) | raster | geoTIFF (.tiff) | USGS.GOV, 2015 |
| Slope | Slope data | polygon | Shapefile (.shp) | SINP PAMB-DENR, 2013 |
| Natural and Anthropogenic activities | Field observations and literature review | attribute data | Comma-separated values (.csv) | This study |
GIS Analyses
All spatial datasets were processed and analyzed using an open-source GIS software, Quantum GIS or commonly known as QGIS (version 3.30). Prior to analysis, data cleaning and pre-processing were conducted to remove errors, resolve inconsistencies, and avoid data duplication. All datasets were projected into WGS 84/UTM Zone 51N coordinate system to ensure spatial consistency and accuracy. Standard GIS geoprocessing tools such as clipping and performing unions were applied among various datasets of the study area. Various maps displaying the physical characteristics of the Ulot watershed and highlighting the different features of the land, including political boundaries, rainfall distribution, elevation, slope, hydrological characteristics and land cover types, were created.
Climate type of the watershed is determined and laid out to determine the corresponding type per municipalities. While the rainfall data from the four PAGASA stations were used to compute the average annual rainfall over a 21-year period. Spatial interpolation techniques were applied in QGIS to generate a continuous rainfall surface across the watershed (Li and Wong, 2010; Santos et al., 2017).
Many recent hydrological and erosion studies still rely on DEMs released in the early 2000s–2010s (e.g., SRTM, ASTER, ALOS, CARTO) and use them successfully together with much more recent land cover and climate data (Buakhao and Kangrang, 2016; Admas et al., 2024). Topographic and hydrological attributes depend strongly on DEM source and resolution, but acceptable watershed delineation and streamflow simulations are obtained across DEMs of different years, as long as accuracy is adequate (Buakhao and Kangrang, 2016; Tesema, 2021; Datta et al., 2022).
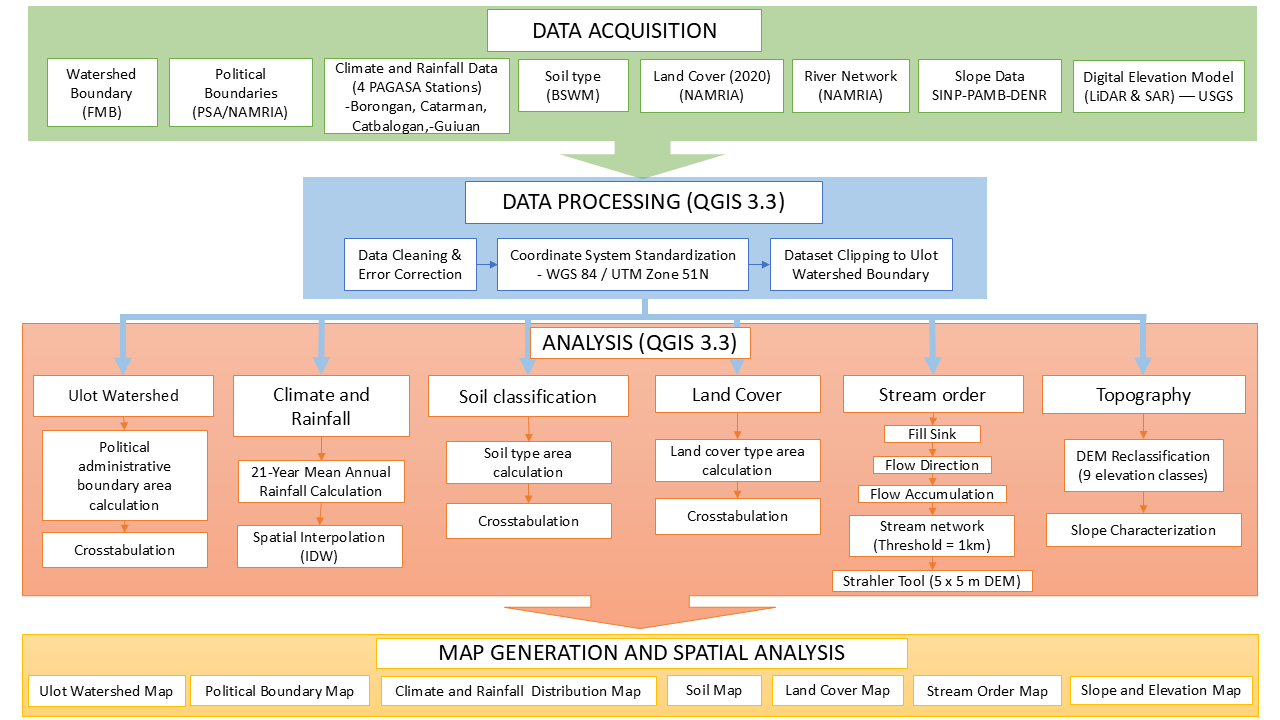
The slope data was requested and obtained from the office managing the SINP, in accordance with the national standard slope classification set by the Department of Environment and Natural Resources (DENR). The elevation of the watershed was processed using a high-resolution (5 m x 5 m) DEM derived using Interferometric Synthetic Aperture Radar (IFSAR), following standard terrain analysis procedures (Burrough and McDonell, 1998). The DEM was reclassified into nine categories to better represent topographic variation and support hydrological analysis. Hydrological analyses were conducted in QGIS using the Terrain Analysis – Hydrology tools of the System for Automated Geoscientific Analyses (SAGA). Stream order was determined by first correcting depressions in the DEM using the Fill Sinks tool (Wang and Liu, 2006). Flow direction and flow accumulation rasters were then generated using the Flow Accumulation (Top-Down) algorithm. Stream networks were extracted based on a flow accumulation threshold corresponding to a drainage area of 1 km², defining the initiation of streams. Finally, the Strahler Order tool was applied using the derived channel network and flow direction rasters, and the resulting stream order output was converted to vector format for further analysis. Figure 2 illustrates the synthesized methodological framework adopted in this study.
Results and Discussion
Geo-political Boundaries of Ulot Watershed
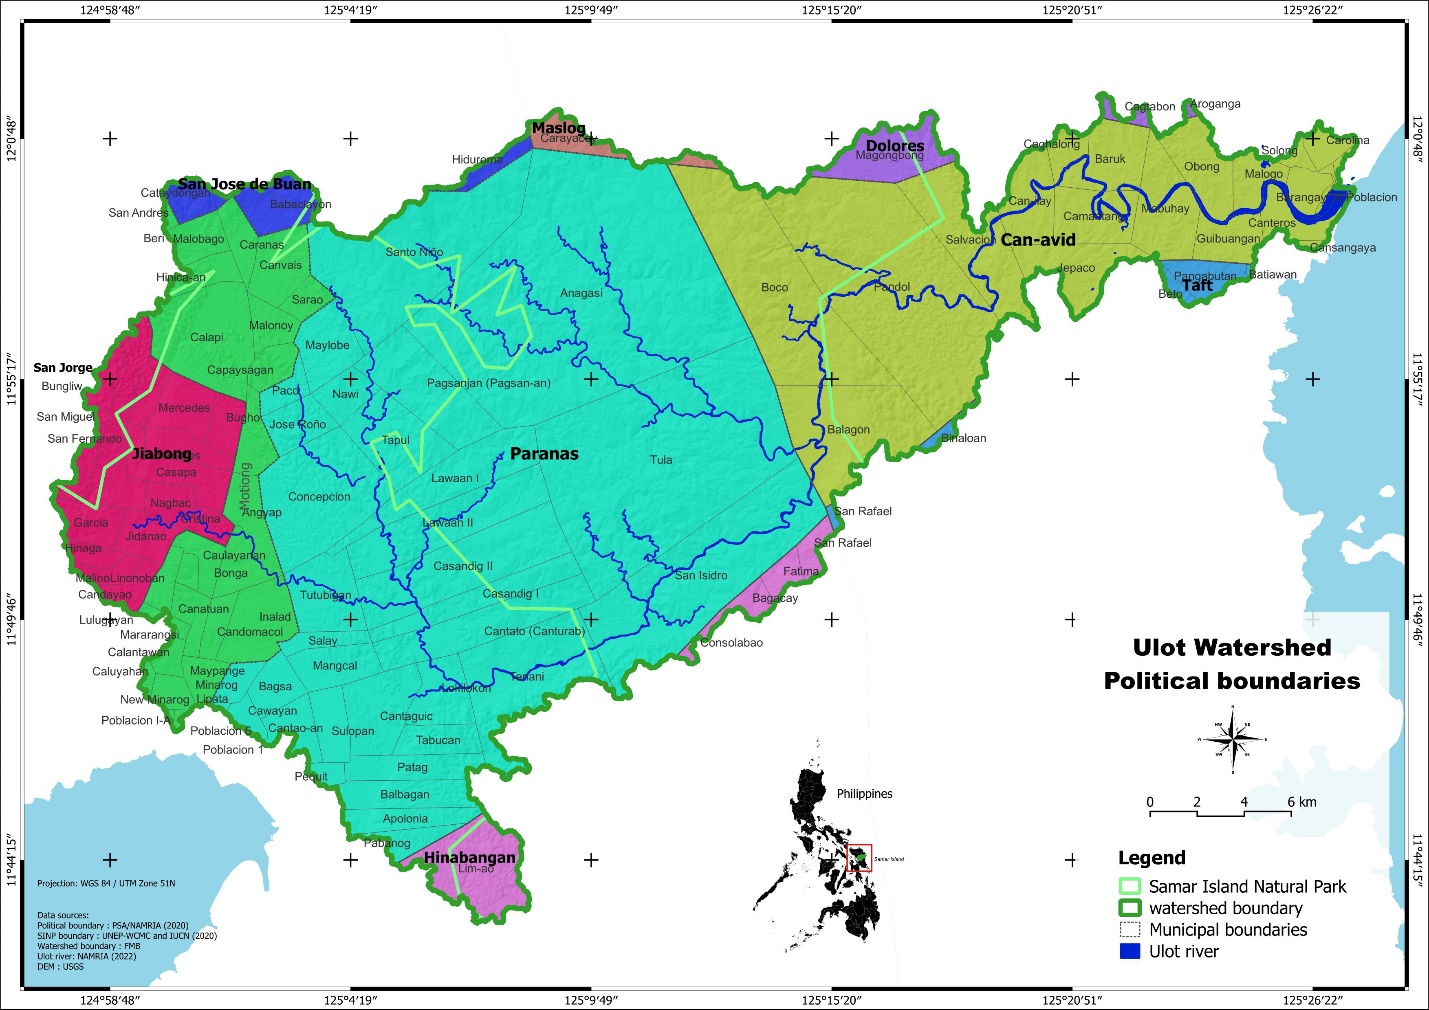
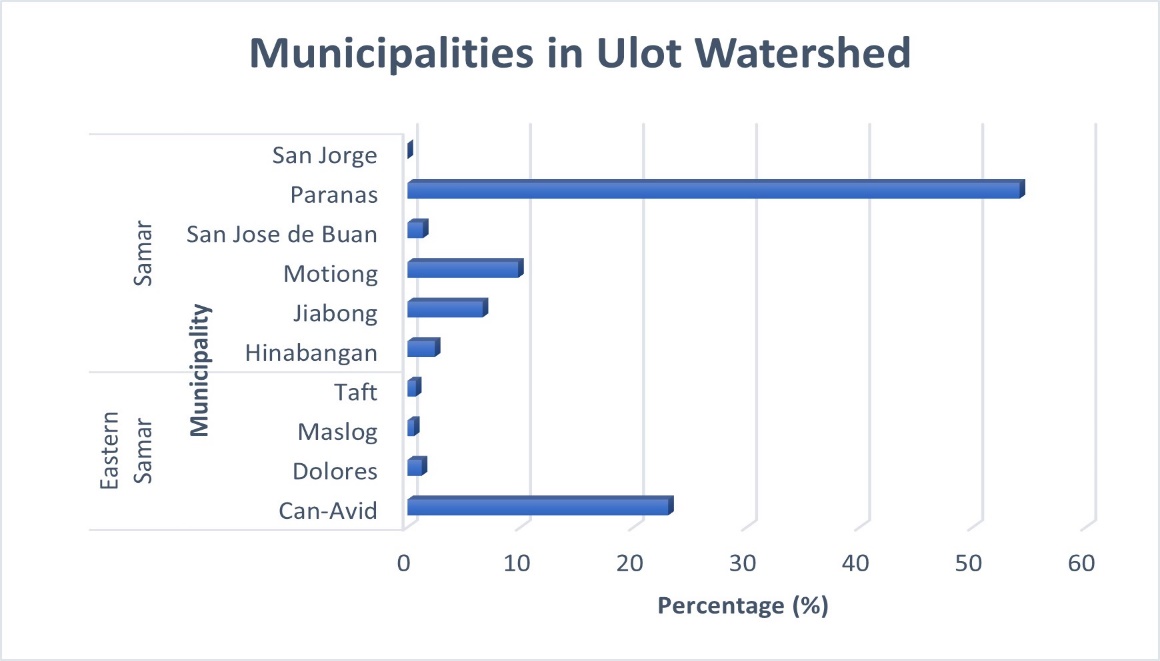
The Ulot Watershed spans the provinces of Samar and Eastern Samar encompassing ten municipalities and 124 barangays (Figures 3 and 4). The municipality of Paranas occupies the largest portion in the Province of Samar with an area covering 54.14% of the watershed and comprises 38 barangays. The municipality of Motiong covers 9.79% of the watershed with 26 barangays. The municipality of Jiabong occupies 6.65% of the watershed with 15 barangays. The municipality of Hinabangan, with 2.42%, comprises 5 barangays, while San Jose de Buan covers 1.36% with 3 barangays, and San Jorge, with a mere 0.0001%, has only one barangay. The municipality of Can-avid in Eastern Samar province comprises of 23.06% of the watershed with 27 barangays. The municipality of Dolores, which corresponds to 1.26% of the watershed, has 3 barangays. The municipality of Taft comprises 0.74% of the watershed, has 5 barangays. Lastly, Maslog accounted for 0.57% of the watershed, with just one barangay (Appendix 1).
Overall, Paranas occupies the largest portion of the Ulot Watershed, followed by Can-avid, while the smallest areas are in San Jorge and Maslog. Additionally, the top six (6) barangays that occupy significant areas of the watershed are located in the municipalitiesappend of Paranas [Anagasi (10,134.77 has), Tula (6,829.74 has), San Isidro (3,745.79 has), and Santo Niño (3,367.39 has)], and Can-avid [Pandol, (5,361 has) and Boco (3,504.56 has)]. This geographical distribution of barangays presents different capacities toward watershed management challenges among municipalities.
Climate Type and Rainfall
According to the Modified Corona System, the Ulot Watershed falls under two climate types: Type II and Type IV (Figure 5). Type II climate is characterized by no distinct dry season and a pronounced maximum rainfall period from November to January (PAGASA, 2020). Approximately 40% of the watershed experiences Type II climate, which is primarily covering the municipalities of Can-avid, Maslog, Taft, and Dolores in Eastern Samar. Some barangays in Paranas and San Jose de Buan in Samar province also fall under this type.
Type IV climate is characterized as evenly distributed rainfall throughout the year. Approximately 60% of the watershed falls under the Type IV climate. There is no distinct dry season, and rainfall is fairly consistent across all months. Understanding these climatic conditions is the basis of effective land and water resource management, given how they control and direct vegetation, agricultural practices, and health conditions in an ecosystem.
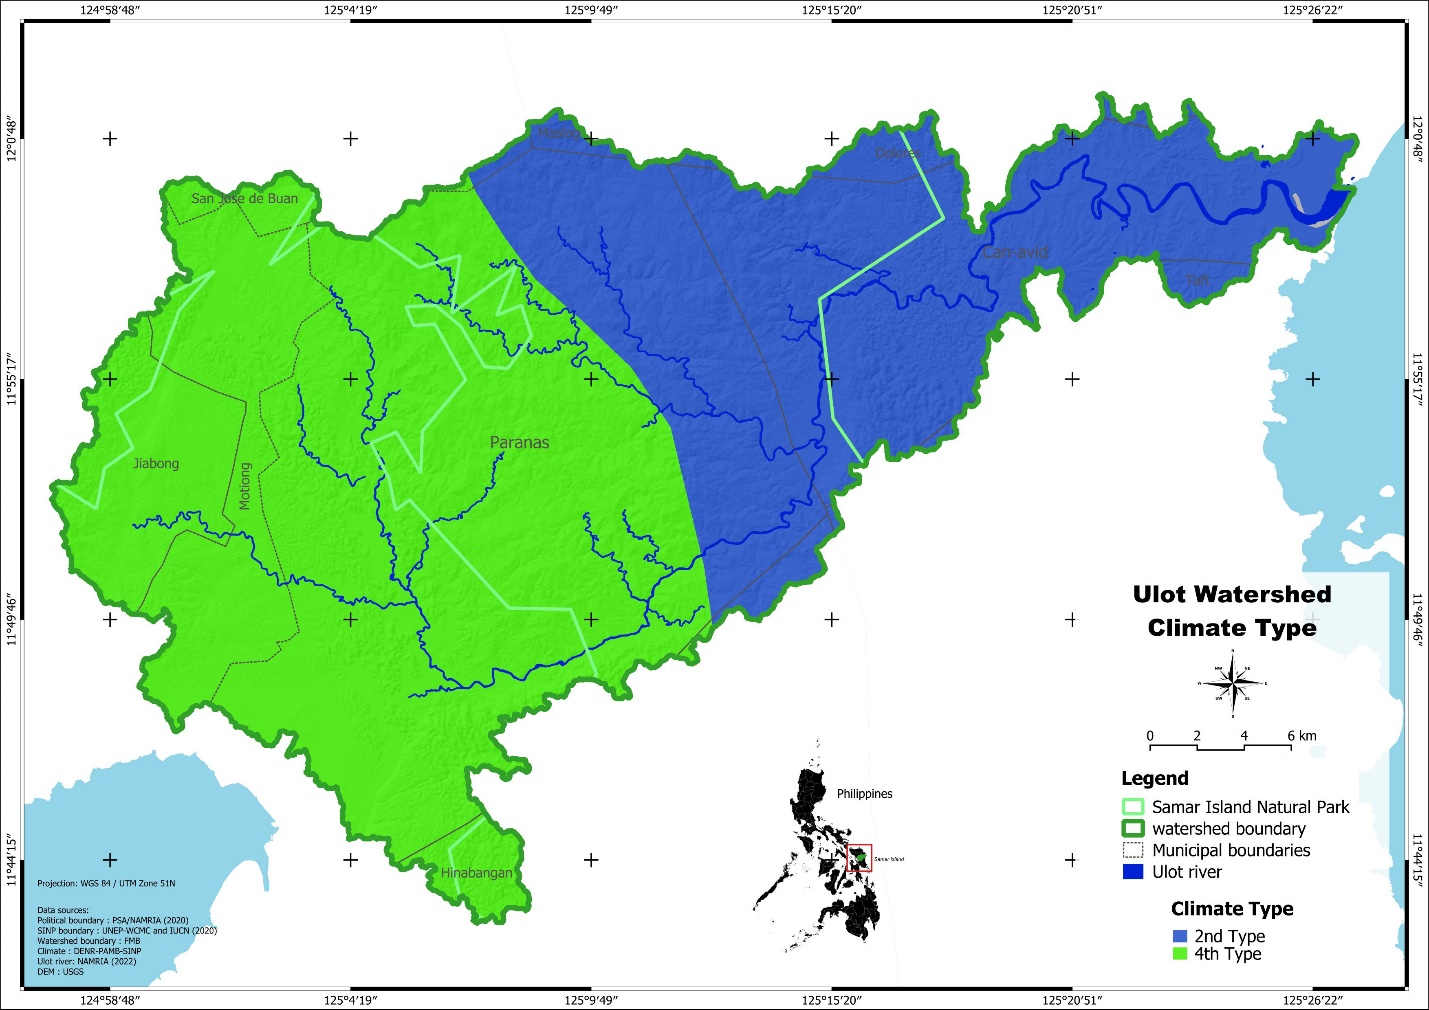
Type II climate is characterized by relatively uniform rainfall throughout the year with no very dry season (PAGASA, 2020). This consistent rainfall supports diversified and productive agricultural practices, which contribute to the improvement of local food security (Baguinon et al., 2007). In contrast, Type IV climate has a distinct dry season where most rainfall occurs during wet months and dry spells during the rest of the year (PAGASA, 2020). Such variability poses challenges for vegetation, threatening biodiversity, particularly in grassland and shrubland ecosystems, and especially sensitive species (Aldrich et al. 2015).
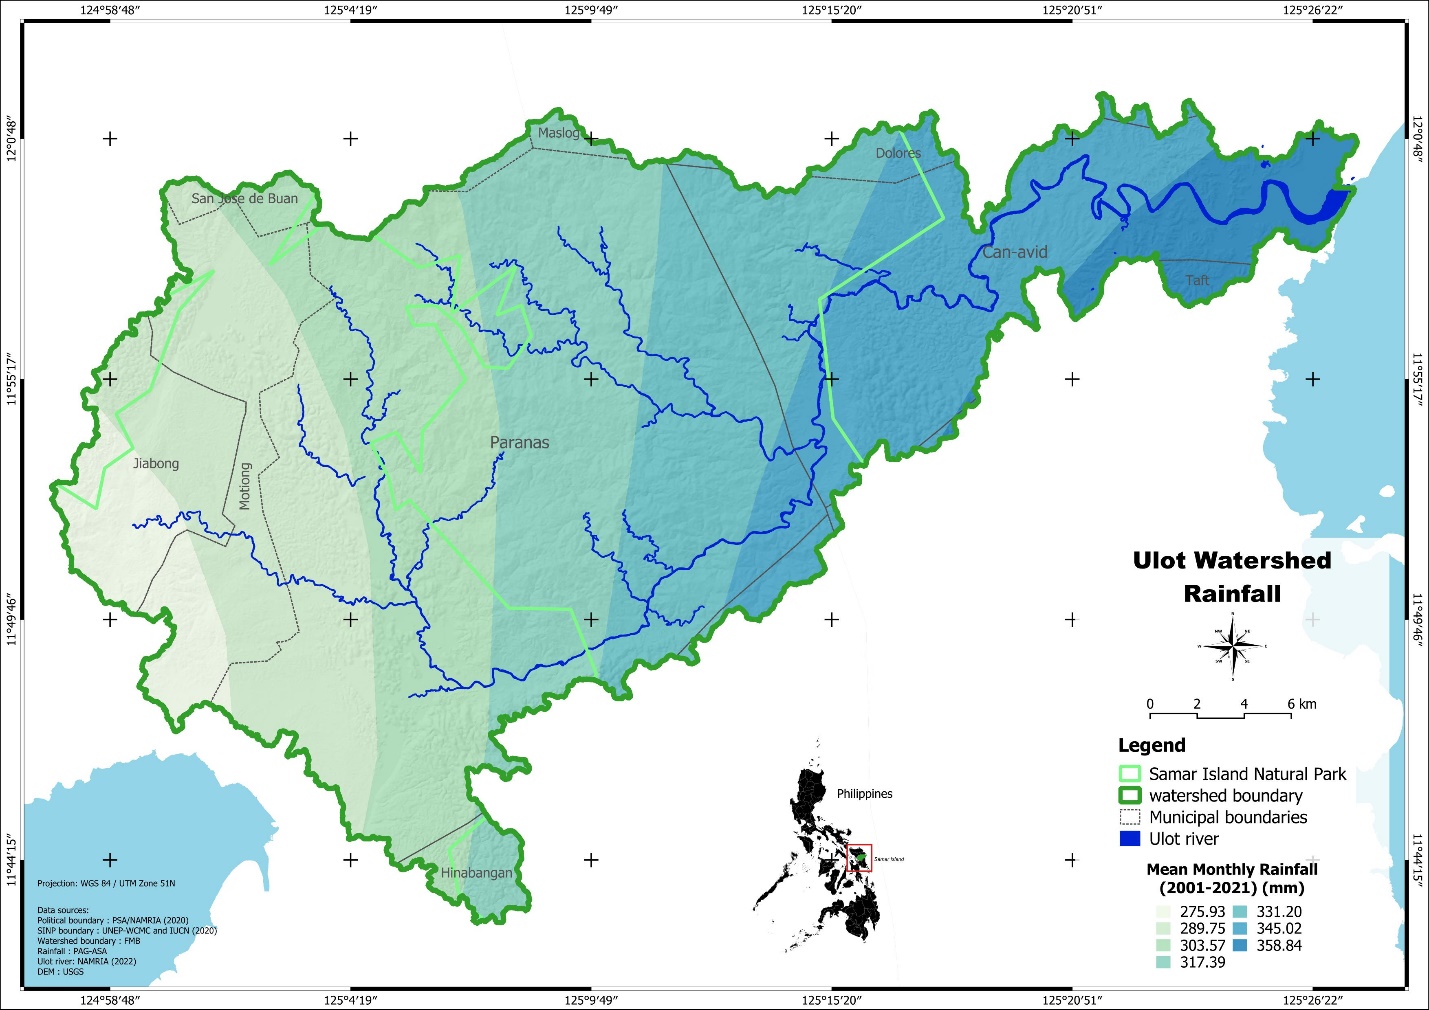
Climate greatly influences hydrology in a watershed. For Type II areas, there is generally more regularity in river flow corresponding to regular rainfall and reliable water supply throughout the year (Baguinon et al., 2007). Conversely, Type IV areas would have varied flows, with high flows during the wet conditions and lower flows during dry conditions. Such variation in water flow needs to be managed to yield adequate ecological and human water needs. Climate classification in the watershed is essential in devising effective management strategies towards an effective balance of meeting local community needs and conserving natural resources. These climatic influences ought to be recognized by policymakers and land managers while planning for sustainable land use and water resource management. A mean monthly rainfall analysis in the Ulot Watershed over a period of 21 years depicts variations ranging from 275.93 mm to 358.84 mm, indicating a moderately wet climate (Figure 6). Knowing the rainfall pattern is of high importance in determining the river flow, hydrological dynamics and water availability in the watershed. Such hydrological factors do not just impact vegetation growth, but also the health of the riparian ecosystem. The maps (Figure 5 and 6) also highlight areas through the river channels that are most susceptible to flooding. River profiles, runoff efficiency, and shifts in hydrological regimes act as indicators of changing climate and rainfall patterns (Waterman et al., 2022; Zhang et al., 2025).
Soil Classification
The Ulot Watershed has six distinct soil types that significantly impact its ecology and agriculture. Mountain soil (undifferentiated) making up 45.9% of the watershed area is commonly found in hilly areas (Figure 7). This soil type has proper drainage but is characterized by a shallow and rocky soil, making it unsuitable for agricultural use. However, it is beneficial in supporting forest cover and stabilizing slopes against erosion, especially for areas with high rainfall. Faraon clay takes up 26.2% of the watershed and dominates in hilly terrains. Famous for its retention of moisture but poor drainage, its heavy texture needs sound water management to mitigate runoff and erosion. These properties are suited for specific agricultural practices with appropriate fertility management (Baguinon et al., 2007). Catbalogan clay loam occupying 12.3% of the watershed balances drainage with water retention, providing fertile ground for various agricultural undertakings, provided that land use practices are properly planned to prevent soil compaction and maintain productivity (Postel and Thompson, 2005). Finally, Bigaa loam which has a balanced texture and nutrient-holding capacity, occupies 7.9% of the area. Its properties make it amenable for agriculture, ensuring adequate drainage that prevents waterlogging and protects root systems from degradation (Lasco et al., 2010). These categories of soils have a critical role in shaping up the watershed’s agricultural landscape as well as ecological integrity.
Other soil types are the Palapaa clay loam (2.1%), Luisiana clay (2%), and San Manuel loam (1.7%). The rarest soil types that provide some variations in textural and compositional diversity are Ubay clay loam (0.8%) and Bugko loamy sand (0.5%). Sandy loam requires prudent fertility management to avoid nutrient losses (Baguinon et al., 2007). Diverse types of soil pose opportunities as well as challenges toward sustainable land use. Areas of mountain soils call for particular observation in soil conservation activities to reduce erosion; clay and loam soils, on the other hand, like Faraon clay and Bigaa loam soil, support agricultural activities if managed properly (Postel and Thompson, 2005).
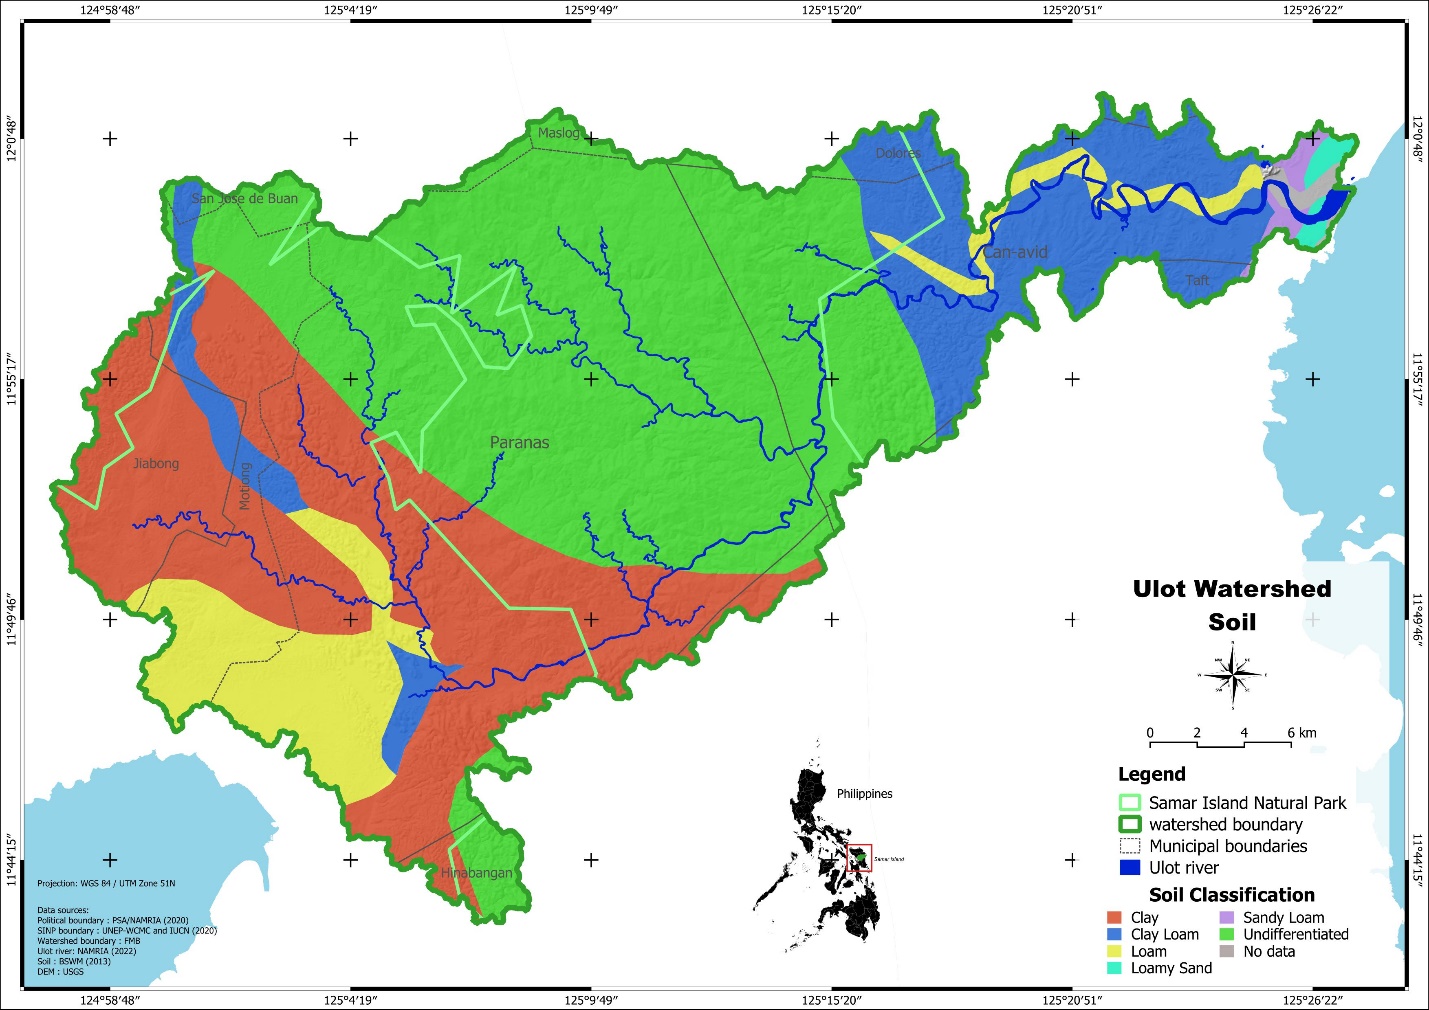
Localized land management techniques should be applied according to soil types. In clay-dominated areas, implementing enhanced drainage strategies combined with environmentally-friendly agricultural practices in loam-rich zones, can rapidly improve the overall health and productivity of the soil (DENR-FMB, 2018). In brief, the varied soil composition plays a crucial role in the hydrology, land-use potential, and conservation priorities of the Ulot Watershed. A full mountain soil area and two notable areas of Faraon clay and Catbalogan clay loam are present. Ongoing research and monitoring of the health of soils will be important for adaptation to environmental changes and optimization of resource use in the region.
Land cover
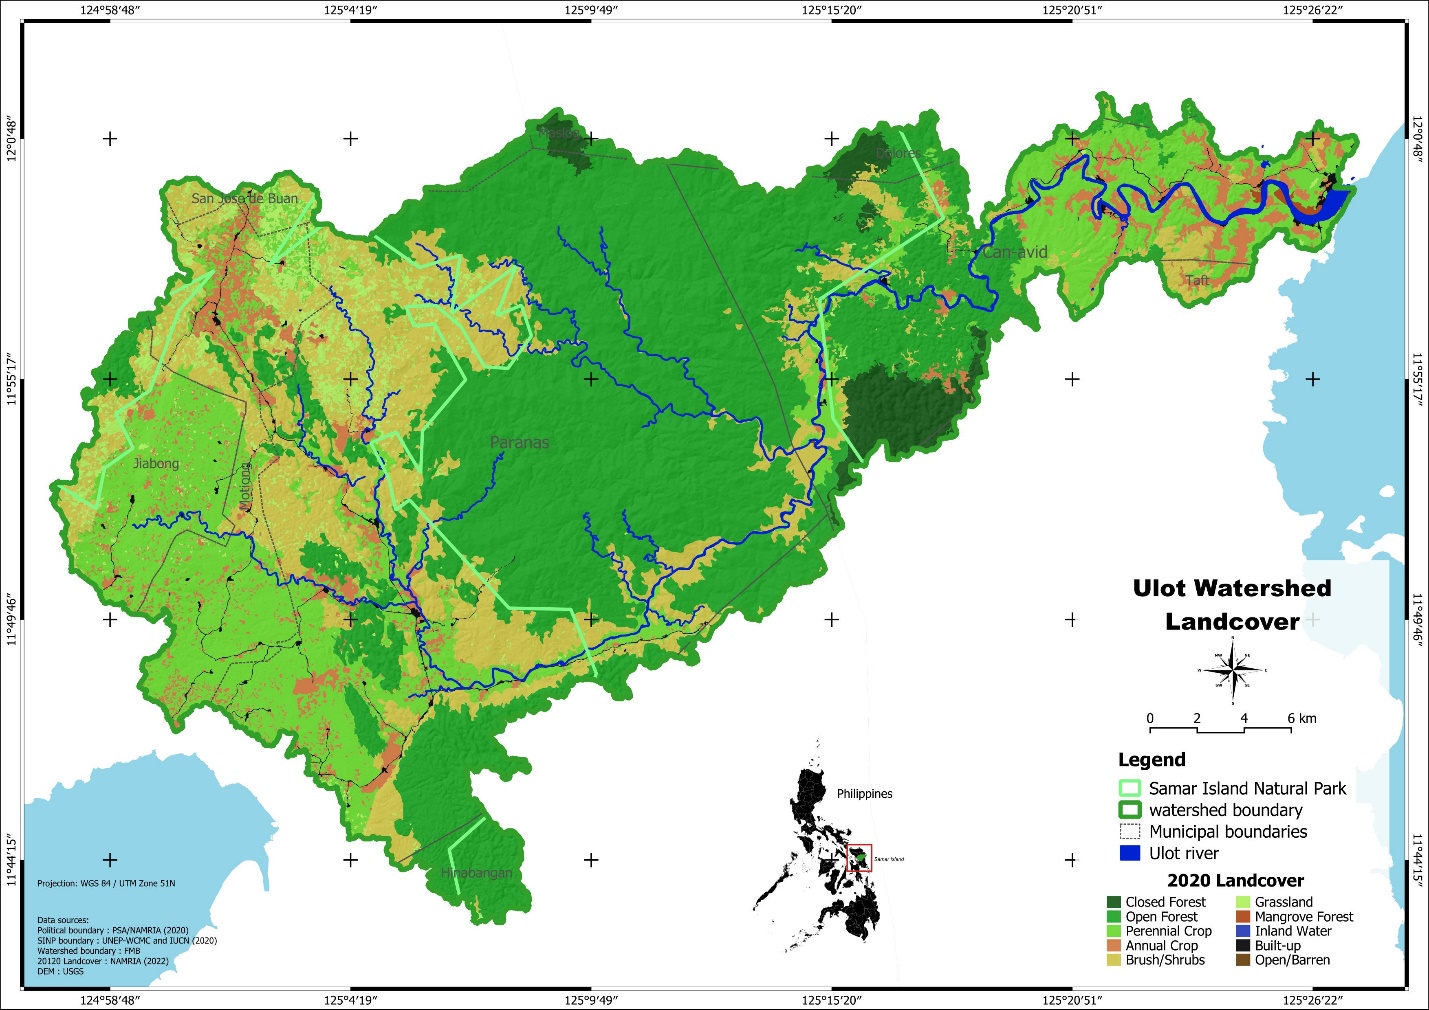
The Ulot Watershed offers diversified land cover in Open Forest areas (46.07%), followed by Perennial crops (22.09%) and Brush/Shrub lands (18.38%) (Figure 8). Closed Forest areas constitute only 2.24% of the total land area which signifies the area needing more targeted conservation (Table 2). The predominance of Open Forest implies that it is a landscape subject to varying levels of disturbance, hence resulting in a lower canopy cover than Closed Forests. Reforestation and agroforestry can also be utilized in such zones to rehabilitate the land, increase productivity, and sustain ecological advantages (Baguinon et al., 2007).
| Land Cover Type | Area (ha) | Coverage (%) |
|---|---|---|
| Annual Crop | 4,710 | 5.35% |
| Brush/Shrubs | 16,168 | 18.38% |
| Built-up | 663 | 0.75% |
| Closed Forest | 1,972 | 2.24% |
| Grassland | 3,290 | 3.74% |
| Inland Water | 1,116 | 1.27% |
| Mangrove Forest | 70 | 0.08% |
| Open Forest | 40,538 | 46.07% |
| Open/Barren | 23 | 0.03% |
| Perennial Crop | 19,436 | 22.09% |
| Total | 87,986 | 100.00% |
Perennial crops covering 22.09% of the watershed area indicates massive agricultural practices. Crops such as coconut and banana ensure livelihoods and enhance food security in the area. It helps conserve soils by aiding soil structure, with less erosion as compared to annual crops (Lasco et al., 2014). Although this conversion of forest land to agricultural zones poses long-term risks for biodiversity and watershed hydrology, balanced agricultural productivity can be reconciled with good ecological health. Therefore, sustainable land management practices such as intercropping and organic farming are fundamental to modernize local farming (Postel and Thompson, 2005).
Brush/Shrub lands constitute 18.38% of the watershed, usually as a result of deforestation or land degradation. These lands lack effective erosion control and water retention just like deforested lands, hence prone to further degradation that could lead to augmented sedimentation in water bodies (Baguinon et al., 2007). Reforestation improves ecosystem services due to rearing of naturally regenerating seedlings (Lasco et al., 2014). Thus, this area should be subject for reforestation to enhance soil integrity and biodiversity. Such areas covering a thousand and more hectares of brush and shrublands are located in barangays Anagasi, Maylobe, Lawaan I and Tenani in Paranas, Samar. The list of other barangays with more than 300 hectares of brushland is seen in Table 3. These barangays are recommended to be prioritized for reforestation activities.
Only 2.24% of Ulot Watershed’s total land area is covered by closed forest consisting of the remaining fragments of the primary forests or mature secondary forests. Fragments of these forests are important to biodiversity conservation and offer superior ecosystem services including enhanced carbon sequestration and climate regulation (DENR-FMB, 2018). It is therefore critical to safeguard these critical zones, as further loss would worsen the biodiversity decline and climate change impacts. Implementing the laws in protecting the forests and promoting community-based conservation activities are the most vital ways of conserving such priceless ecosystems (Postel and Thompson, 2005).
| Province | Municipality | Barangay | Area (ha) |
|---|---|---|---|
| Samar | Paranas | Anagasi | 1,696.51 |
| Samar | Paranas | Maylobe | 1,063.27 |
| Samar | Paranas | Lawaan I | 1,003.81 |
| Samar | Paranas | Tenani | 1,015.49 |
| Samar | Paranas | Tula | 915.22 |
| Samar | Paranas | Pagsanjan | 840.46 |
| Samar | Paranas | Concepcion | 632.45 |
| Samar | Paranas | San Isidro | 601.07 |
| Samar | Paranas | Casandig I | 518.48 |
| Samar | San Jose de Buan | Babaclayon | 476.98 |
| Samar | Paranas | Tapul | 417.26 |
| E. Samar | Can-Avid | Guibuangan | 403.89 |
| E. Samar | Can-Avid | Salvacion | 339.68 |
| E. Samar | Can-Avid | Boco | 333.55 |
The distribution of land covers within the Ulot Watershed presents a case in which there is an obvious need for balancing between conserving forests and agricultural productivity. High Open Forest and Perennial crops and low Closed Forest cover require integrating the ways of integrated land management that embrace sustainable livelihoods with environmentally friendly principles. The main interventions should be reforestation of degraded areas, promotion of agroforestry, and protection of the remaining Closed Forests to sustain ecological integrity and resilience in the watershed.
The physical characteristics of the watershed play an important role in determining its functions and the services it provides, such as water quality regulation, flood control, and other ecosystem services. These characteristics include the area, shape, length, stream order, slope, elevation and land cover. Understanding these characteristics is essential for effective watershed management, especially with increasing challenges from the impacts of climate change and human activities.
Physical Characteristics of Ulot Watershed
Area and Shape of Ulot Watershed
The Ulot Watershed covers a large area, with a perimeter of 257.88 kilometers as analyzed using the QGIS software. Its extensive size plays a crucial role in absorbing stormwater, reducing the intensity of floods and providing a reliable water supply during dry spells (Ponce, 2014). Watersheds defined by ridgelines that separate them from neighboring regions serve as key areas that collect and direct water, sediment, and nutrients across the landscape (Chorley, 1969; Dunne and Leopold, 1978). This watershed is important for the region because it affects both flooding and low water levels, impacting water availability for people and wildlife (Baguinon et al., 2007).
Because of its size and features, the watershed keeps the water levels steady, which is crucial for supporting different species of plants and animals. Consistent water flow is critical for aquatic life (Postel and Thompson, 2005). As climate change creates challenges for water resources, effectively managing the Ulot Watershed is essential for protecting its ecological health and meeting the needs of local communities.
Watershed length and Stream order
The hydrological structure of the Ulot Watershed is characterized by its stream network. Figure 9 shows the stream order analysis of Ulot Watershed using the Strahler method (Strahler, 1957) based on a 5m x 5m resolution. In the Strahler stream ordering system, a stream order is determined by the number of tributaries it receives. The smallest, unbranched tributaries are designated as first-order streams, and the order increases as streams of the same order merge. If streams of different orders meet, the resulting stream takes the order of the higher-order stream. This analysis highlights the critical aspects of the watershed’s hydrological structure, particularly the hierarchical stream length arrangements. These describe how the water flows from small low-order streams to higher-order streams, which is an important consideration in terms of understanding the watershed’s drainage network.
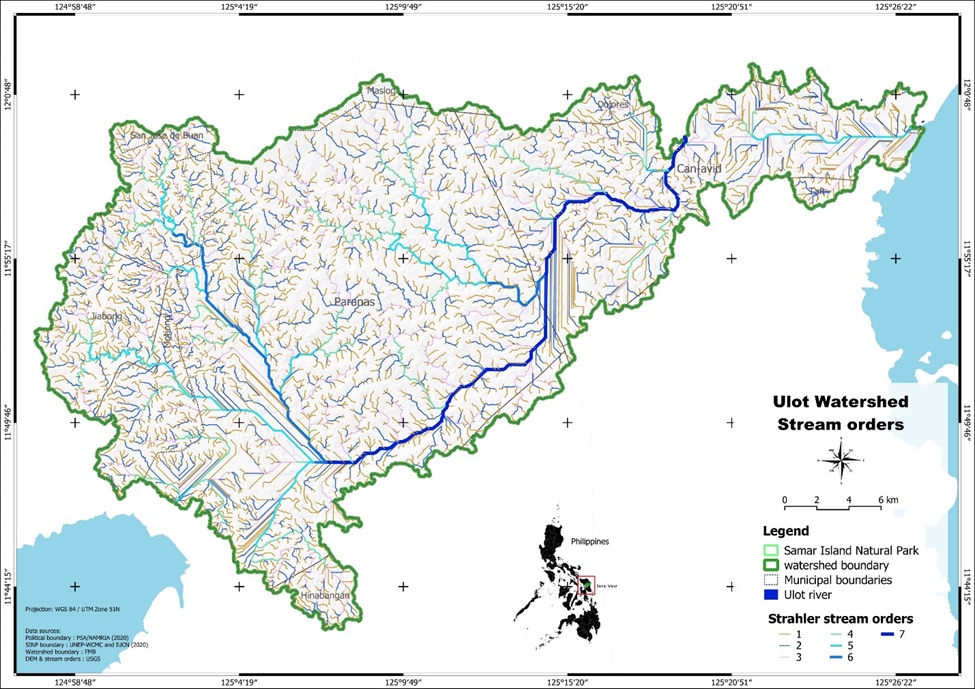
First-Order Streams (1,304.99 km) of the watershed are the most abundant. The long length of these streams indicates a mature network that is efficient in catching surface runoff, especially during intense rainfall events. These streams are also hydrologically sensitive and play an important role in maintaining ecological connectivity, as Horton (1945) and Leopold et al. (1964) emphasized. Second-Order Streams (682.90 km) are formed by the integration of two first-order streams. The recession is a factor of concentration as streams coalesce, where further consolidation into the networks increases the complexity in their dynamics, this time by conditions higher upstream (Strahler, 1957).
Third-Order Streams (324.24 km) are formed when two second-order streams merge together, which is another step of network coalescence. This significantly affects water quality downstream and load transport in the watershed (Knighton, 1998). Fourth-Order Streams (152.89 km) are wider with higher volume and more stable flow regimes due to the large area of the catchment. These streams have a critical role in hydrological balance and supply habitat diversity to the aquatic ecosystems (Allan and Castillo, 2007). Fifth-Order Streams (80.87 km) represent large channels that are linked with upstream hydrological processes. In other words, these streams have significant importance in the flooding regulation and the transport of nutrients inside the watershed (Montgomery and Buffington, 1997). Sixth-Order Streams (26.20 km) are larger tributaries in the stream hierarchy, which transport greater amounts of water and sediments, contributing to major tributaries into higher-order rivers. Seventh-Order Streams (39.04 km), even though fewer in number, are components of the largest channels, playing an important role in hydrological dynamics in the watershed and having a huge impact on downstream water quality and flood management.
The total stream length of 2,611 km in the Ulot Watershed represents a complex and advanced drainage network, important in the regulation of flow, sediments, and nutrient cycling. The hierarchical arrangement of streams does reflect the hydrologic gradient, portraying the shift from the smaller scale of runoff events of the first-order streams to the larger scale of transport by the higher order of streams.
The dense network of first-order streams in a watershed can increase the risk of flash flooding in headwater areas, especially during heavy rainfall, making effective watershed management essential (Poff et al., 1997). As water moves downstream, higher-order streams play a key role in regulating flow and maintaining water quality by absorbing the combined impact of upstream runoff (Knighton, 1998). In Leyte, both low- and high-order streams are widespread, which helps explain why the region often experiences severe flooding. One of the most tragic examples was the 1991 Ormoc City flood, where water from multiple tributaries rushed into the main rivers, causing massive devastation (Bankoff, 2003). More recent studies from Eastern Visayas continue to highlight how heavy rainfall, poor land use practices, and a dense stream network contribute to recurring floods in the area (Cinco et al., 2016).
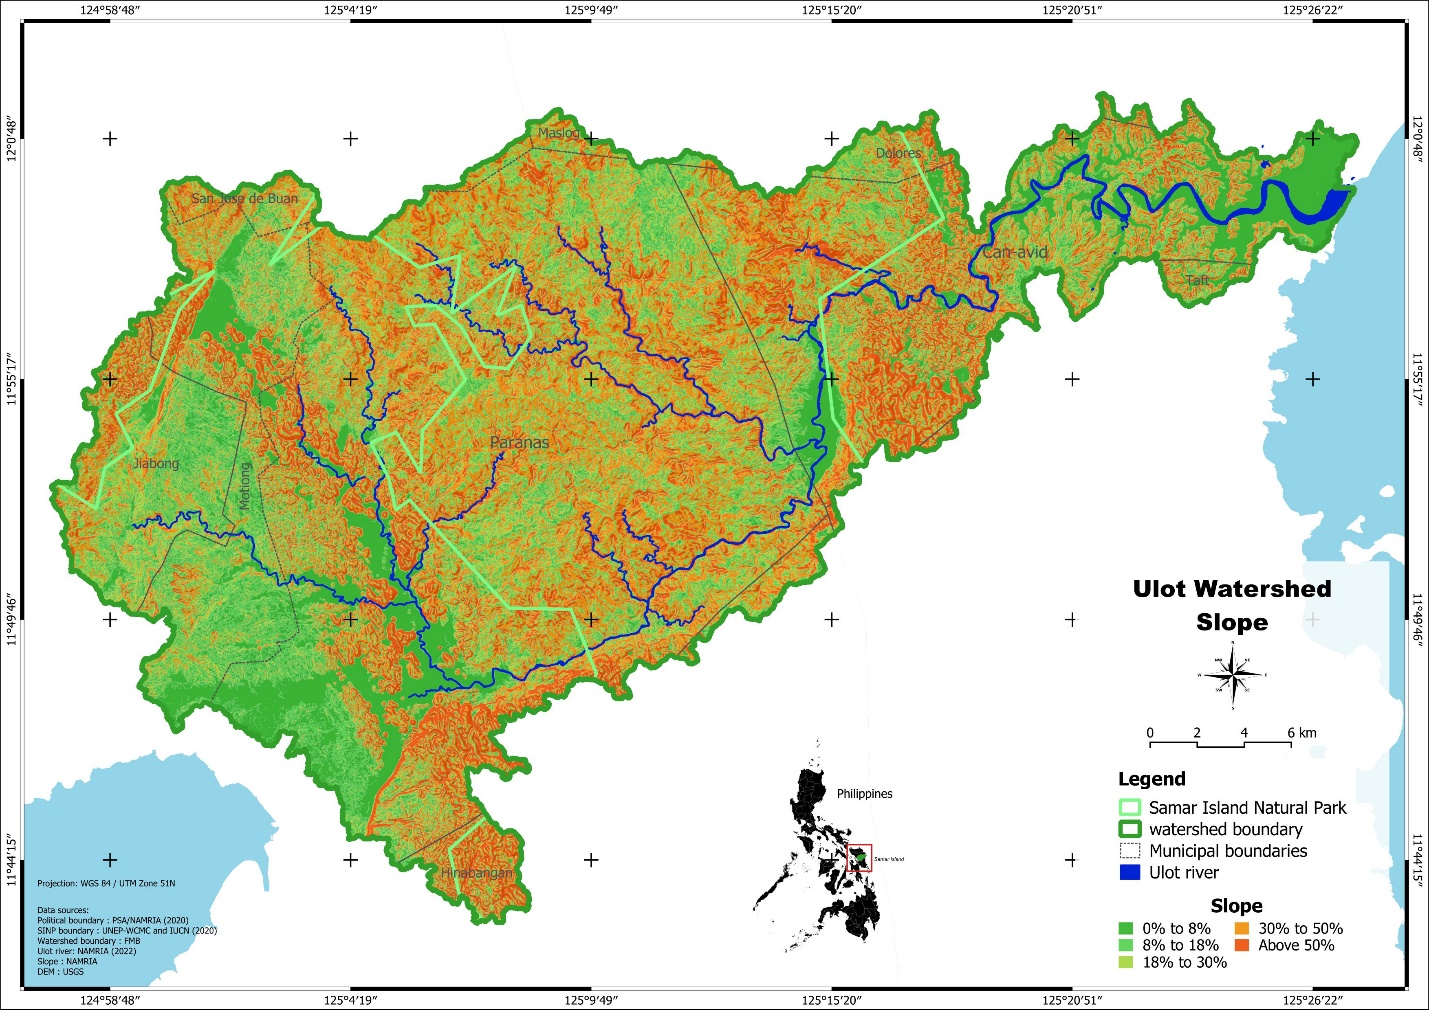
Slope and Elevation
The slope and elevation of the Ulot Watershed are key factors influencing hydrological processes such as runoff, infiltration, and erosion. The Ulot Watershed is characterized by steep and challenging terrain (Figure 10). There are five recognized slope categories according to gradients: Class I (0–8%): level to gently sloping; Class II (8–18%): gently sloping to undulating, Class III (18–30%): undulating to moderately steep, Class IV (31–50%): moderately steep to steep, Class V (> 50%): very steep. About 28.3% of Ulot watershed has a slope that ranges from 30%-50%, classified as Hilly to Mountainous. Approximately 23.7% of the area has slopes between 18% and 30%, characterized as Rolling to Hilly terrain (Appendix 2). The rest of the watershed is classified as follows: 17.3% of the total area is Undulating to Rolling (8-18% slope), 15.3% is Level to Undulating (0-8% slope) and 15.0% is Mountainous (>50% slope).
Hilly to mountainous slopes are prone to erosion and landslides during heavy rains because they allow high runoff and a higher possibility of degrading the soil (Dela Cruz and Agpaoa, 2017). Proper management of the slopes, such as reforestation or afforestation, and terracing, is needed to avoid these situations (Lal, 2001). Rolling to hilly slopes are usually tapped for agriculture, although these areas suffer from erosion problems. Some conservation techniques like contour farming and terracing can keep the land fertile, with lesser runoff (Brady and Weil, 2008). Rolling topography also creates microclimates that bring about biodiversity (Ong et al., 2004). Undulating to rolling slopes are transitional and therefore have both the potential for agriculture and natural vegetation. However, such lands need to be taken care of with greatest caution so that they do not fall prey to practices of deforestation and overgrazing, which may result in runoff and poor soil fertility (Reynolds et al., 2007). Balanced agriculture and ecological sustainability can be amalgamated only through different land use approaches (Pimentel and Burgess, 2013).
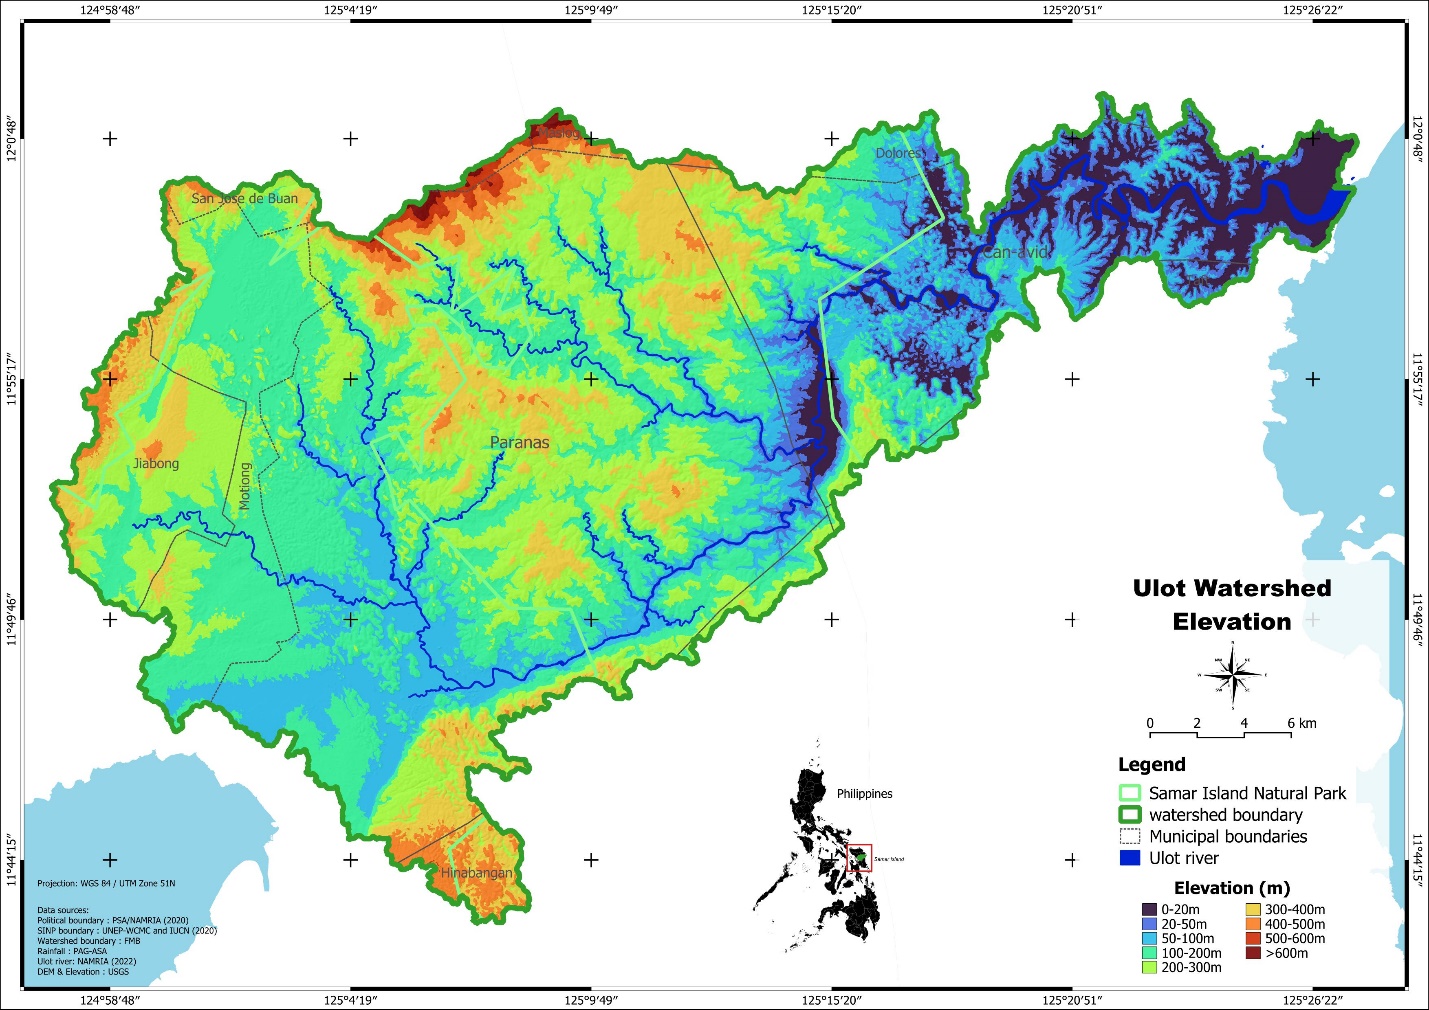
Elevation is a central element in the hydrology of a watershed because it will impact temperature, rainfall, and other climatic factors that influence runoff, infiltration, and evaporation, among other hydrologic processes (Dingman, 2015). The average elevation in Ulot Watershed is about 399.02 meters, while the maximum elevation is about 798.04 meters above sea level (Figure 11). Elevation affects local climate, water availability, and ecological conditions.
As air rises over higher terrain, it cools and precipitates resulting to increased rainfall over elevated areas of the Ulot Watershed (Oke, 1987). This creates microclimates that sustain diverse ecosystems. Steeper slopes at higher altitudes accelerate runoff, increasing potential erosion risks if left unmanaged (Baguinon et al., 2007). The average elevation of the mid-sloping watershed areas is supported by land uses such as forestry and agriculture. The vegetation in these areas play an important role in regulating water flow by gradually releasing stored water, helping to prevent both flooding and droughts in these areas (Postel and Thompson, 2005).
Some of the Natural landscapes of Ulot river in Samar Island Natural Park
Ulot River is one of the major features of Samar Island Natural Park (SINP), which is valued for its rich biodiversity and spectacular landscapes that enhance the ecological integrity and cultural heritage of Samar Island. From San Jose de Buan down to Can-avid, the river traverses a range of natural environments that support a wide variety of ecosystems and species. The riverine ecosystems of its tributaries and waterfalls are vital habitats for aquatic life and sustain the livelihoods of local residents through fishing and eco-tourism. The surrounding tropical rainforests, with their lush canopies and incredible biodiversity, harbor the endangered species- the Philippine Eagle (Pithecophaga jefferyi) (BirdLife International, 2013) and the Samar Tarictic Hornbill (Penelopides samarensis) (DENR, 2019). These forests serve the watershed by providing carbon sequestration and hydrological regulation. The mountainous ridges that border the Ulot River are an important biodiversity site because they harbor species adapted to high-altitude habitats, thus providing water-retention capacity and preventing sedimentation in the river (Baguinon et al., 2007).
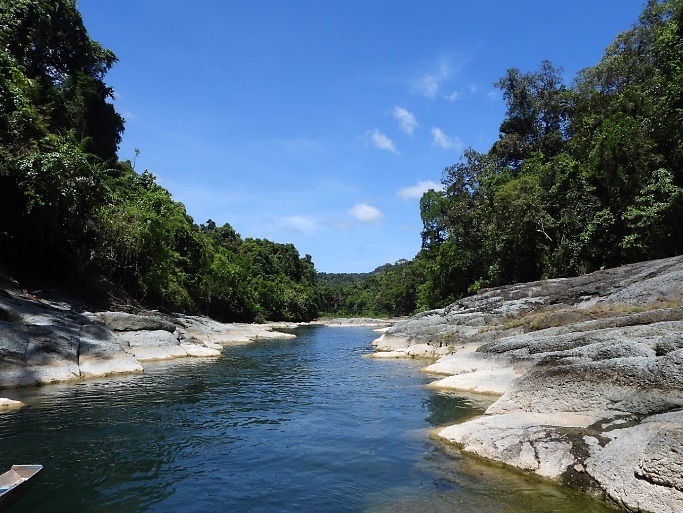
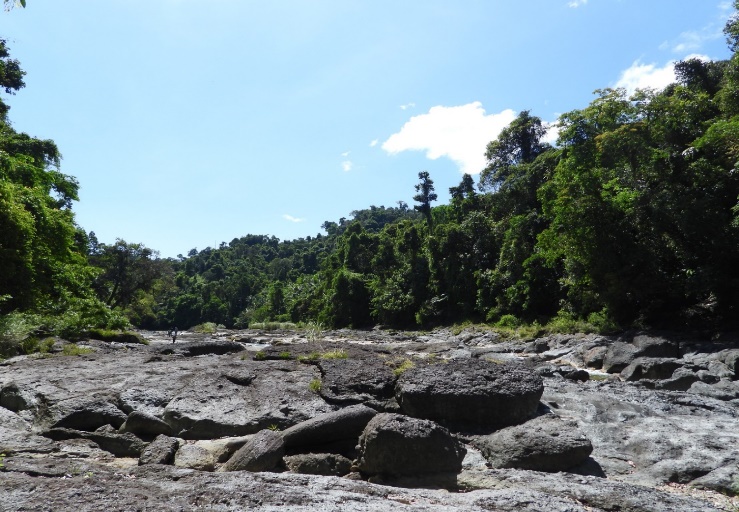
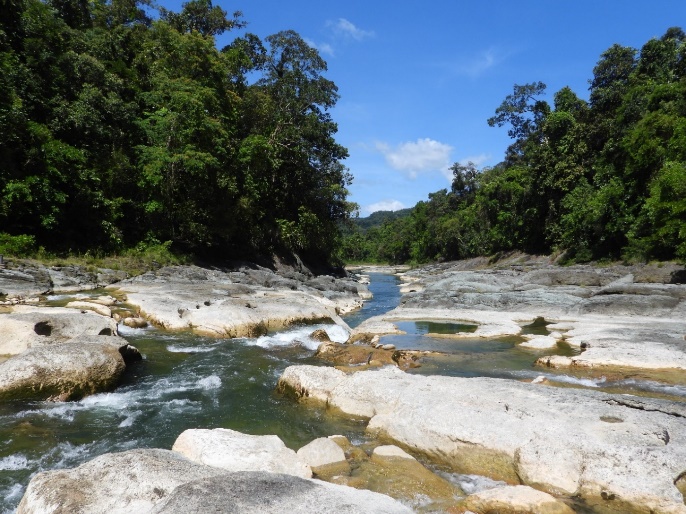
In midstream, the Ulot River traverses scenic small river canyons and crosses over unique rock formations (Figure 12), attracting eco-tourists who engage in activities such as torpedo boat rides and river trekking (Bordeos et al., 2020). The riparian zones with lush vegetation on the sides of the river help in preventing erosion and maintaining a stable soil structure and filter the large proportion of pollutants entering the water body, hence ensuring good quality of water. They also serve as wild-water habitats that connect between the wet and dry areas, hence acting as significant wildlife corridors, hosting species both terrestrial and semi-aquatic in nature (Lasco and Pulhin, 2006).
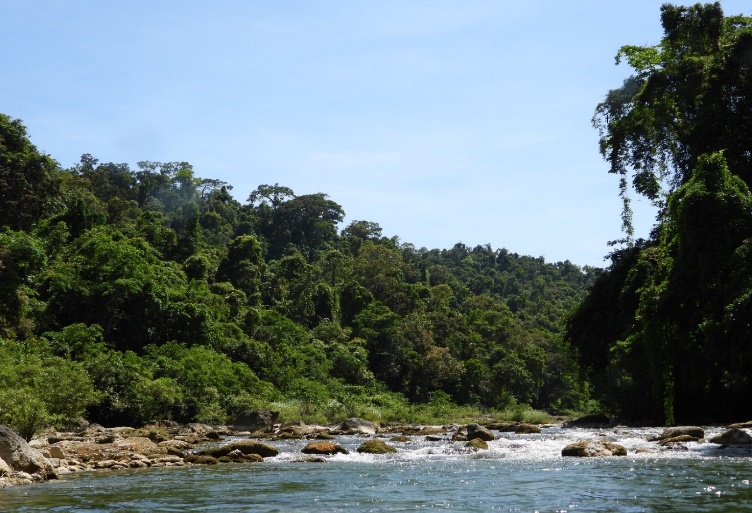
The landscape around Ulot River is a hotspot within SINP, encompassing riverine ecosystems, mountainous terrain, tropical rainforests, as well as several minute waterfalls and cascades along the river, which not only add to its beauty but also contribute to the oxygenation of water, sustaining aerobic aquatic life (Figure 13). Thus, preserving these landscapes is important not only to the ecological health of the Ulot Watershed but also for the resilience of the local communities who principally rely on agriculture, fishing, and eco-tourism (DENR, 2019).
The Ulot River has been an active site for ecotourism, with activities like torpedo boat adventures that give a scenic view of the river environment. These can, on occasion, bring in revenue to local communities apart from popularizing environmental concerns (Bordeos et al., 2020). Natural landscapes should be preserved for the eventual conservation of the cultural identity and heritage of the local residents.
Hence, the natural landscapes offered by Ulot River are considered critical to the park’s ecological integrity. The variability of the tropical rainforests and mountainous terrain in the place harbors species and crucial ecosystem services that would eventually require future management and conservation efforts to preserve biodiversity, promote livelihoods, and promote eco-tourism in a culturally caring manner.
Some of the anthropogenic activities and issues inside the Ulot watershed
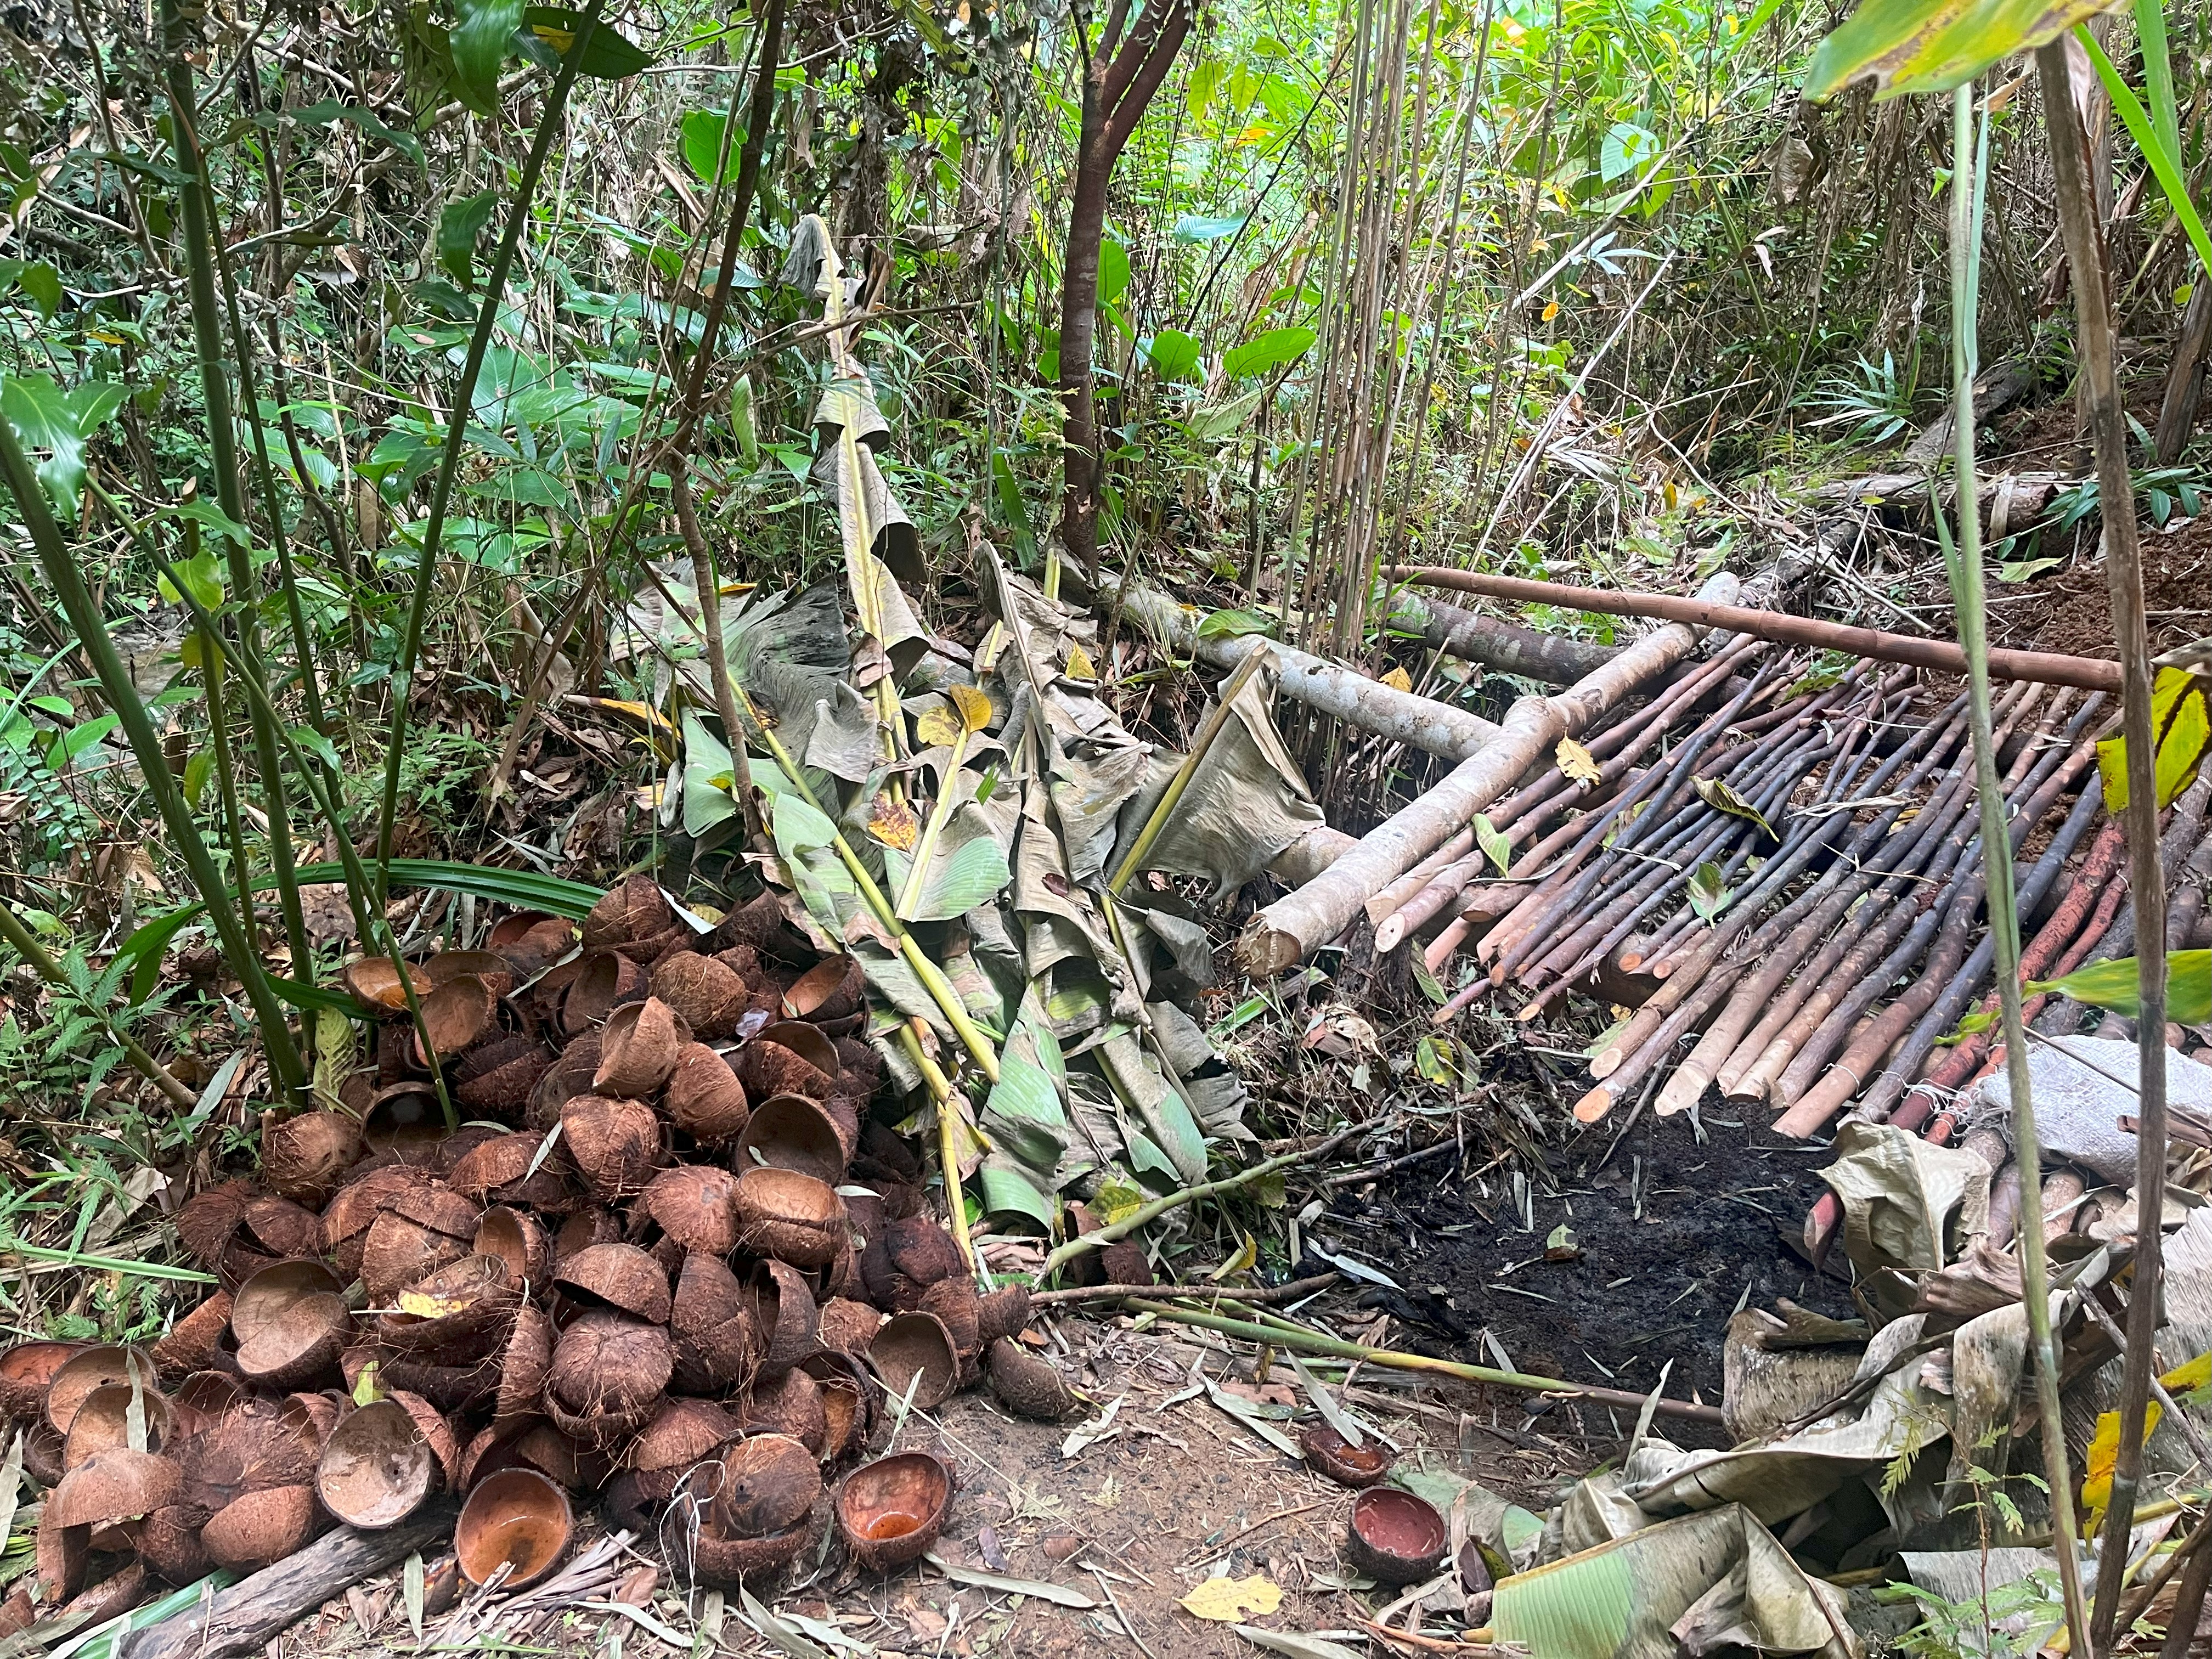
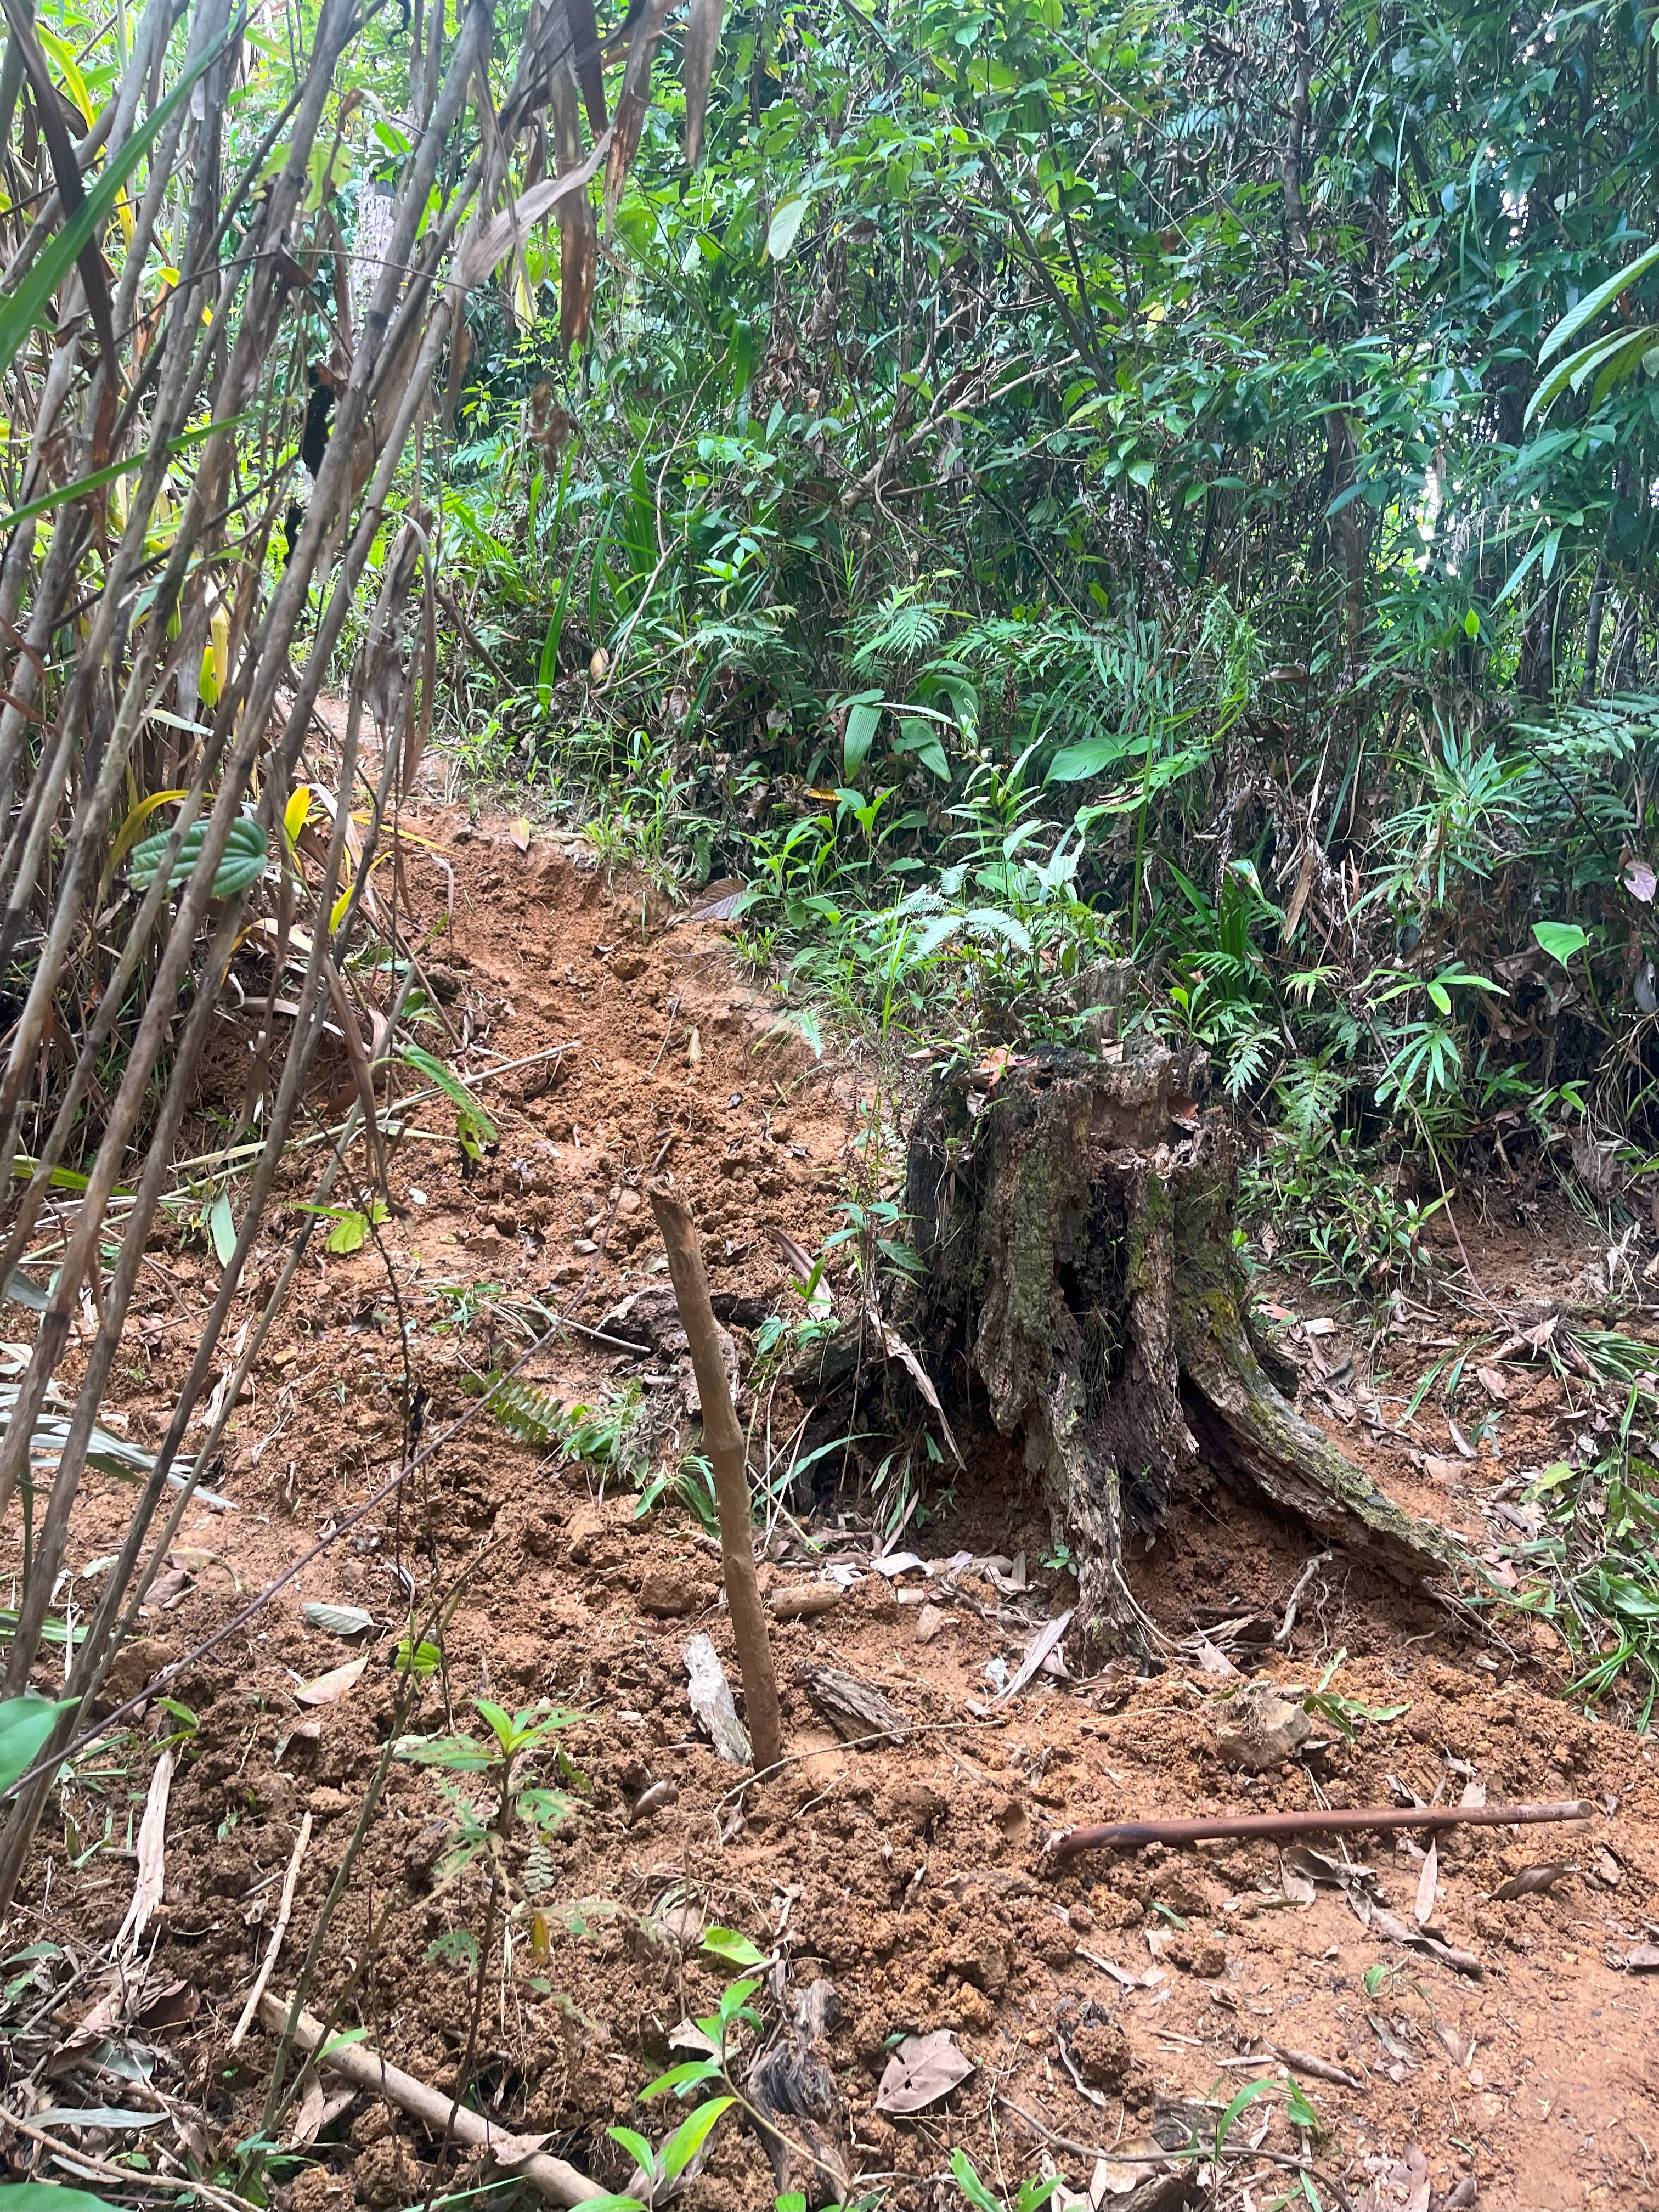
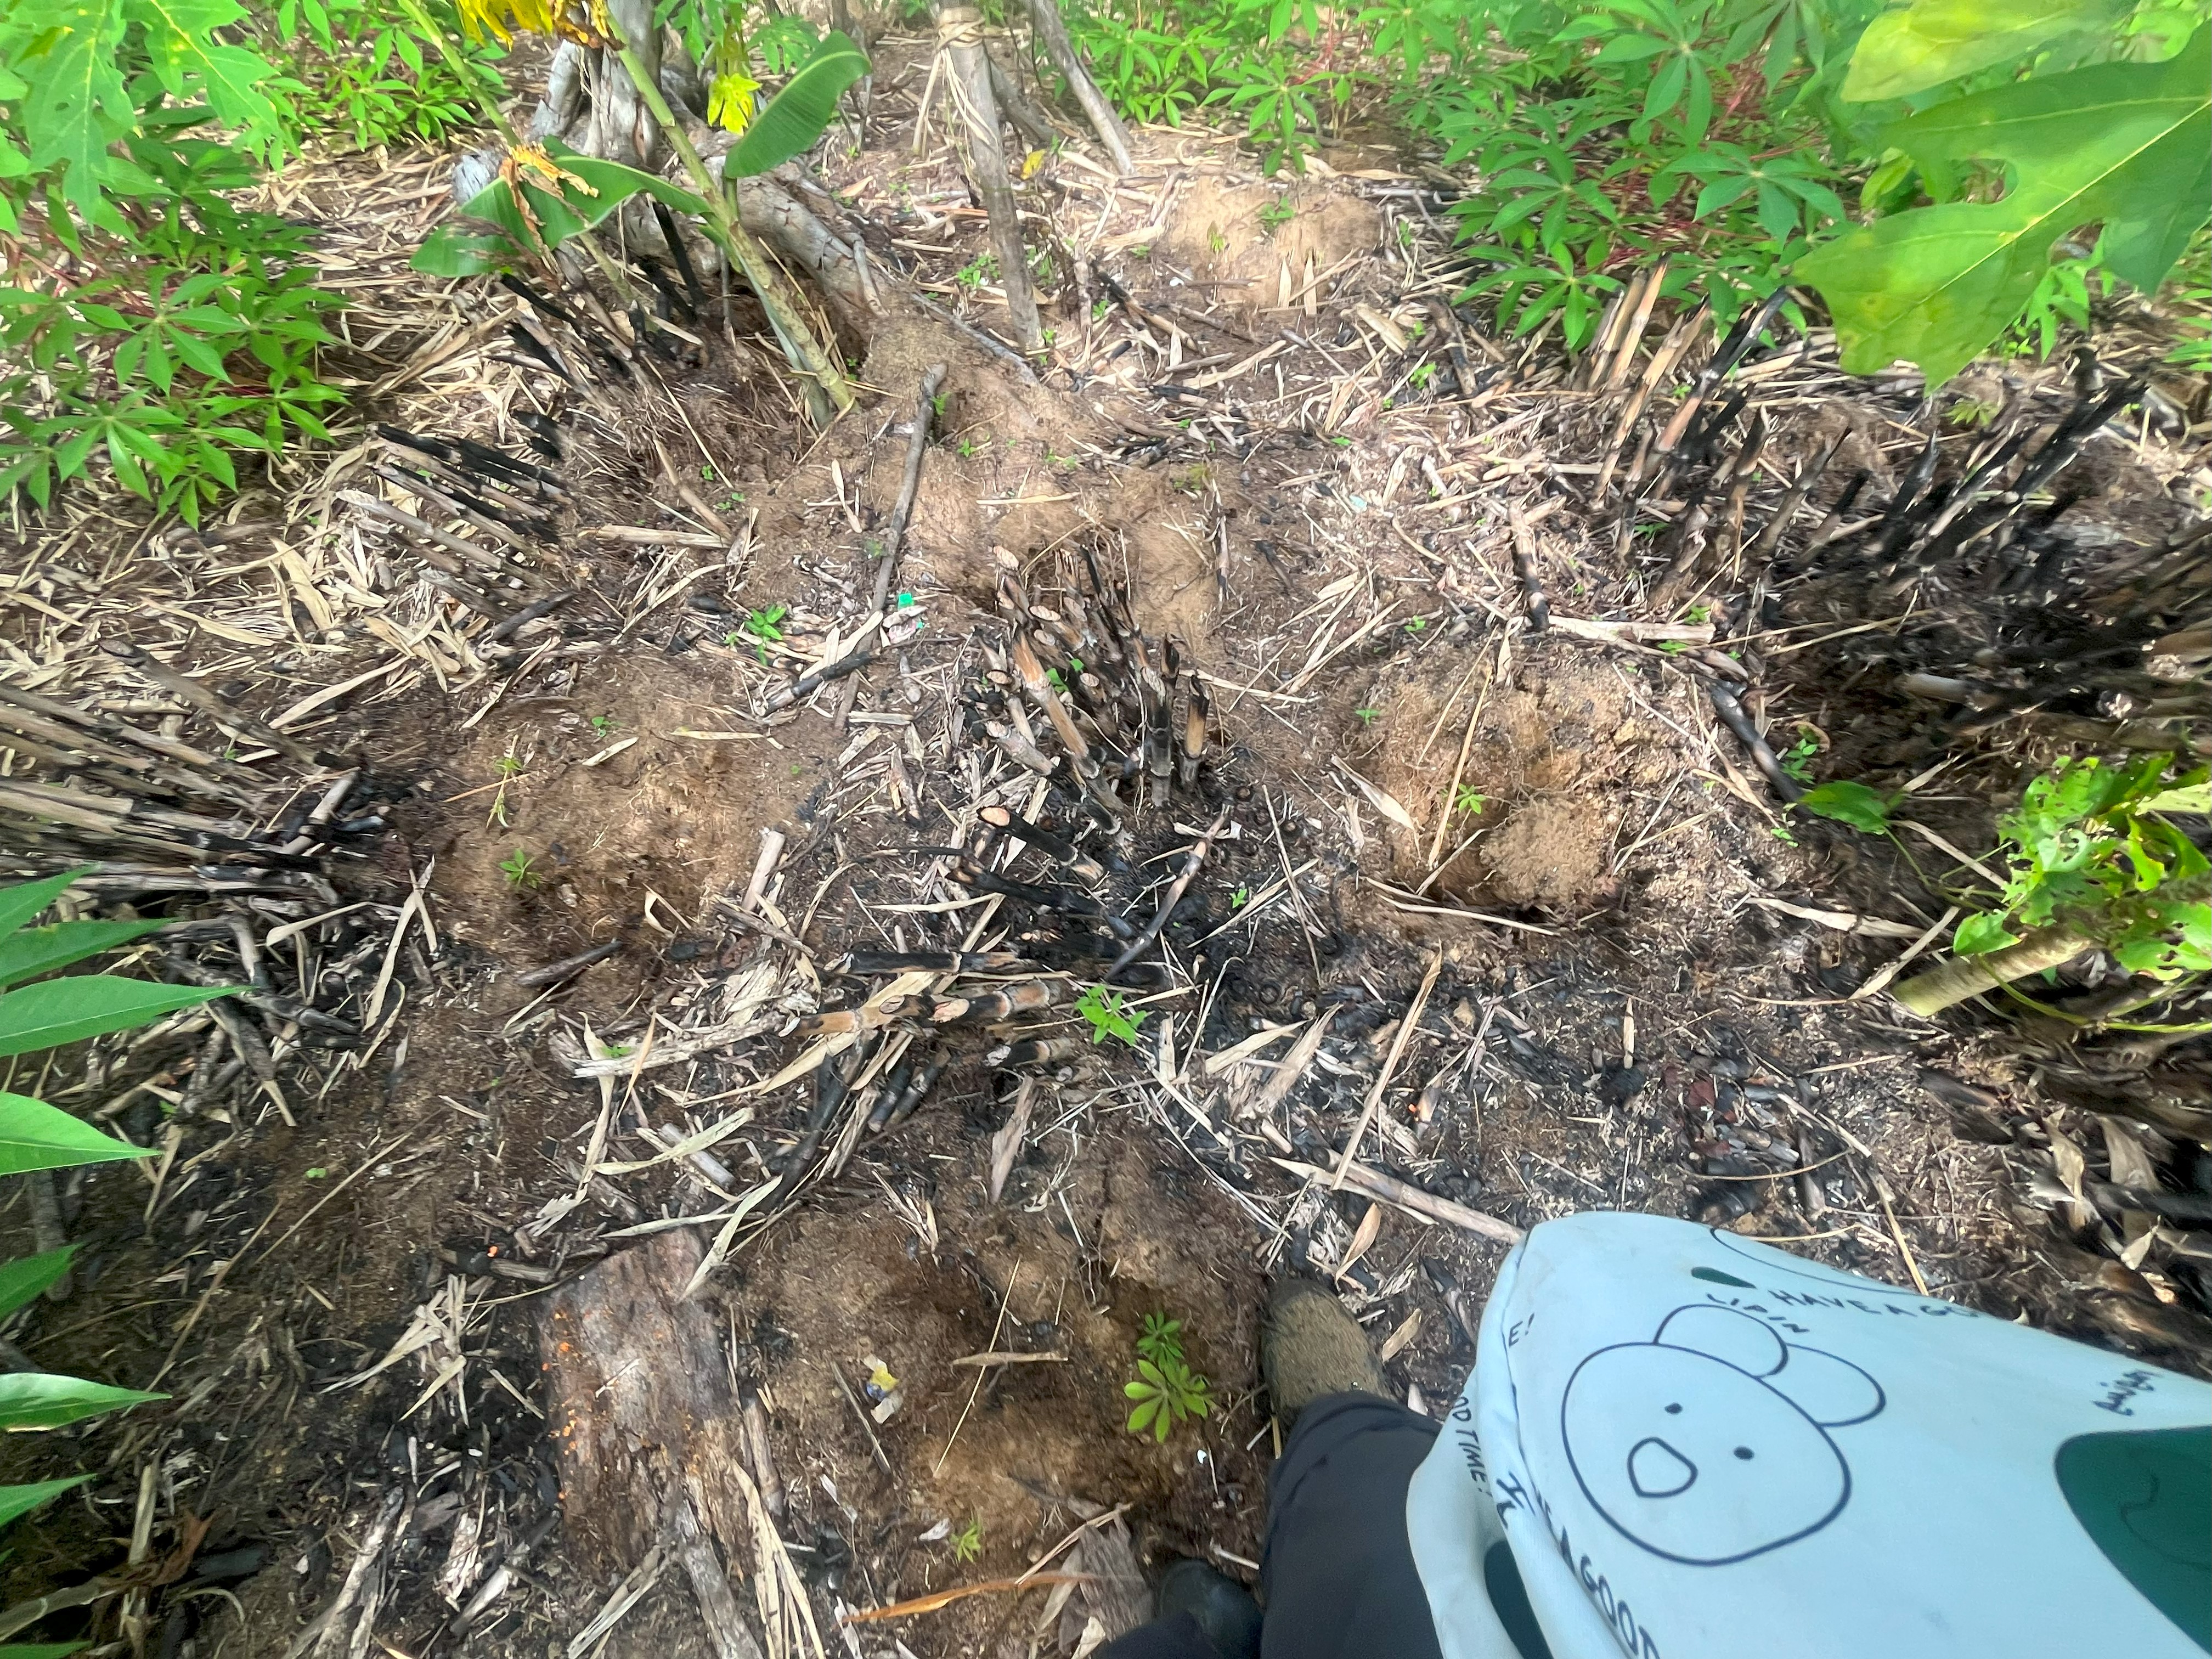
Various anthropogenic activities pose a threat to the ecosystem of the Ulot Watershed. Kaingin, or small-scale slash-and-burn farming (Figure 14), is one of the chief livelihoods in agricultural production that benefits a considerable proportion of the local population of about 12,600 individuals or about 3,000 households. However, these practices are not sustainable and could lead to deforestation, soil erosion, and nutrient depletion, eventually degrading forest ecosystems and biodiversity (Lasco and Pulhin, 2006; Mukul et al., 2020). Furthermore, intensive agriculture interferes with hydrological processes, deteriorating both the amount and quality of downstream water.
Illegal logging remains a problem in the Ulot Watershed, even inside the protected area. Logging for valuable hardwood species degrades the ecological balance, damages critical habitats for wildlife, and leads to further denudation and soil erosion, adversely affecting the water quality of the Ulot River (DENR, 2019). Small-scale mining for minerals such as bauxite takes place within the watershed, particularly in Paranas and Motiong (MGB, 2021), consequently leading to land degradation, deforestation, and water pollution due to improper disposal of mining by-products that pose a threat to aquatic ecosystems and community health (Lasco and Pulhin, 2006). Charcoal making has also been a traditional income source and often involves cutting down trees for fuel. If not managed sustainably, it may result in biodiversity loss and forest degradation, potentially reducing carbon sequestration capacity, and increasing susceptibility to flooding and land erosion (Lasco et al., 2009).
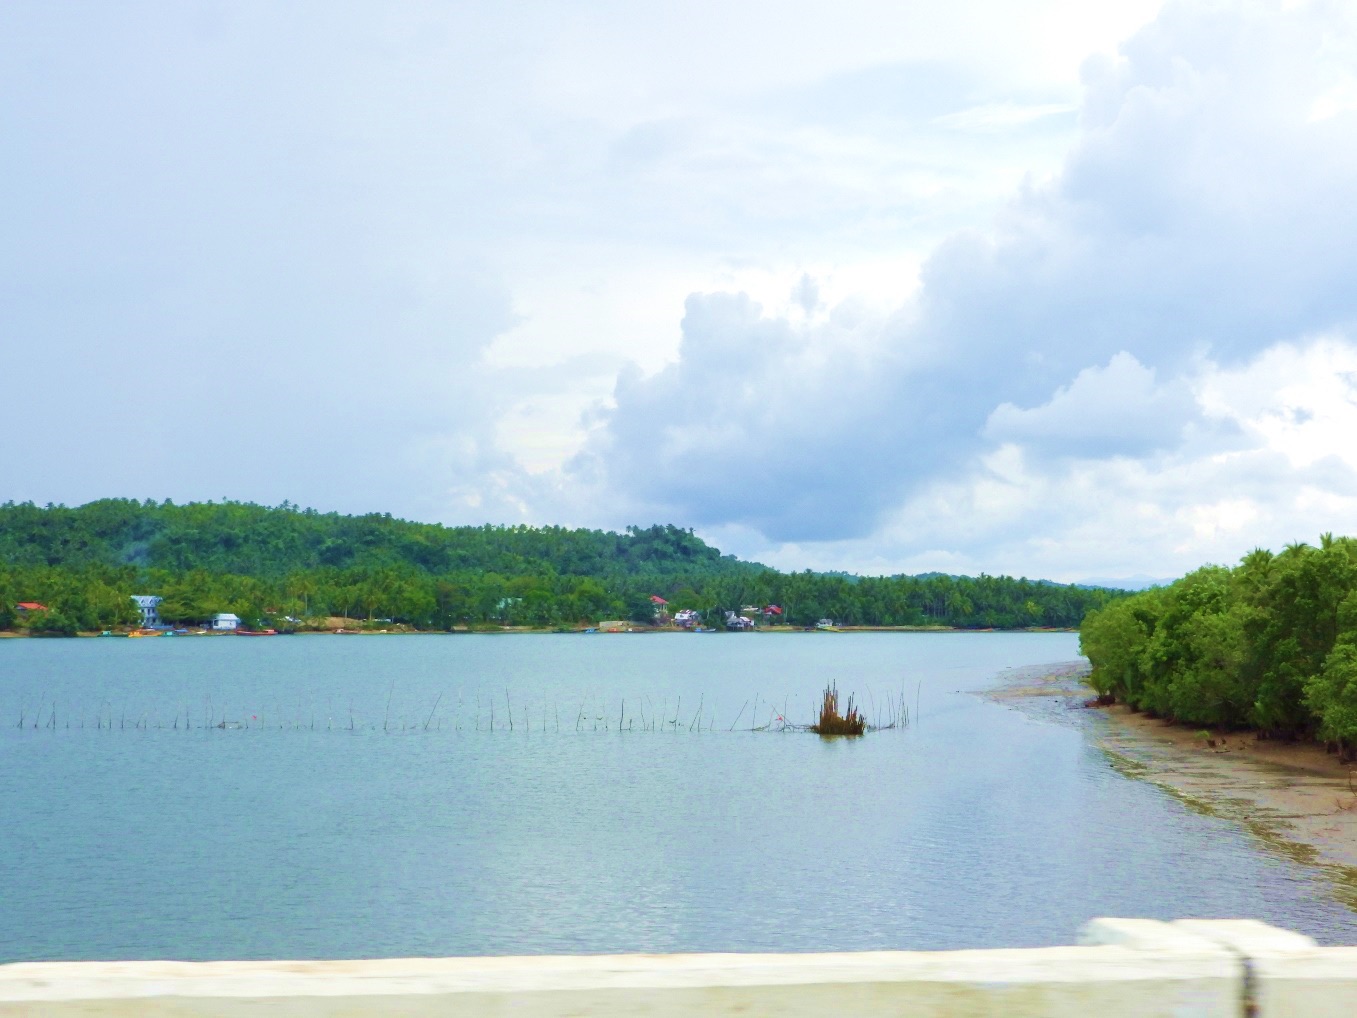
The local communities in the Ulot River rely on fishing, but it is sustainable only at the small-scale level (Figure 15). Poorly managed aquaculture systems and overfishing can degrade habitats in rivers like Ulot River or thousands of other fisheries, leading to nutrient loading, which affects water quality and the fish populations (Bordeos et al., 2020).
Proposed Conservation Action Plan
A consolidated assessment was conducted, referring to the biophysical and anthropogenic issues affecting the Ulot Watershed, and the corresponding policy-aligned management strategies were identified. Table 4 synthesizes key issues and concerns in the Ulot Watershed and links them with evidence-based management interventions and relevant policies. Steep slopes and erosion-prone terrains dominate large portions of the watershed, necessitating strict soil and slope management measures such as reforestation, terracing, and agroforestry. These interventions are consistent with the Revised Forestry Code (PD 705) and DENR guidelines, underscoring the need to protect upland areas from inappropriate and unsustainable land use.
Soil-related concerns, particularly in poor drainage areas, highlight the importance of aligning agricultural practices with soil and land suitability. Drainage improvement and conservation farming techniques support sustainable productivity while minimizing erosion, in line with the Agriculture and Fisheries Modernization Act (RA 8435). Similarly, forestlands with low vegetation cover require ecological restoration and rehabilitation through reforestation and assisted natural regeneration to enhance biodiversity, stabilize slopes, and improve watershed functions, as mandated by the Expanded National Integrated Protected Areas System or ENIPAS Act (RA 11038) and Community-Based Forest Management (EO 263) policies.
Flood-prone lowland areas along river channels reflect the cumulative impacts of upstream land-use practices. The establishment of riparian buffer zones and regulation of activities within floodplains contribute to climate change adaptation and disaster risk reduction goals under the Climate Change Act (RA 9729). The observed destructive and unsustainable anthropogenic activities, such as slash-and-burn agriculture and monocropping, further emphasize the role of human-induced pressures in watershed degradation. Addressing these requires stricter land-use regulation, site-specific suitability assessments, and the promotion of diversified farming systems.
| Issue Identified | Evidence from Results | Proposed Action | Policy/Framework Alignment | Responsible Stakeholders |
|---|---|---|---|---|
| Steep slopes prone to erosion | 28.3% of watershed has 30–50% slopes; 15% has >50% slopes (hilly to mountainous terrain) | Implement reforestation, terracing, and agroforestry (contour farming in erosion-prone areas) | DAO 2021-41 (soil and slope management)1; PD 705 (Revised Forestry Code)2 | DENR, LGUs, local communities |
| Poor soil drainage | 26.2% of the watershed is Faraon clay and dominates in hilly terrains. | Drainage management, agroforestry (crop rotation, cover cropping, contour farming in hilly areas) | DAO 2021-41 (soil and slope management)1; RA 8435 (AFMA)3 | DENR, DA, LGUs, PO’s: farmer’s associations |
| Low vegetation areas | 18.38% and 3.74% of the watershed covered with shrubs, grasslands and disturbed areas, particularly in upland and transitional zones | Implement reforestation, assisted natural regeneration, and slope stabilization; establishment of buffer zones | RA 11038 (ENIPAS Act)4; EO 263 (CBFM)5 | PAMB-SINP, DENR, LGUs, local communities |
| Flood-prone areas | Low-lying areas adjacent to river channels and downstream sections of the watershed | Establish riparian buffers, regulate land use in floodplains, improve watershed vegetation cover, and enhance natural drainage systems | RA 9729 (Climate Change Act)6; DMC No. 2008-05 (Integrated Watershed Management Framework)7 | DENR, LGUs, NDRRMC, local communities |
| Unsustainable anthropogenic activities | Presence of slash and burn, small scale monoculture farms | Restrict intensive land use and require site-specific land suitability assessments. | EO 318 (SFM)8; RA 8435 (AFMA)3 | DENR, DA, LGUs, PO’s: farmer’s associations |
These highlight the need for integrated watershed governance involving DENR, Department of Agriculture (DA), local government units (LGUs), and local communities. By grounding management actions in biophysical evidence and aligning them with national and local policy frameworks, the proposed measures support the long-term ecological integrity and sustainable development of the Ulot Watershed.
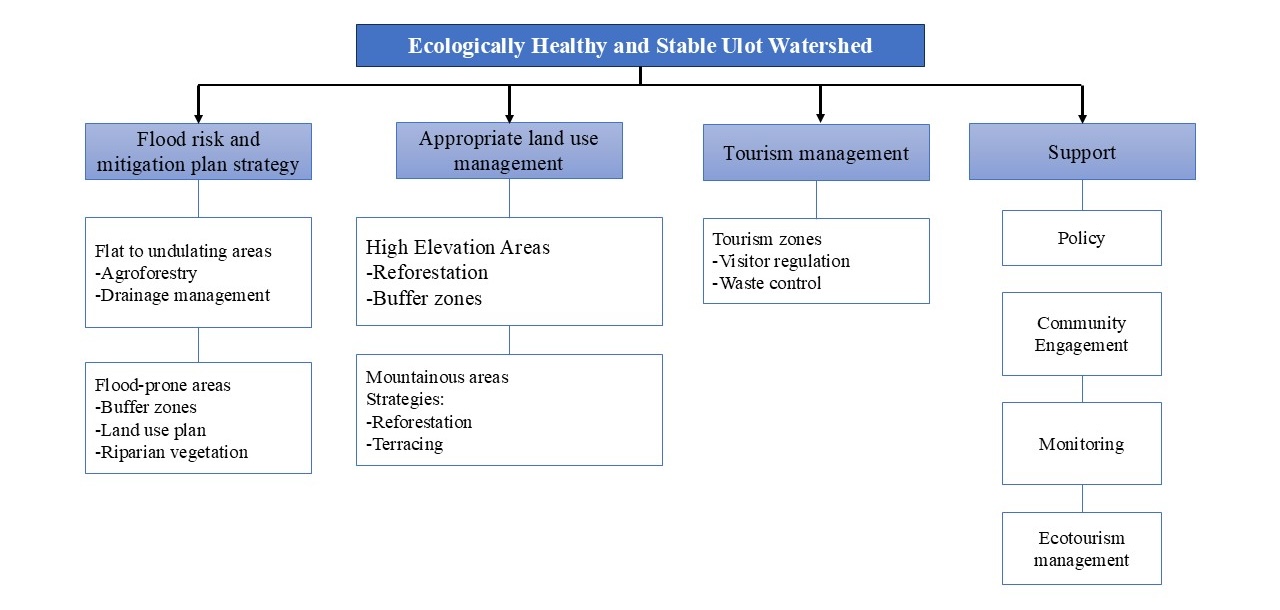
Land use management in the Ulot Watershed must balance economic development and ecological conservation, given its diverse topography. Flat areas are suitable for farming but are prone to flooding, which requires proper drainage and soil management. In contrast, mountainous areas play a critical role in habitat preservation and carbon sequestration, making them ideal for conservation efforts. Areas with both flat and steep slopes highlight the need for agroforestry and reforestation strategies, especially since most of these areas are located within SINP. This proposed conservation action plan outlines site-specific strategies for sustainable land use across different slope categories, emphasizing conservation, agricultural practices, and proper zoning to safeguard the watershed’s long-term ecological health and stability (Figure 16).
Flood risk and mitigation strategy for Can-avid
Dry and wet periods impact agricultural practices and flood control due to the significant seasonal variations in this area, which have been known to affect resource management (Lasco et al., 2010). Consistent or uniform rainfall ensures that high levels of forest cover and biodiversity are preserved, whereas low rainfall levels have been shown to stress vegetation and raise vulnerability to drought (Baguinon et al., 2007). Effective water resource management strategies, especially for areas involving rainwater harvesting and efficient irrigation, form an important basis for a sustainable water supply in agriculture and household uses (Poff et al., 1997). Such agricultural planning needs monthly rainfall data to guide farmers on the appropriate selection of crops, the appropriate time for planting, and irrigation practices. While consistent rainfall during critical growth periods can improve crop yields, great fluctuations would necessitate either drought-resistant crops or rain-fed farming (Lasco et al., 2010). This means that the range of monthly mean rainfall in the Ulot Watershed, from 275.93 mm to 358.84 mm, underscores the need to understand local climate patterns as a means of informing effective resource management. This rainfall pattern implies a huge amount of rainfall received by Can-avid which further increases its risk for flooding. Thus, insights drawn from this are critical to guiding policymakers and land managers toward strategies enhancing agricultural productivity, conserving biodiversity, and sustaining the use of water resources.
Appropriate land use management according to slope and elevation
The flattest areas of the watershed are suitable for farming and development. However, these areas are highly prone to flooding and waterlogging, especially if not properly managed. For instance, it requires proper management of drainage and soil moisture so that adverse effects on agriculture and settlements are avoided (Zhao et al., 2019). Mountainous areas are primarily forested, playing a crucial role in habitat provision, carbon sequestration, and climate change regulation. These areas should be prioritized for conservation and reforestation due to landslide and erosion susceptibility (Nepstad et al., 2008; Marsh and Grossa, 2015). The Ulot Watershed's varied slopes highlight the need for site-specific land management strategies. Steep areas demand conservation to prevent erosion, while gentle slopes can support sustainable agriculture. Barangay Tula in Paranas, Samar, stands out with the largest area in both flat and steep slope categories, making it suitable for diverse land uses (Appendix 3 and 4). Agroforestry is recommended for flatter areas, and conservation methods like terracing and reforestation for steep slopes. Since much of Barangay Tula lies within the SINP, activities like forest clearing are restricted. Proper zoning and planning are essential across all top barangays to balance land use and ecological preservation.
Conserving forest cover in high-elevation barangays—such as Hiduroma, Carayacay, Santo Niño, and Lim-ao—is critical for water retention, erosion prevention, and biodiversity support (Appendix 5). These upland areas, ranging from 400 to 1000 meters above sea level, include brushlands, grasslands, and some residential zones. Reforestation and vegetative buffers are strongly recommended to enhance carbon sequestration, reduce risks from extreme weather, and support ecosystem services like soil stability and habitat protection. Sustainable management strategies that consider elevation dynamics are key to preserving the watershed and ensuring community resilience.
Appendix 6 presents the ten barangays within Ulot Watershed with the highest area categorized as highly susceptible to flooding. These areas are recommended to be included in land use planning, wherein riparian buffers with appropriate widths and vegetation will be established to enhance biodiversity, control sediment, and restore natural hydrological processes (Croke et al., 2022).
Regulating tourism to mitigate its negative impact on Ulot River
Ecotourism, including Ulot River Torpedo Boat Ride among many others, has opened up alternative livelihood and increased environmental awareness. However, unregulated tourism led to littering, wildlife disturbances, and overexploitation of resources. Hence, there is a need to balance tourism and conservation practices for sustainability (Bordeos et al., 2020). Roads and bridges infrastructure projects provide easy transportation and also stimulate local economic development but frequently cause habitat fragmentation and destroy forests with changes in the drainage pattern leading to higher risks of landslide and soil erosion in steep areas (Baguinon et al., 2007; Buhay et al., 2023). Also, further expansion of human settlements in the Ulot Watershed transformed what otherwise would have been considered forestland into residential areas, increasing the demand for resources and clearing forests, considerably impacting ecological balance and biodiversity (DENR, 2019).
Overall, the cumulative impact of unregulated tourism includes forest degradation and deforestation that decrease the capacity of the watershed to control the water flow and make the area vulnerable to flooding. It also diminishes the carbon sink ability of the watershed. Soil erosion and sedimentation cause siltation of rivers and streams, affecting water quality and reducing reservoir storage capabilities leading to floods and water scarcity during dry seasons (Baguinon et al., 2007). Direct human activities are the main causes of biodiversity threats to endemic species reliant on the integral state of forest ecosystems. Hunting pressure, encroachment, and deforestation endanger many species, thus implying that some are critically endangered (DENR, 2019). Anthropogenic activities in the Ulot Watershed provide economic benefits but pose huge hurdles in sustainable management and ecological integrity. Proper regulation and sustainable practice will be necessary to protect this very significant ecosystem.
Conclusion
The Ulot Watershed exhibits significant variations in political boundaries, physical characteristics, and natural landscapes, which are significantly crucial to the overall functionality of the watershed. Paranas encompasses the most substantial portion of the watershed, while other municipalities such as Can-avid and San Jorge have manifold management challenges at hand. The watershed has a complex topography with steep slopes and high elevations in some areas, meriting the need for soil conservation and proper land-use planning to control erosion and avoid soil degradation and landslides. The stream network of the Ulot Watershed has a total length of 2,611 km, forming a well-developed hydrological system that aids in flood control and regulates water supply. Although the predominance of first-order streams increases vulnerability to localized floods and erosion, this underlines the significance of watershed management. Moreover, the diversity of land covers, including open forest, underscores the need for forest conservation to sustain ecosystem services.
Thus, slash-and-burn farming, among other anthropogenic activities, still exerts pressure on the watershed, which eventually culminates in deforestation, soil erosion, and loss of biodiversity. At the same time, because of the terrain, unsustainable land practice tends to exacerbate environmental degradation in this area. Therefore, it is urgent that human activities be regulated, reforestation encouraged, and sustainable land use practices adopted to both protect the ecological integrity of the watershed and to ensure that the livelihoods of community living are preserved.
Acknowledgements
The authors would like to express their gratitude for the invaluable support and contributions of several people and institutions to be able to successfully pull this paper and project into fruition. We extend our most sincere appreciation to the Department of Science and Technology (DOST) - Philippine Council for Agriculture, Aquatic and Natural Resources Research and Development (PCAARRD) for the funding given as well as for their monitoring of this research effort. Appreciation is extended to the DOST-Science Education Institute (SEI) for the opportunity given to the lead author to participate in the project.
To the CONserve-KAIGANGAN project and the Plant Systematics Laboratory, Institute of Biological Sciences, College of Arts and Sciences, University of the Philippines Los Baños (UPLB) for having an ideal working area where much of the work was conducted.
The authors also recognize the support of our collaborating institutions, Samar State University (SSU) and Eastern Samar State University (ESSU), for their participative approach to assisting us in the realization of the objectives of the project.
At the same time, the authors want to acknowledge the vital assistance of the people's organizations particularly the Basaranan nga Organisasyon han San Isidro Samar (BOSIS) and the Tourguide and Boat Operators for River Protection and Environmental Development Organization (TORPEDO), with their dedicated assistance in the data gathering in the Ulot watershed within SINP.
Finally, the authors wish to extend their gratitude to all the people and organizations involved in this research that made it possible. It is only through your collective efforts that this study was able to meet the research objectives set before us.
References
- Admas, M., Melesse, A., & Tegegne, G. 2024. Predicting the Impacts of Land Use/Cover and Climate Changes on Water and Sediment Flows in the Megech Watershed, Upper Blue Nile Basin. Remote. Sens., 16, 2385. https://doi.org/10.3390/rs16132385.
- Allan, J. D., and Castillo, M. M. 2007. Stream Ecology: Structure and Function of Running Waters. Springer Science and Business Media.
- Aldrich, R., Brown, G., and Smith, T. 2015. Climate change impacts on biodiversity in the Philippines. Environmental Science and Policy, 54, 89-99.
- Aldrich, J. R., Chen, H., and O'Connor, J. 2015. Vegetation Dynamics and Climate Change in the Philippines: A Review of Recent Trends and Future Challenges. Philippine Journal of Science, 144(4), 319-337.
- Aldridge, C. L., and Baker, A. L. 2017. Watershed and drainage basin dynamics. In Encyclopedia of Earth Sciences Series (pp. 1-4). Springer.
- Baguinon, N. T., Lasco, R. D., and Cruz, N. 2007. Climate and agriculture in the Philippines: Issues and challenges. Philippine Journal of Science, 136(2), 153-161.
- Baliton, R. S., Wulandari, C., Landicho, L. D., Budiono, P., Herwanti, S., Rusita, R., ... and Castillo, A. K. 2017. Ecological services of agroforestry landscapes in selected watershed areas in the Philippines and Indonesia. Biotropia, 24(1), 71-84.
- Bankoff, G. 2003. Cultures of disaster: Society and natural hazard in the Philippines. Routledge.
- BirdLife International. 2013. Pithecophaga jefferyi. The IUCN Red List of Threatened Species. Version 2014.2.
- Bordeos, M. S., Castro, G. C., and Barrera, L. S. 2020. Environmental and Socio-Cultural Dynamics of the Samar Island Natural Park: A Case Study of Eco-Tourism Development along the Ulot River. Journal of Environmental Science and Management, 23(2), 23-34.
- Brady, N.C. and Weil, R.R. 2008. The Nature and Properties of Soils. Pearson.
- Buakhao, W., & Kangrang, A. 2016. DEM Resolution Impact on the Estimation of the Physical Characteristics of Watersheds by Using SWAT. Advances in Civil Engineering, 2016, 1-9. https://doi.org/10.1155/2016/8180158.
- Buhay, A. F. V., Cruz Jr, R. V. O., Tiburan, C. L., & Pulhin, J. M. 2023. Factors affecting land use, land cover change, and fragmentation in selected protected areas in the Philippines. SciEnggJ, 16, 37-48.
- Burrough, P. A., and McDonnell, R. A. 1998. Principles of Geographical Information Systems. Oxford University Press.
- Ciasico, C. R., Obina, M.T., and Ciasico, F.E.A. 2023. Physical Profile of the Major Rivers in Eastern Samar inside the Samar Island Natural Park (SINP). Open Journal of Ecology, 13, 747-758.
- Cinco, T. A., Hilario, F. D., de Guzman, R. G., & Ares, E. D. 2013, October. Climate trends and projections in the Philippines. In Proceedings of the 12th national convention on statistics (NCS), Mandaluyong City, Philippines (pp. 1-2).
- Choi, J., Engel, B., & Farnsworth, R. (2005). Web-based GIS and spatial decision support system for watershed management. Journal of Hydroinformatics, 7, 165-174. https://doi.org/10.2166/hydro.2005.0014.
- Chorley, R. J. 1969. Water, Earth, and Man: A Synthesis of Hydrology, Geomorphology, and Socio-Economic Geography. Methuen and Co Ltd.
- Colby, J. 2019. GIS for Watershed Characterization and Modeling, 1-20. https://doi.org/10.1002/9781119300762.wsts0095.
- Croke, J., Thompson, C., and Fryirs, K. 2017. Prioritising the placement of riparian vegetation to reduce flood risk and end-of-catchment sediment yields: Important considerations in hydrologically-variable regions.. Journal of environmental management, 190, 9-19 . https://doi.org/10.1016/j.jenvman.2016.12.046.
- Datta, S., Karmakar, S., Mezbahuddin, S., Hossain, M., Chaudhary, B., Hoque, M., Abdullah-Al-Mamun, M., & Baul, T. (2022). The limits of watershed delineation: implications of different DEMs, DEM resolutions, and area threshold values. Hydrology Research. https://doi.org/10.2166/nh.2022.126.
- Dela Cruz, R. and Agpaoa, R. 2017. Slope Distribution and Erosion Susceptibility in Watershed Regions: A Case Study. Journal of Environmental Management, 220, 157-168.
- Department of Environment and Natural Resources - Forest Management Bureau (DENR-FMB). 2018. Philippine Forestry Statistics. DENR-FMB.
- Department of Environment and Natural Resources (DENR). 2019. Samar Island Natural Park Protected Area Management Plan. DENR Region 8.
- DENR. 2019. Samar Island Natural Park. Department of Environment and Natural Resources, Philippines. Retrieved from DENR Official Website.
- DAO 2021-41. 2021. Guidelines for Watershed Management in the Philippines. Department of Environment and Natural Resources.
- Dingman, S. L. 2015. Physical Hydrology. Waveland Press.
- Dunne, T., and Leopold, L. B. 1978. Water in Environmental Planning. W. H. Freeman and Company.
- Ecosystems Research and Development Bureau [ERDB]. 2022. Table 2: Priority watersheds in the Philippines assessed for their vulnerability 2007-2021 [Data set]. ENR Compendium 2021. https://www.denr.gov.ph/index.php/e-library/enrcompendium-2021.
- Forest Management Bureau [FMB]. 2021. Philippine forestry statistics 2021. https://forestry.denr.gov.ph/index.php/statistics/philippines-forestry-statistics.
- Hernández-Romero, G., Álvarez‐Martínez, J., Pérez‐Silos, I., Silió-Calzada, A., Vieites, D., and Barquín, J. 2022. From Forest Dynamics to Wetland Siltation in Mountainous Landscapes: A RS-Based Framework for Enhancing Erosion Control. Remote. Sens., 14, 1864. https://doi.org/10.3390/rs14081864.
- Hoffman, M. T., and Ashwell, A. 2009. Nature and Management of Soils in South Africa. Oxford University Press.
- Horton, R.E. 1945. Erosional development of streams and their watersheds: Hydro-physical approach to quantitative morphology. Geological Society of America Bulletin, 56(3), 275–370. DOI: 10.1130/0016-7606(1945)56[275]2.0.CO;2
- Hua, F., Bruijnzeel, L., Meli, P., Martin, P., Zhang, J., Nakagawa, S., Miao, X., Wang, W., McEvoy, C., Peña-Arancibia, J., Brancalion, P., Smith, P., Edwards, D., and Balmford, A. 2022. The biodiversity and ecosystem service contributions and trade-offs of forest restoration approaches. Science, 376, 839–844. https://doi.org/10.1126/science.abl4649.
- IPCC. 2014. Climate Change 2014: Impacts, Adaptation, and Vulnerability. Intergovernmental Panel on Climate Change.
- Kaira, P., Joshi, J., & Pant, N. 2024. Micro Watershed Management of the Sai River: Applications of Geo-Informatics (Gis). EPRA International Journal of Agriculture and Rural Economic Research. https://doi.org/10.36713/epra15726.
- Knighton, D. 1998. Fluvial Forms and Processes: A New Perspective. Routledge.
- Lal, R. 2001. Soil Conservation and Management in Developing Countries. Science Publishers.
- Lasco, R. D., and Pulhin, F. B. 2006. Environmental services of Philippine forests: The case of carbon sequestration and watershed protection. ASEAN Journal on Science and Technology for Development, 23(2), 54-69.
- Lasco, R. D., and Pulhin, F. B. 2006. Carbon sequestration in the Philippines: The potential of agroforestry and reforestation. Philippine Journal of Environmental Science, 7(1), 23-30.
- Lasco, R. D., Pulhin, F. B., and Cruz, R. V. O. 2009. Climate Change and Forest Ecosystems in the Philippines: Vulnerabilities, Impacts, and Adaptation Strategies. World Agroforestry Centre.
- Lasco, R. D., Delos Santos, J. R., and Gunter, R. 2010. Forest management and climate change: Implications for agricultural productivity in the Philippines. Tropical Conservation Science, 3(2), 177-194.
- Lasco, R. D., et al. 2010. Climate Change and Agriculture in the Philippines: Impact Assessment and Adaptation Strategies. Environmental Science and Policy, 13(6), 451-460.
- Lasco, R. D., Pulhin, F. B., Cruz, R. V., and Roy, S. S. 2014. Agroforestry systems: A potential land use option for climate change adaptation and mitigation in Southeast Asia. Springer.
- Leopold, L. B., Wolman, M. G., and Miller, J. P. 1964. Fluvial Processes in Geomorphology. Dover Publications.
- Li, Z., and Wong, D.W.S. 2010. The Impact of Spatial Interpolation on Rainfall-Runoff Modelling: A Case Study in the Upper River Thames. Journal of Hydrology, 385(1–4), 69–76. DOI: 10.1016/j.jhydrol.2010.01.021
- Marsh, W.M. and Grossa, J.M. 2015. Environmental Geography: Science, Land Use, and Earth Systems. Wiley.
- Mines and Geosciences Bureau (MGB) 2021. MGB-08 Conducts IEC Campaign on Samar Bauxite Mineral Reservation in Samar Island. Retrieved from https://region8.mgb.gov.ph/en/featured-news/press-release/548-mgb-08-conducts-iec-campaign-on-samar-bauxite-mineral-reservation-in-samar-island.html#:~:text=Based%20on%20fieldworks%20conducted%2C%20bauxite,Engineer%2C%20and%20the%20Municipal%20Mayor.
- Montgomery, D. R., and Buffington, J. M. 1997. Channel-reach morphology in mountain drainage basins. Geological Society of America Bulletin, 109(5), 596-611.
- Mukul, S. A., Herbohn, J., and Firn, J. 2020. Rapid recovery of tropical forest diversity and structure after shifting cultivation in the Philippines uplands. Ecology and Evolution, 10(14), 7189-7211.
- Nepstad, D. C., Stickler, C. M., and Soares-Filho, B. S. 2008. Interactions among Amazon land use, forests, and climate: Prospects for a near-term forest tipping point. Philosophical Transactions of the Royal Society B: Biological Sciences, 363(1498), 1737-1746.
- Oke, T. R. 1987. Boundary Layer Climates (2nd ed.). Methuen.
- Ong, C. K., and Huxley, P. 2004. Tree-crop interactions: A physiological approach. CABI Publishing.
- PAGASA (Philippine Atmospheric, Geophysical and Astronomical Services Administration). 2020. Climate of the Philippines. Retrieved from PAGASA Website
- PCAARRD. 1999. Philippine Watershed Resource Management. Philippine Council for Agriculture, Aquatic and Natural Resources Research and Development.
- Pimentel, D. and Burgess, R. 2013. Environmental and Economic Costs of Soil Erosion and Conservation Benefits. Science of the Total Environment, 307(2), 111-123.
- Poff, N. L., Allan, J. D., Bain, M. B., et al. 1997. The natural flow regime. Bioscience, 47(11), 769-784.
- Ponce, V. M. 2014. Hydrology and Water Resources in the Arid and Semi-Arid Areas. International Journal of Water Resources and Arid Environments, 3(2), 35-45.
- Postel, S. L., and Thompson, B. H. 2005. Watershed protection: Capturing the benefits of nature’s water supply services. Natural Resources Forum, 29(2), 98-108.
- Santos, J.M., Silva, M.A., and Miranda, J. 2017. Assessment of rainfall interpolation methods in the Southeastern region of Brazil. Water, 9(4), 259. DOI: 10.3390/w9040259
- Soil Survey Staff. 2014. Keys to Soil Taxonomy. USDA-Natural Resources Conservation Service.
- Reynolds, J. F., et al. 2007. Ecosystem management in the context of climate change. Conservation Biology, 21(2), 408-416.
- Strahler, A. N. 1957. Quantitative analysis of watershed geomorphology. Transactions of the American Geophysical Union, 38(6), 913-920.
- Tesema, T. (2021). Impact of identical digital elevation model resolution and sources on morphometric parameters of Tena watershed, Ethiopia. Heliyon, 7. https://doi.org/10.1016/j.heliyon.2021.e08345.
- Wang, L., and Liu, H. 2006. An efficient method for identifying and filling surface depressions in digital elevation models for hydrologic analysis and modelling. International Journal of Geographical Information Science, 20(2), 193-213.
- Waterman, B., Alcantar, G., Thomas, S., & Kirk, M. 2022. Spatiotemporal variation in runoff and baseflow in watersheds located across a regional precipitation gradient. Journal of Hydrology: Regional Studies. https://doi.org/10.1016/j.ejrh.2022.101071.
- Zhang, B., Han, J., Liu, J., & Zhao, Y. 2025. The Impact of Shifts in Both Precipitation Pattern and Temperature Changes on River Discharge in Central Japan. Hydrology. https://doi.org/10.3390/hydrology12070187.
- Zhao, Z., et al. 2019. Impacts of land use change on runoff and soil erosion in the loess plateau, China. Land Degradation and Development, 30(2), 215-226.
Appendices
| Province | Municipality | Percentage (%) | Barangays covered |
|---|---|---|---|
| Samar | Paranas | 54.14 | Apolonia, Balbagan, Pabanog, Anagasi, Bagsa, Cantaguic, Cantao-an, Cantato (Canturab), Casandig I, Concepcion, Jose Roño, Cawayan, Lawaan I, Lipata, Lokilokon, Mangcal, Maylobe, Minarog, Nawi, Paco, Pagsanjan (Pagsan-an), Poblacion 4, Salay, San Isidro, Santo Niño, Sulopan, Tabucan, Tapul, Tula, Tutubigan, Casandig II, Lawaan II, Buray (Binogho), Patag, Pequit, Poblacion 1, Tenani, and Poblacion 6 |
| Motiong | 9.79 | Poblacion I-A, Angyap, Beri, Bonga, Calantawan, Calapi, Caluyahan, Canvais, Canatuan, Candomacol, Capaysagan, Caranas, Caulayanan, Hinica-an, Inalad, Linonoban, Malobago, Malonoy, Mararangsi, Maypange, New Minarog, Pamamasan, San Andres, Sarao, Pusongan, and Poblacion I | |
| Jiabong | 6.65 | Bugho, Candayao, Casapa, Cristina, Dogongan, Garcia, Hinaga, Jidanao, Lulugayan, Malino, Mercedes, Nagbac, San Andres, San Fernando, and San Miguel | |
| Hinabangan | 2.42 | Lim-ao, Bagacay, San Rafael, Fatima, Consolabao | |
| San Jose de Buan | 1.36 | Babaclayon, Cataydongan, Hiduroma | |
| San Jorge | 0.0001 | Bungliw | |
| Eastern Samar | Can-avid | 23.06 | Boco, Baruk, Caghalong, Camantang, Can-ilay, Cansangaya, Canteros, Carolina, Guibuangan, Jepaco, Mabuhay, Malogo, Obong, Barangay 1 Poblacion, Barangay 10 Poblacion, Barangay 2 Poblacion, Barangay 3 Poblacion, Barangay 4 Poblacion, Barangay 5 Poblacion, Barangay 6 Poblacion, Barangay 7 Poblacion, Barangay 8 Poblacion, Barangay 9 Poblacion, Solong, Balagon, Pandol, Salvacion |
| Dolores | 1.26 | Aroganga, Cagtabon, and Magongbong | |
| Taft | 0.74 | Batiawan, Beto, Pangabutan, San Rafael, and Binaloan | |
| Maslog | 0.57 | Carayacay |
| Slope (%) | Description | Area Covered (%) |
|---|---|---|
| >50 | Mountainous | 15 |
| 30–50 | Hilly to Mountainous | 28.3 |
| 18–30 | Rolling to Hilly | 23.7 |
| 8–18 | Undulating to Rolling | 17.3 |
| 0–8 | Level to Undulating | 15.3 |
| Top | Level to Undulating (0%–8%) | |||
|---|---|---|---|---|
| Province | Municipality | Barangay | Area (ha) | |
| 1 | Samar | Paranas | Tula | 246.42 |
| 2 | E. Samar | Can-Avid | Baruk | 240.96 |
| 3 | E. Samar | Can-Avid | Canteros | 162.62 |
| 4 | Samar | Paranas | Anagasi | 132.92 |
| 5 | E. Samar | Motiong | Capaysagan | 130.98 |
| 6 | E. Samar | Can-Avid | Balagon | 114.27 |
| 7 | E. Samar | Can-Avid | Guibuangan | 100.72 |
| 8 | Samar | Paranas | Cantaguic | 95.18 |
| 9 | Samar | Paranas | Sulopan | 94.76 |
| 10 | Samar | Motiong | Pamamas-An | 92.38 |
| Top | Mountainous (50% and above) | |||
|---|---|---|---|---|
| Province | Municipality | Barangay | Area (ha) | |
| 1 | Samar | Paranas | Tula | 331.03 |
| 2 | Samar | Paranas | Anagasi | 307.33 |
| 3 | Samar | Paranas | Tenani | 244.28 |
| 4 | Samar | Paranas | Maylobe | 216.73 |
| 5 | E. Samar | Can-Avid | Pandol | 156.50 |
| 6 | Samar | Paranas | Lawaan I | 143.49 |
| 7 | Samar | Paranas | Patag | 117.70 |
| 8 | E. Samar | Taft | Binaloan | 117.05 |
| 9 | E. Samar | Taft | San Rafael | 116.32 |
| 10 | E. Samar | Can-Avid | Salvacion | 99.93 |
| Province, Municipality, Barangay | 400–500 (masl) | 400–500 Total | 500–1000 (masl) | 500–1000 Total | Grand Total | |||
|---|---|---|---|---|---|---|---|---|
| Brush/Shrubs | Built-up | Grassland | Brush/Shrubs | Grassland | ||||
| Samar | 528.27 | 0.09 | 113.28 | 641.64 | 29.86 | 2.45 | 32.30 | 673.94 |
| Hinabangan | 126.50 | 4.88 | 131.38 | 131.38 | ||||
| Cabalagnan | 22.65 | 22.65 | 22.65 | |||||
| Lim-Ao | 103.86 | 4.88 | 108.74 | 108.74 | ||||
| Jiabong | 106.10 | 44.21 | 150.31 | 0.03 | 0.03 | 150.34 | ||
| Casapa | 1.74 | 1.74 | 1.74 | |||||
| Dogongan | 7.36 | 6.37 | 13.73 | 13.73 | ||||
| Garcia | 12.74 | 5.55 | 18.29 | 18.29 | ||||
| Hinaga | 3.35 | 3.35 | 3.35 | |||||
| Malino | 2.31 | 2.10 | 4.40 | 4.40 | ||||
| Mercedes | 21.32 | 6.38 | 27.70 | 27.70 | ||||
| San Andres | 0.61 | 0.61 | 0.61 | |||||
| San Fernando | 56.31 | 20.89 | 77.19 | 0.03 | 0.03 | 77.22 | ||
| San Miguel | 2.72 | 0.58 | 3.30 | 3.30 | ||||
| Motiong | 72.54 | 16.44 | 88.98 | 3.93 | 1.51 | 5.44 | 94.42 | |
| Beri | 5.20 | 2.93 | 8.12 | 2.59 | 0.99 | 3.57 | 11.69 | |
| Canvais | 29.70 | 11.52 | 41.21 | 1.34 | 0.52 | 1.87 | 43.08 | |
| Malobago | 3.80 | 0.19 | 4.00 | 4.00 | ||||
| San Andres | 33.84 | 1.81 | 35.65 | 35.65 | ||||
| Paranas | 150.27 | 32.12 | 182.38 | 20.44 | 0.94 | 21.37 | 203.76 | |
| Anagasi | 0.01 | 0.48 | 0.49 | 0.49 | ||||
| Apolonia | 0.25 | 0.25 | 0.25 | |||||
| Concepcion | 2.81 | 0.03 | 2.84 | 2.84 | ||||
| Maylobe | 126.54 | 31.09 | 157.64 | 17.18 | 0.94 | 18.12 | 175.76 | |
| Pabanog | 19.64 | 19.64 | 19.64 | |||||
| Pagsanjan | 0.38 | 0.51 | 0.89 | 0.89 | ||||
| Tabucan | 0.63 | 0.63 | 3.25 | 3.25 | 3.88 | |||
| Tenani | 0.01 | 0.01 | 0.01 | |||||
| San Jose de Buan | 72.86 | 0.09 | 15.63 | 88.58 | 5.46 | 5.46 | 94.04 | |
| Babaclayon | 37.96 | 0.09 | 14.79 | 52.84 | 0.08 | 0.08 | 52.92 | |
| Cataydongan | 34.90 | 0.84 | 35.74 | 5.38 | 5.38 | 41.12 | ||
| Grand Total | 528.27 | 0.09 | 113.28 | 641.64 | 29.86 | 2.45 | 32.30 | 673.94 |
| Province | Municipality | Barangay | Area (ha) |
|---|---|---|---|
| E. Samar | Can-Avid | Canteros | 592.89 |
| Samar | Paranas | Tula | 423.77 |
| E. Samar | Can-Avid | Baruk | 340.08 |
| E. Samar | Can-Avid | Camantang | 311.44 |
| E. Samar | Can-Avid | Guibuangan | 289.98 |
| Samar | Paranas | Lokilokon | 231.01 |
| Samar | Paranas | Tutubigan | 223.76 |
| Samar | Paranas | Cantato (Canturab) | 178.08 |
| E. Samar | Can-Avid | Salvacion | 174.65 |
| Samar | Paranas | Lawaan I | 170.66 |