Macroplastic Accumulation in Coastal Communities of Iligan Bay, Philippines: A Reflection of the Municipal Solid Waste Management
Abstract
Marine plastic pollution has become a growing environmental concern, particularly in coastal regions where plastic waste directly threatens marine ecosystems and the socio-economic conditions of coastal communities. Despite this, limited studies have focused on macroplastic litter in the coastal areas of Southern Philippines, particularly the factors contributing to its accumulation, such as local waste management practices and community behaviors. This study assessed the prevalence, types, and density of macroplastics in three coastal municipalities along Iligan Bay: Naawan, Manticao, and Lugait. Results showed that macroplastic litter was abundant in all sites, with Lugait recording the highest density (1.04/m²), followed by Naawan (0.83/m²), and Manticao (0.80/m²). The most common waste items were food packaging (25%), plastic bottles (22%), and plastic bags (17%), resulting in Multilayers (30%), PET (25%), and PP (20%) as the most prevalent polymer types. Clean-coast-index (CCI) classified Lugait as an extremely dirty coast, while Naawan and Manticao were classified as dirty. The focus group discussion revealed that poor waste management and residents' disposal practices can be attributed to the abundance of macroplastics. Overall, this study highlights the critical need for targeted interventions by Local Government Units to improve waste management and mitigate macroplastic accumulation in Iligan Bay.
Keywords
clean-coast-index, macroplastics, solid waste management, focus group discussion, Iligan Bay
Introduction
Macroplastics have been a major source of marine pollution, impacting the health of marine ecosystems and the socio-economic conditions of coastal communities. These plastics has become an increasingly significant global issue in coastal marine ecosystems, drawing considerable interest from both the scientific community and the general public (Xu et al., 2021). The Philippines alone was noted as one of the major contributors of macroplastics in the marine environment and ranked third worldwide due to the excessive use of single-use plastic products, poor waste management practices, and insufficient environmental law enforcement (Jambeck et al., 2015; Provencher et al., 2019; Plantado et al., 2023). According to the World Bank (2023), the Philippines produces an astonishing 2.7 million tons of plastic waste annually, with approximately 20 percent of this waste ends up in the ocean. Also, the country has been consistently listed as having a high macroplastic load in the marine coastal environment in the Western Pacific (Westpac) (Jambeck et al., 2015; Lebreton et al., 2017). This was attributed to the increase in the Filipino population, the projected increase in plastic use, and inadequate disposal practices (Ritchie & Roser, 2019). Moreover, the Philippines uses a staggering 163 million pieces of sachets per day, and this heavy reliance on single-use plastics such as multilayer sachets and pouches has resulted in the country being dubbed a "sachet economy," contributing significantly to the escalating levels of marine plastic pollution in the region (World Bank, 2023). It is speculated that one of the causes of the uncontrolled plastic waste disposal on land and in the marine coastal environment (Posadas, 2014) is the sachet economy (Ang & Massingham, 2007; Fernando, 2015).
Plastic debris is categorized based on size, as megaplastics (>100 mm), macroplastics (25 mm –100 mm), mesoplastics (5 mm – 25 mm), microplastics (1 µm – 5 mm), and nanoplastics (<1 µm) (Barnes et al., 2009; GESAMP, 2016; Barboza et al., 2019). Plastic products were often mismanaged or abandoned in dumping sites which led to environmental pollution that posed significant threats to ecosystems, wildlife, and human health (Lahens et al., 2018; Horton & Barnes, 2020). Each year, macroplastics and their adverse effects were gaining heightened attention on the international stage. Various entities, including governments and non-governmental organizations, industries, and international bodies, are actively introducing initiatives aimed at mitigating plastic waste pollution across marine, riverine, and terrestrial settings (Emmerik, 2021). While the disposal of these plastics is mostly on land, they always find ways to enter and accumulate in water bodies (Horton et al., 2017). In fact, plastic pollution has become a major environmental concern for policymakers, businesses, and researchers (Winton et al., 2020). Identified as the primary contributor of pollution by mass, it has posed wide range of serious threat to riverine systems, affecting the various life forms within them, increasing flood risk, thus adversely affecting livelihoods (Lahens et al., 2018; Horton & Barnes, 2020), and eventually dumping these pollutants into the coastal areas and oceans (Superio & Abreo, 2020). As these plastic fragments, larger than 2.5 centimeters, are finding their way into marine environments through a variety of pathways (e.g. rivers, wastewater systems, and direct dumping), it has led to a serious and growing threat to the world's oceans (Browne et al., 2013). Once in the ocean, macroplastics are a significant threat to marine life, thus requiring immediate attention. In order to reduce the risks associated with plastic pollution in coastal environments, it is imperative to put in place measures such as waste management, promote the 4-Rs (Reduce, Reuse, Recycle, Refuse), and educate stakeholders on sustainable practices (Singh & Khatri, 2022).
Plastic pollution in bays is increasingly recognized as a significant threat and pressing issue, underscoring the critical need for research and proactive measures. One of the 10 major fishing grounds in the Philippines is the Iligan Bay, ranking 6th in terms of its total area at 1,811 hectares, just behind Sibugay Bay in Zamboanga del Sur, which spans 1,935 hectares (BFAR, 2021). It is considered as a highly productive fishing ground in the southern part of the Philippines (Rosa et al., 2022), and the largest bay in the western part of Northern Mindanao (Jimenez et al., 2020). Highlighting the importance of Iligan Bay as a vital fishing ground in the Philippines, it is crucial to assess the extent of plastic pollution in its coastal areas due to the potential risks it poses to the marine ecosystem and humans (Díaz-Mendoza et al., 2020).
Coastal regions are estimated to have the highest accumulation of plastic wastes, posing a significant risk of plastic pollution in coastal areas and sediments (Horton & Barnes, 2020; Pinnell & Turner, 2020). These wastes come in varying forms, shades, polymers, and sizes. While cities worldwide are committed to reducing plastic waste leakage through research, waste infrastructure, and monitoring. Understanding the extent of this pollution through quantification of plastic debris in coastal areas is therefore essential (Lippiatt et al., 2013). The thorough assessment and accurate data on plastic sources, emissions, effects, and risks are crucial for preventing and effectively managing plastic pollution.
While numerous Philippine studies have documented plastic pollution in coastal environments, few have integrated community-level perspectives to explain why plastics persist in specific areas. Community behaviors play a crucial role in shaping waste pathways, yet these drivers remain underexplored. Understanding the socio-cultural and behavioral factors behind plastic disposal is essential for interpreting pollution patterns in coastal regions.
Therefore, this study aims to investigate the prevalence of macroplastics in the coastal municipalities of Lugait, Manticao, and Naawan along Iligan Bay. Specifically, it seeks to identify the types, density, and composition of macroplastic waste present on their shorelines, evaluate the clean-coast index of these areas, and assess residents' solid waste management practices through focus group discussions.
Methodology
2.1 Study Area
The sampling locations were situated along the shorelines of Iligan Bay, encompassing the municipalities of Lugait, Manticao, and Naawan, in the province of Misamis Oriental, Region 10, Philippines (Figure 1).
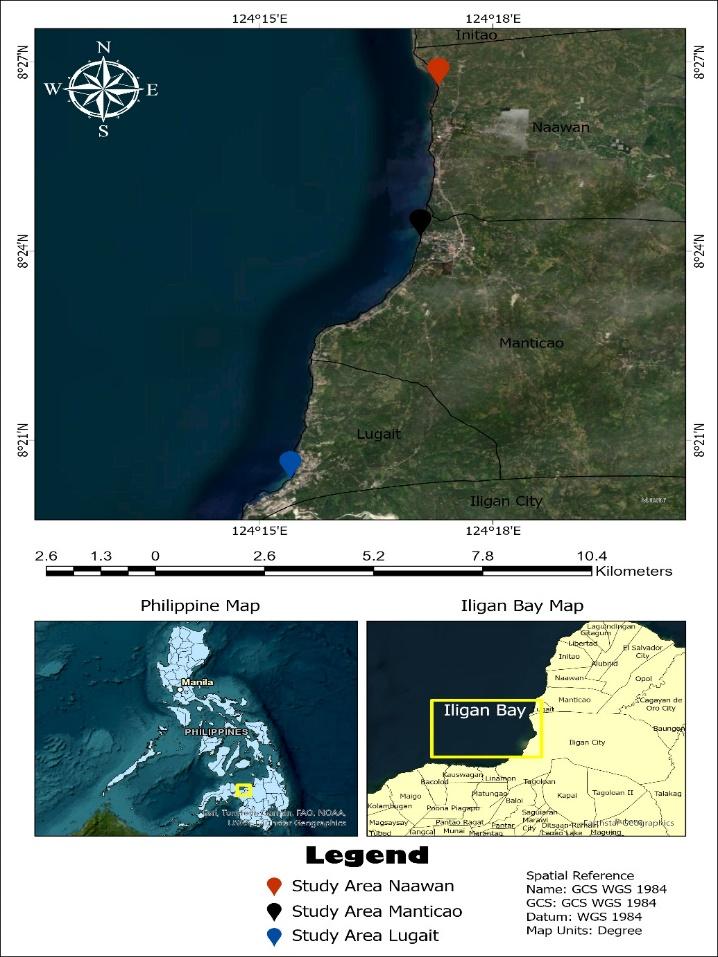
Shown in Table 1 are the different area classification and coordinates of the site areas. Site 1 is in the municipality of Naawan, a fourth-class municipality located in the northern part of Misamis Oriental. It has a land cover of 88.50 sq km made up of 10 barangays, with a total population estimate of 22, 444 (2020 Census, 2021–251). Site 2 is in the municipality of Manticao, Misamis Oriental, a fourth-class municipality consisting of 13 barangays, with a total land cover of 123.01 sq. km, and has a population of 29, 469 (2020 Census, 2021–251). Lastly is site 3 is the municipality of Lugait, situated in the north-western part of Misamis Oriental. This town was categorized as a second-class municipality, with a total land cover of 27.45 sq. km and a population of 20, 559 (2020 Census, 2021–251).
| Site | Area Classification | Coordinates |
|---|---|---|
| Naawan | Residential (Urban Area) | 8°26'39"N 124°17'17"E |
| Manticao | Residential (Urban Area) | 8°24'13"N 124°17'03"E |
| Lugait | Residential (Urban Area) | 8°20'20"N 124°15'20"E |
2.2. Plastic Collection on Shorelines
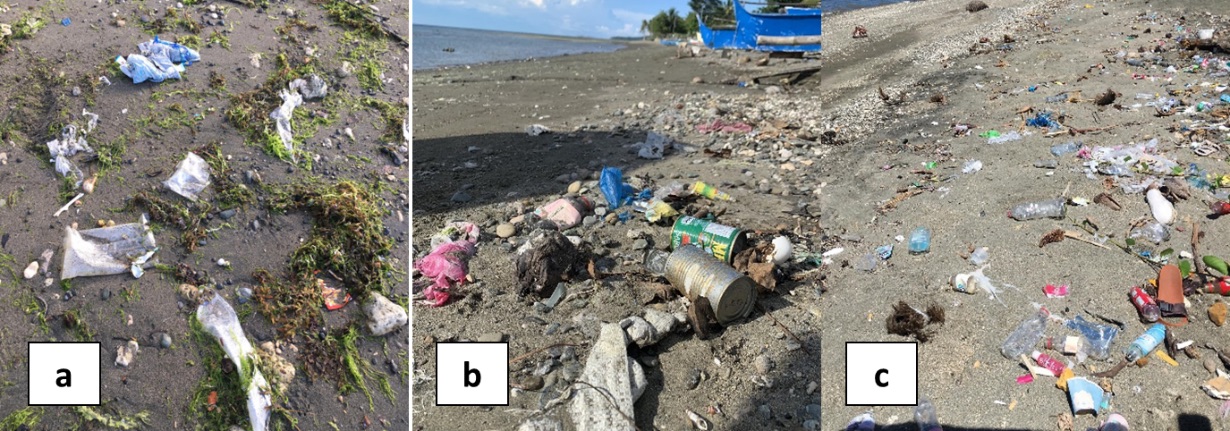
Plastic litters were collected on the shorelines of the three coastal sites (Figure 2), following the method of Pacilan and Bacosa (2022). The collection of plastics was done for six (6) non-consecutive days, distributed across three weekdays — November 2, 9, and November 16, 2023 — and three weekends — October 29, November 5, and November 12, 2023.
Each area was surveyed using a 100-meter transect line established parallel to the shorelines. The transect was further divided into 20 of 5 m quadrats. Among these quadrats, four 5 x 5 m quadrats were randomly selected (Lippiat et al., 2013). These chosen quadrats serve as the primary sampling sites within the designated area. To determine the coastal width, a 5 m measurement was taken from the boundary between high tide line and extended towards the shoreline. This measurement was conducted during low tide hours.
To ensure precise location marking, wooden stakes were utilized as markers at the beginning and end of each transect. GPS coordinates were recorded to facilitate repeat sampling during subsequent data collection sessions. Within each 5 x 5 m quadrat, all plastic litters found were collected, counted, and categorized, and were used to calculate for the Clean Coast Index (CCI) (Alkalay et al., 2007). Guidelines from the NOAA Marine Debris Monitoring and Assessment Program (MDMAP) Survey Debris Datasheet (Lippiat et al., 2013) were followed and modified while recording data.
2.3. Macroplastic categorization
The collected plastic debris was categorized based on their general purpose such as food packaging, food containers, styrofoam, plastic bottle, plastic cups, plastic caps, straws, clothes, toiletries, napkins and diapers, cigarettes, plastic fragments, disposable utensils, plastic bags, medical waste, sack, ropes, nylon fishing line, fishing nets, disposable lighters, rubbers, other bottle containers, metals, glass, and electronics (Syakti 2017; Galarpe, 2019; Pacilan & Bacosa 2022). Following this categorization, the plastic wastes was further classified into nine common plastic polymer type, which are polyethylene terephthalate (PET), high-density polyethylene (HDPE), low-density polyethylene (LDPE), polyester (PES), polypropylene (PP), polystyrene (PS), polyvinyl chloride (PVC), multilayers, and others (Martins & Sobral, 2011).
2.4 Focus Group Discussion
To explore the practices of residents near the sampling areas regarding solid waste management, a series of focus group discussions (FGD) was conducted. Compared to individual interviews, FGD offers an advantage as they facilitate discussions among participants, enabling a clearer expression of opinions, encouraging deeper reasoning, and revealing whether opinions were shared by many (Alrawahi et al., 2020). The FGDs were conducted among the coastal residents of the municipalities of Naawan, Manticao, and Lugait.
2.4.1 Setting and Participants
Residents near the shore in each municipality participated in the FGDs: eight residents from Naawan, eleven residents from Lugait, and eight residents from Manticao. While there may be varying viewpoints on optimal sizes, focus groups are typically small. Each group had between 8 and 12 participants (Lazar et al., 2017). To gather these participants, the researchers coordinated with the concerned barangays. Anonymity (using code names) and confidentiality were strictly observed as appropriate research ethics were followed. A total of 27 residents participated in the FGD.
2.4.2 Focus group discussion (FGD) procedures
Using a semi-structured activity flow, the FGDs allowed respondents to freely share their thoughts regarding solid waste management practices as well as issues and concerns of their locality. Each session lasted for approximately 15 min. To further strengthen the study's credibility and validate its findings, a summary of the results was shared to the participants at the conclusion of each discussion (Birt et al., 2016).
2.5 Data Analysis
2.5.1 Abundance and Density of Macroplastic
In determining the abundance of macroplastics, a non-consecutive sampling was conducted for a total of six days in the three selected sampling areas. The macroplastic composition was determined using the equation adopted from the study of Abreo et al. (2020).
$$ \textit{Composition} = \frac{\textit{number of items per category}}{\textit{total number of items in all categories}} \times 100 $$
To determine the density of macroplastics, the total number of items collected in each sampling areas were divided by the total sampled area (Equation 2), a method modified in the study of Abreo et al. (2020) as cited in Inocente & Bacosa (2022).
$$ \textit{Density} = \frac{\textit{Number of plastic litter}}{\textit{Total area sampled } (m^{2})} $$
2.5.2 Clean Coast Index
The Clean-coast index (CCI) was proposed as the most effective method for assessing the actual cleanliness of coastlines. It uses the presence of plastic debris as a factor in evaluating beach cleanliness, making it a straightforward mathematical tool that helps prevent any potential bias by the assessor (Alkalay et al., 2007; Pacilan & Bacosa, 2022). The CCI of the study sites was calculated using the formula of Alkalay et al. (2007) as cited in Bacosa & Inocente (2022) as shown below;
$$ CCI = \frac{\textit{Total number of plastic items}}{\textit{Total area sampled } (m^{2})} \times K $$
To ensure that the values generated during the calculation will not fall between 0 and 1, a coefficient of K = 20 was inserted in the equation. The CCI values categorizes coastal cleanliness as 0-2 (very clean), 2-5 (clean), 5-10 (moderately clean), 10-20 (dirty), and >20 (extremely dirty) coastal area (Vlachogianni et al., 2018; Inocente & Bacosa, 2022).
2.5.3 Statistical analysis
The data was analyzed using the PAST (Paleontological Statistics Software) statistical tool (Hammer et al., 2001), employing a one-way ANOVA test to identify the significant differences between the three shorelines. A t-test analysis was performed to compare the waste collected on weekdays and weekends. Density (items/m²) ± SD was determined, and values were evaluated as significantly different at p < 0.05.
Results and Discussion
3.1 Macroplastic Characteristics
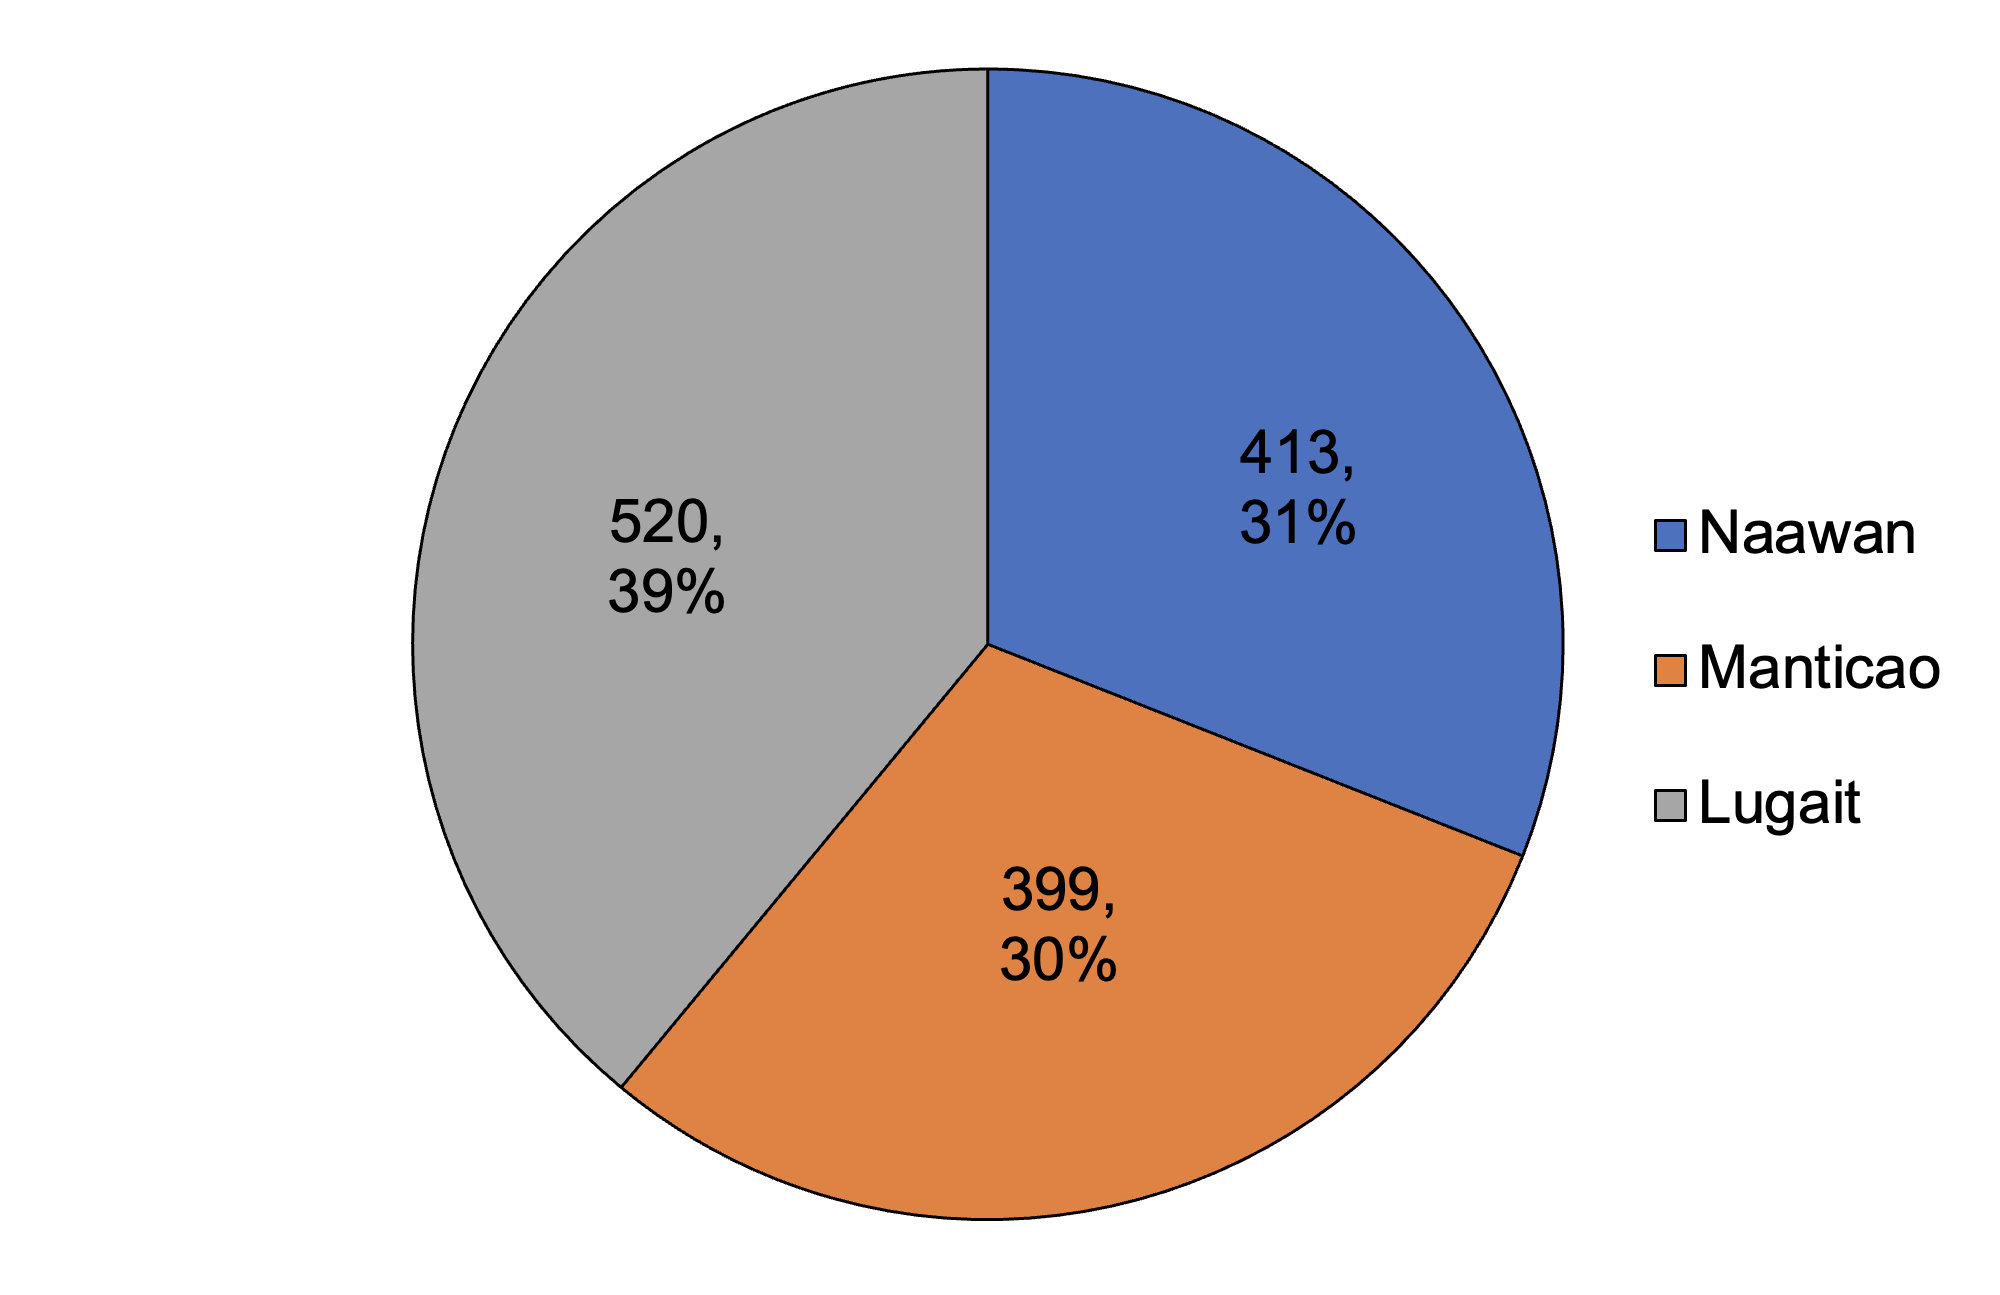
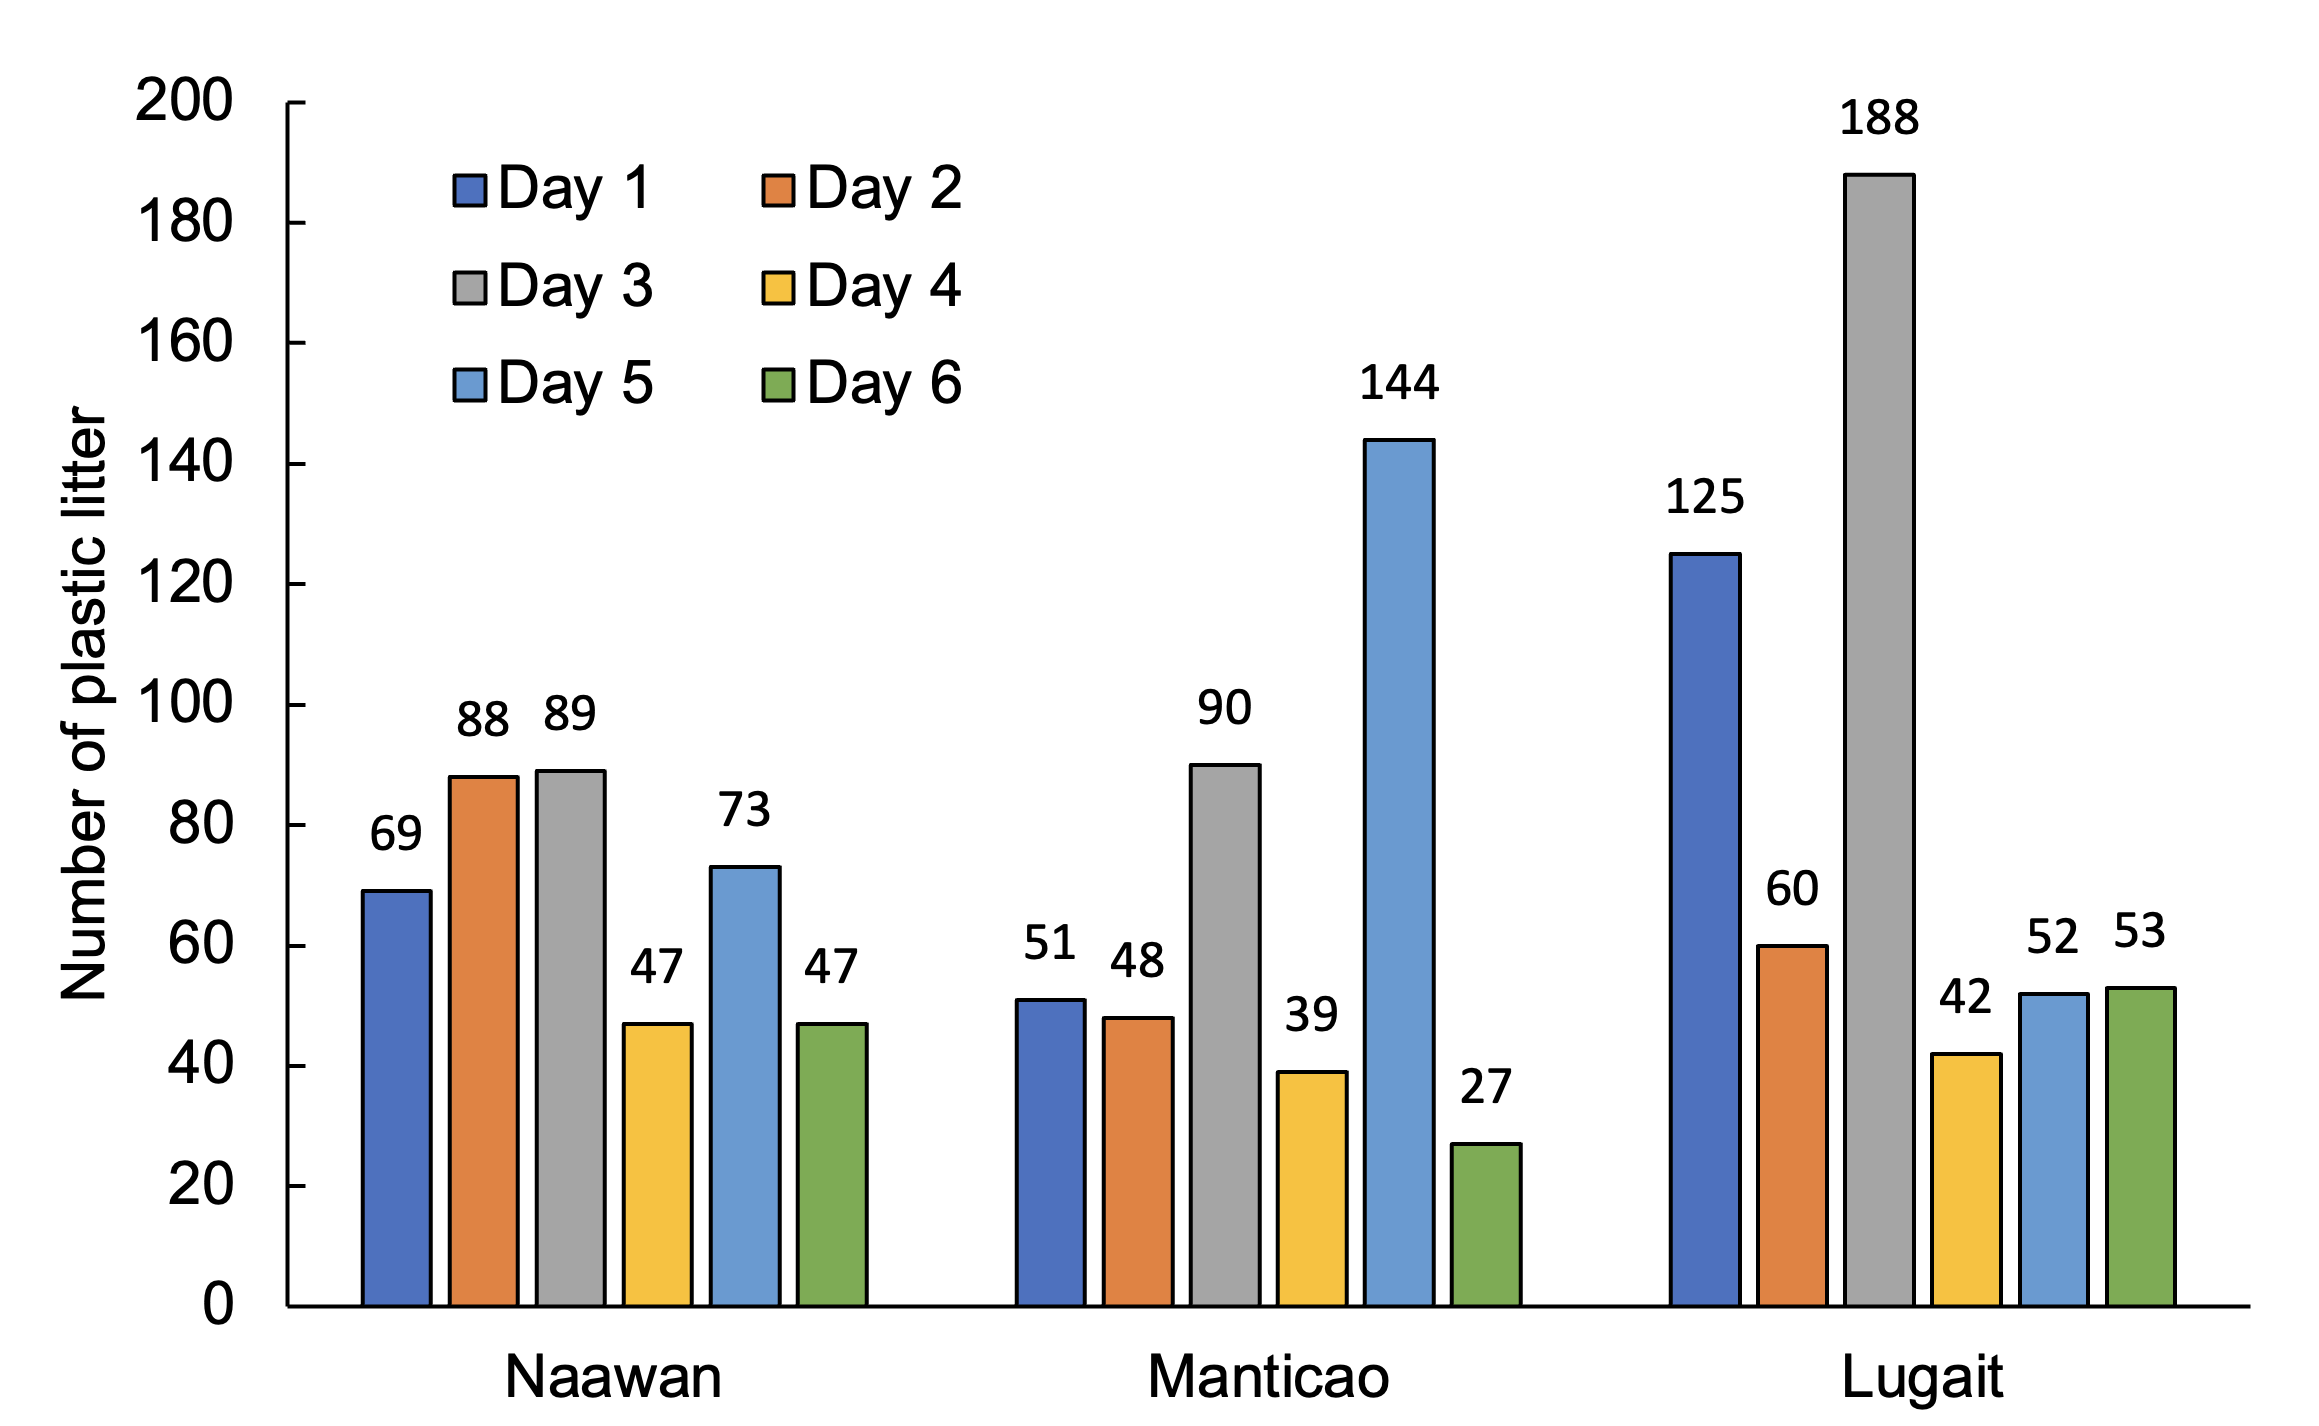
A total of 1,332 plastic items were collected in the 6-day sampling in 3 sites, of which 39% were from Lugait, 30% from Manticao, and 31% were from Naawan (Figure 3). The amount of plastic waste collected did not decrease over time and higher numbers of plastics were observed in different sites in succeeding sampling (Figure 4). The fluctuating quantity of plastics gathered throughout the sampling period indicates that plastics are drifters and can be deposited anywhere at any moment. In the case of Lugait, an increase of plastics was observed on the third sampling compared to the other sampling days. Similarly, in Manticao, from 51 pieces of plastics collected during the first day, an increase to 114 plastic wastes were recorded during the 5th day of sampling. This finding may be attributed to two possible factors; (1) the human factor, since the sampling sites were all residential areas, hence the abundance of plastics on the shoreline may be influenced by the behaviours of residents towards plastic waste generation. This result agrees with that of Sajorne et al. (2021), who found that plastic waste is 2-5 times more prevalent in residential areas than in non-residential ones. Likewise, as identified by the coastal residents during the FGD, most of the household wastes they generate were plastics, specifically food wrappers from coffee and milk, plastic bags, and plastic beverage bottles, and their prominent way of disposing of these wastes was either through burning or burying it into the ground.
The second factor is the weather or atmospheric changes. Residents indicated that they observed an abundance of waste after heavy rains, in the months of October through November, when the study was conducted. During these months, southwest monsoon (habagat) season often brings frequent cyclonic storms (Skliris, 2016). Heavy rains may have washed upland waste and accumulated in the coastal areas (Lebreton et al., 2019) while storm waves and strong surface currents may deposit sizeable amounts of plastic from other areas or islands (Su et al., 2016).
Further, a total of 16 waste classes were identified and recorded. Overall results showed that 25% of wastes were food packaging, followed by plastic bottles (22%) and plastic bags (17%) (Table 2). Food packaging includes junk food and biscuits wrappers, as well as condiments wrappers (i.e., soy sauce, vinegar, and seasoning). This kind of wastes was the most abundant due to the prominence of the sachet market especially in marginal communities such as the coastal communities. These findings are consistent with prior researches (Paler et al., 2019; Kalnasa et al., 2020; Esquinas et al., 2020; Sajorne et al., 2021) which found that in countries with high rates of poverty, like the Philippines, products in sachets and other locally available food packaging are more accessible, hence the most prevalent type of plastic waste.
| Classifications | Number of items | Percentage (%) |
|---|---|---|
| Food Packaging | 338 | 25.4 |
| Plastic Bottles | 296 | 22.2 |
| Plastic Bags | 234 | 17.6 |
| Plastic Cups | 163 | 12.2 |
| Napkins/Diapers | 46 | 3.5 |
| Plastic Caps | 41 | 3.1 |
| Nylon Fishing Line | 38 | 2.9 |
| Straws | 29 | 2.2 |
| Styrofoam | 26 | 2.0 |
| Clothes | 24 | 1.8 |
| Sack | 24 | 1.8 |
| Ropes | 11 | 0.8 |
| Medicinal Waste | 11 | 0.8 |
| Plastic Fragments | 10 | 0.8 |
| Lighters | 9 | 0.7 |
| Others (miscellaneous) | 32 | 2.4 |
Plastic bottles which include soft drinks and mineral water bottles, and other plastic bottle containers (i.e., oil and alcohol) were the second most abundant plastic litter recorded. Most residents just discard this type of waste instead of recycling or upcycling. This observation reflects the absence and/or inefficiency of the material recovery facility (MRF) in the sites. Based on the findings from the conducted focus group discussions, the locals expressed varying opinions regarding the presence and functionality of MRFs in their respective areas. In Naawan, residents noted the existence of an MRF, but pointed out the absence of waste collection services, questioning the purpose of having a facility without a proper waste management system in place such as a sanitary landfill. On the other hand, in Manticao and Lugait, although lacking MRFs, residents reported regular waste collection services occurring weekly but vary according to the weather conditions. However, due to the absence of a centralized facility, waste segregation primarily transpires at the household level. Garbage is typically placed on the streets for collection, highlighting the complexities surrounding waste management infrastructure and practices in different communities. Additionally, coastal activities by tourists and visitors were also suspected of contributing to the plastic waste generation, as they brought plastic disposables to the beach. Like in any other coastal regions, tourism has emerged as a significant contributor to plastic pollution in coastal areas (Zhang et al., 2023).
The third most abundant plastic litter was plastic bags such as ice wrappers and "sando bags” (grocery plastic bags). The abundance of ice wrappers is associated with the consumption of ice by the fisherfolks used for cooling their fish catch. While “sando bags” were abundant since most sari-sari (retail) stores near the sampling sites used this as packaging for their sold products. Accordingly, the act of purchasing in sari-sari stores and putting items, may it be few or many, in “sando bags” contributes to the plastic litter (Requiron & Bacosa, 2022). And since the Philippines is a tropical nation with a lot of precipitation annually (PAGASA, 2021), the plastic bags generated from this type of purchase even from other areas may be carried to rivers by surface runoff and storm waters, which ends up and accumulate to the seas and oceans (Li et al., 2020). Generally, these plastic types are regarded as single-use plastics thereby contributing a significant amount of plastics in the coastal environments due to their rapid production rates and short service life (Lechthaler et al., 2020; Gaboy et al., 2022).
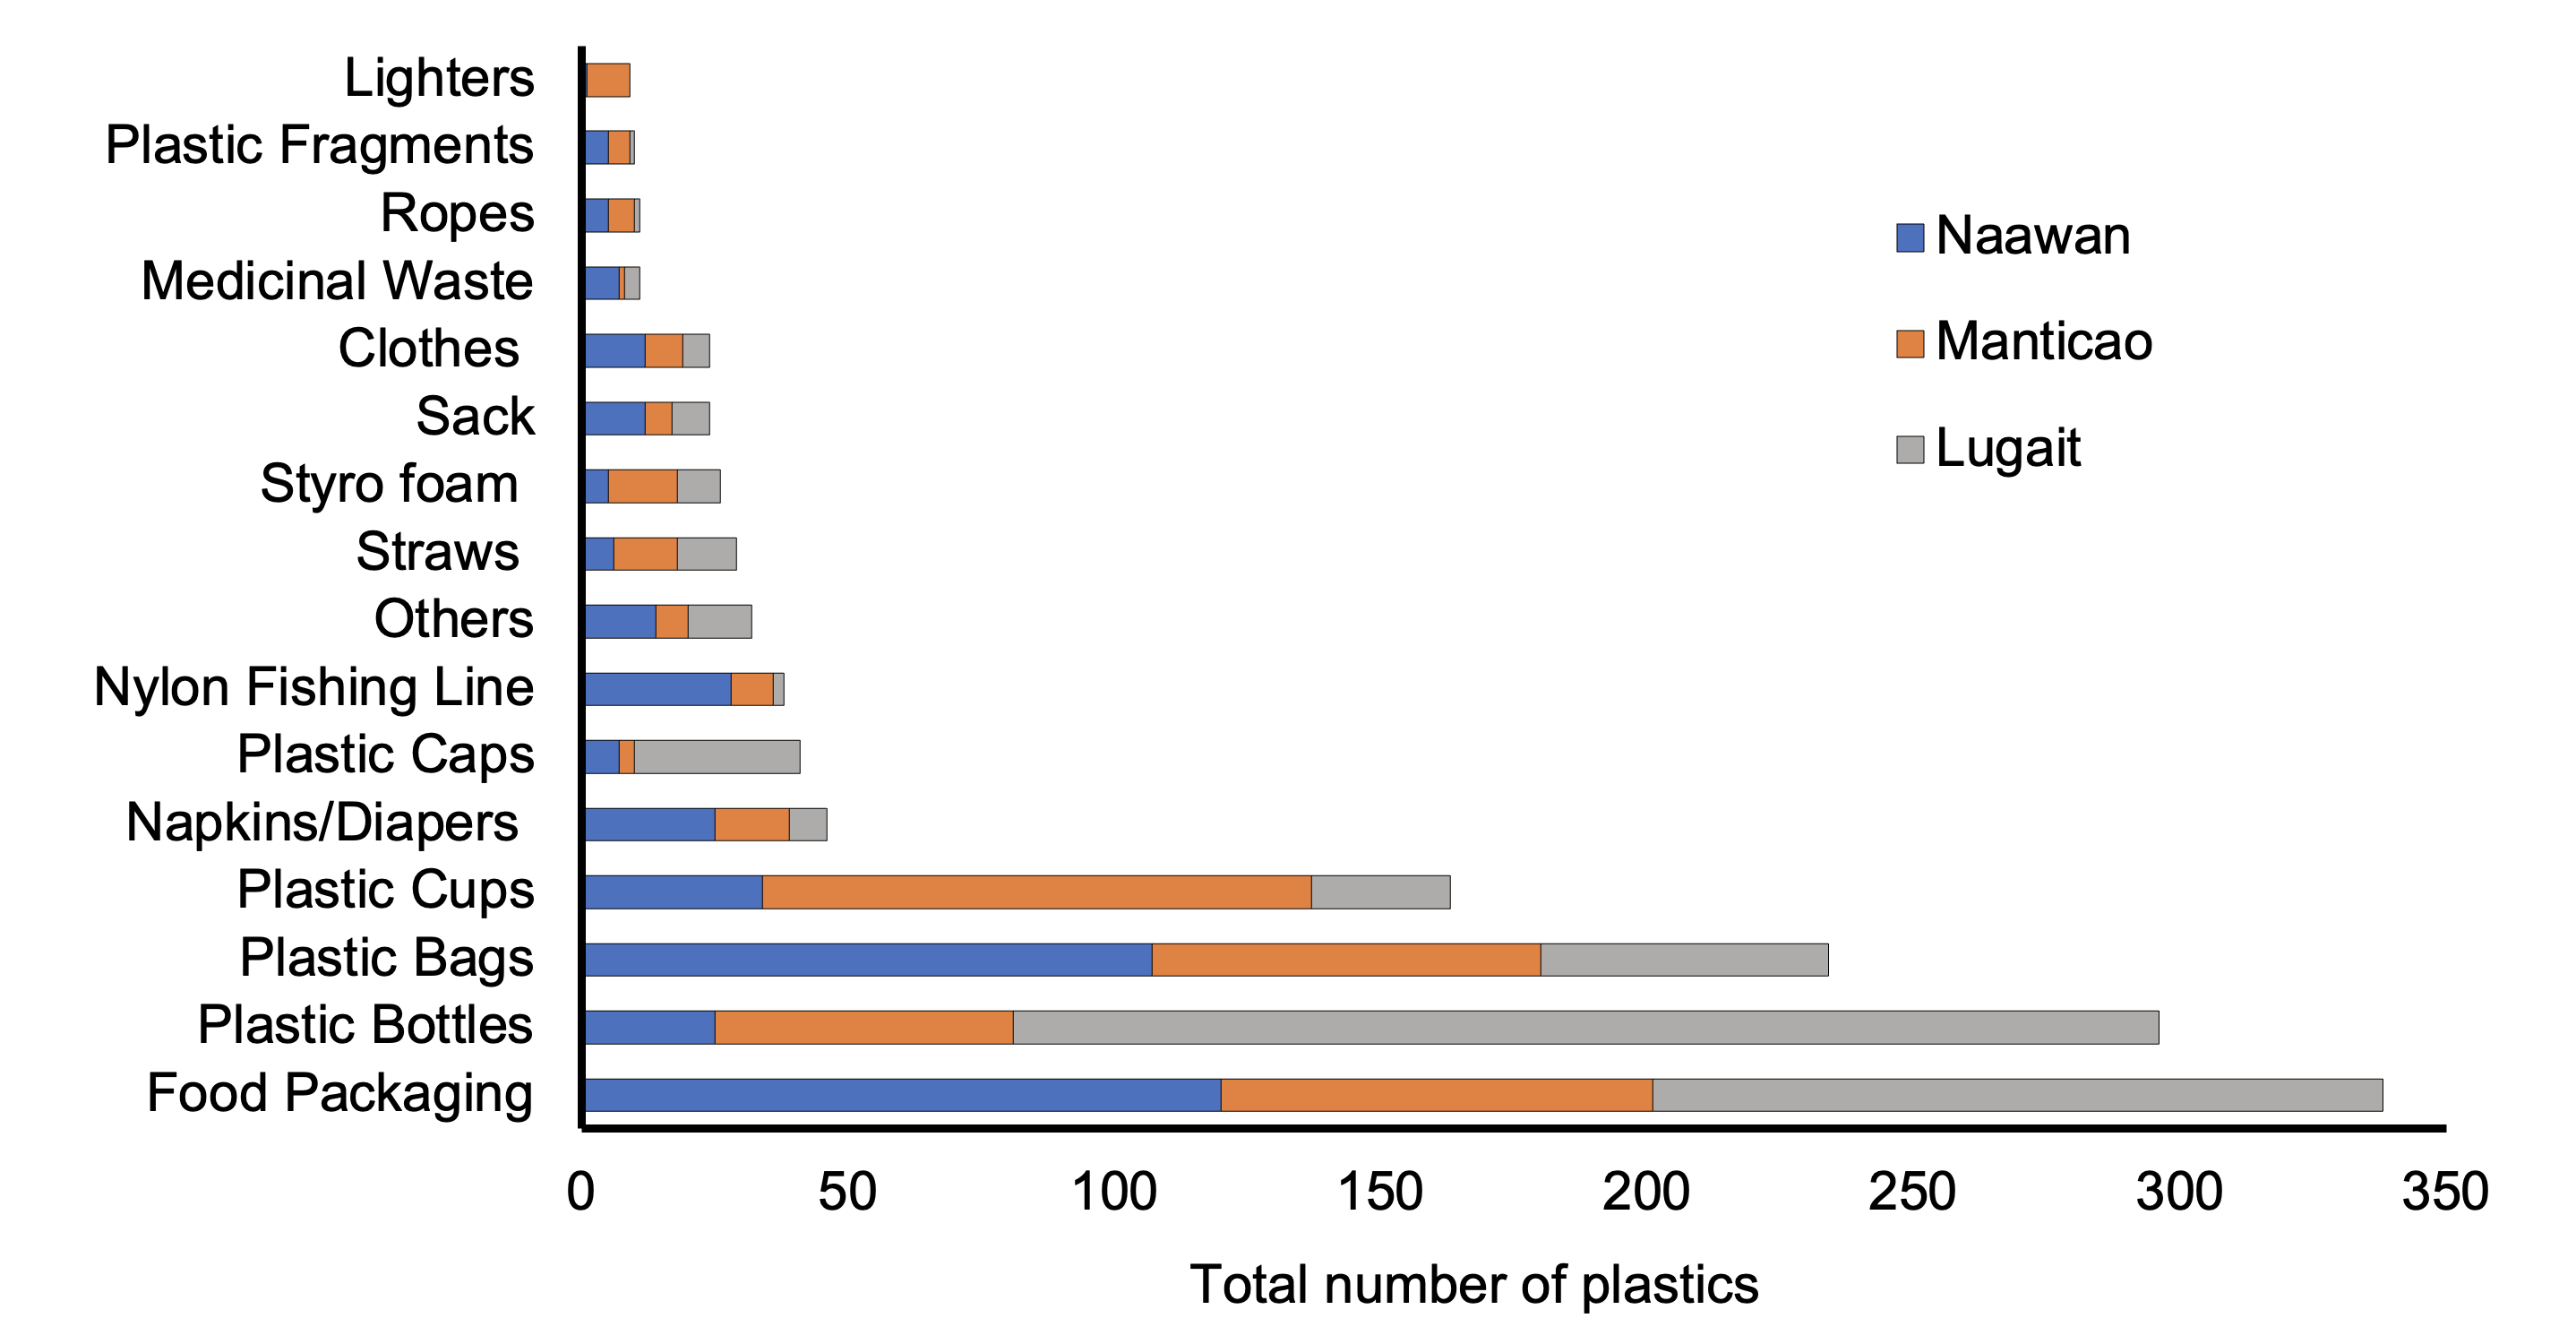
Wastes from food packaging, plastic bottles, and plastic bags were abundantly present in three sites (Figure 5). This is justified by the anecdotal report of locals on the absence of a materials recovery facility and proper waste collection in most of the sampling areas. This has resulted in open dumping, burning, and burying of waste of some residents. The absence of proper waste management and regulation in a community would often lead to the resolution of residents on dumping by convenience (Yoshioka et al., 2021). Hence, these residents’ behavior is relatively influenced by the municipal solid waste management in placed.
In the case of Lugait and Manticao, although the household wastes are collected, the collection frequency and schedule vary according to the weather conditions. On rainy seasons, such as the southwest monsoon (Habagat), the waste collection is not regular, hence the coastal community resort to burning or burying their household waste. In Naawan, solid waste collection was halted due to the local governments’ problem on the availability of municipal landfill area, hence forcing the residents to burn their waste. Nonetheless, Naawan residents expressed their desire for the resumption of municipal waste collection, indicating a positive attitude towards organized waste management practices and a recognition of the importance of regular waste collection.
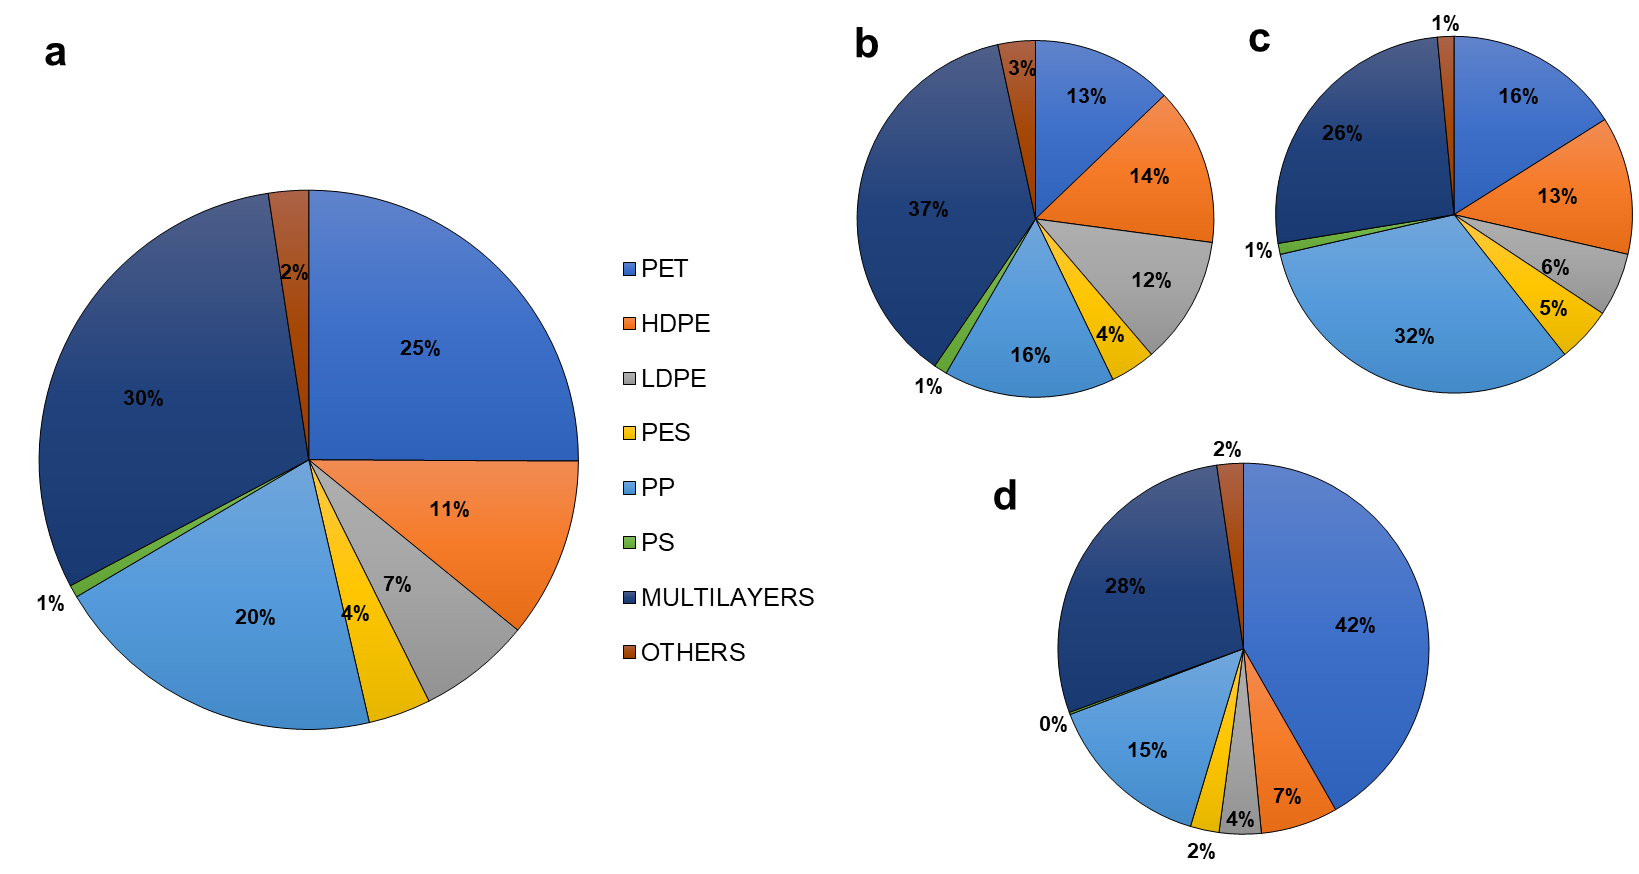
In terms of polymer composition of the collected plastics, nine polymer types were classified namely, polyethylene terephthalate (PET), high-density polyethylene (HDPE), low-density polyethylene (LDPE), polyester (PES), polypropylene (PP), polystyrene (PS), multilayers, and others (miscellaneous). Results showed that the dominant plastic waste found in all sites were multilayer plastics (30%), followed by PET (25%), and PP (20%). While the least polymer classified was PS (1%) (Figure 6). The dominance of multilayers, PET, and PP underscores the prevalence of items like sachets and food packaging in the overall plastic litter. This aligns with prior research by Inocente and Bacosa (2022), highlighting the persistence of multi-layered packaging, a common component in food packaging. These results can guide targeted waste management strategies, emphasizing the need for sustainable alternatives in packaging, particularly for items like multi-layered packaging, as well as initiatives to further extend the life cycle of PET and PP wastes by harnessing as input resource for other products, to mitigate the environmental impact of plastic pollution.
3.2 Density of Plastic Waste and Clean Coast Index
Based on the data collected, it was found that plastic waste had contaminated all sampling sites. Lugait leads the highest plastic density (1.04/m²) among the sites. Also, Lugait was classified as an extremely dirty coast among the 3 sites based on the CCI, whereas Naawan and Manticao fall under the dirty coast category (Table 3). Residential areas often exhibit a higher abundance of plastic waste compared to non-residential and other areas due to a combination of factors tied to human behaviour, consumption patterns, and waste management practices. It is expected that higher demand in consumable products in highly populated areas would result in an increased generation of plastic litter (Alabi et al., 2019), thus indicating that there is a relationship between the distribution of plastic waste and the human population. Consequently, marginalized regions consistently show this pattern as the demand for plastic sachet products is high. The findings also aligned with those of Sajorne et al. (2021), indicating that residential areas contain two to five times as much plastic compared to non-residential areas. In addition, land-based sources were also identified as the primary contributors to marine pollution, as this pollution primarily stems from the populations residing within 50-km area of the coastline (Jambeck et al., 2015).
| SITE | Total Litter Count | Total Mass (g/site) | Density/m² ± SD | CCI | Coast Grade |
|---|---|---|---|---|---|
| Naawan | 413 | 27,615 | 0.83 ± 0.12 | 16.52 | Dirty |
| Manticao | 399 | 16,750 | 0.80 ± 0.10 | 15.96 | Dirty |
| Lugait | 520 | 17,815 | 1.04 ± 0.14 | 20.80 | Extremely Dirty |
Based on the CCI, all sites were considered dirty coast primarily since all sites are residential areas. These findings are consistent with previous studies indicating that areas with high anthropogenic activity, such as densely populated cities, would result in high abundance of plastic waste (Browne et al., 2011; Arcadio et al., 2022). These findings highlight the urgent need for effective waste management, especially in residential areas with high human populations, to manage and mitigate the impact of plastic pollution on coastal environments. Addressing the issue at its source, focusing on reducing plastic consumption and improving waste management practices, could contribute to cleaner and healthier coastal ecosystems.
Using the PAST software, there is no significant difference in terms of plastic density between the 3 sampling sites since the p-value is 0.06147 (p ≥ 0.05). This is primary because all the sites were residential areas and were predominant in waste density. This was explained by Alabi et al. (2019) that as the population of a specific region increases, the need for consumable goods also rises, leading to a subsequent increase in the generation of plastic waste.
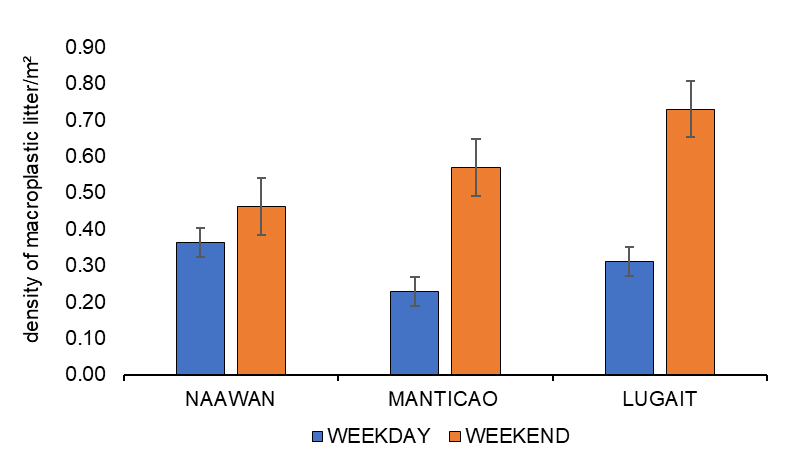
The density of the plastic waste collected was higher during the weekends compared to the weekdays (Figure 7). The t-test revealed that there is a significant difference between the plastic density of the 3 sites during weekdays and weekends with a p-value of less than 0.05 (p=0.030127). More waste is often found on shores during weekends due to increased human activity, such as recreational events and tourism. Hence, most waste collected during weekends were food packaging, plastic bottles, plastic bags, and disposable plastic cups. This was confirmed in the study by Lamb et al. (2018) that food packaging from beachgoers (i.e tourists, residents, fishermen, etc.) is the most prevalent type of macroplastics found in a variety of coastal environments. Given that beachgoers and other visitors often bring disposables for leisure activities, the abundance of plastic cups may be attributed to tourism (Santos et al., 2005; Acot et al., 2022). Weekends attract more people to beaches for leisure (i.e., picnics and parties), resulting in higher litter generation, contributing to the elevated waste levels on coastal beaches (Khadanga et al., 2022). Lack of tourists awareness on proper waste management, inadequate facilities, and the occurrence of events without planned waste management further exacerbate this problem.
3.3 Coastal Residents and Their Role in Plastic Accumulation
Findings from the focus group discussions emphasize that the daily practices, perceptions, and lived realities of coastal residents strongly shape the accumulation of macroplastics in Iligan Bay. Participants consistently identified food packaging, plastic bottles, and plastic bags as the most common household wastes, which aligns with the itemized results of the shoreline plastic assessment. Due to inconsistent or nonexistent waste collection services and the absence of operational MRFs, numerous residents reported burning or burying their waste. These practices reflect not only infrastructural gaps but also culturally embedded disposal habits that have developed over time as adaptive responses to limited waste management options and to long-standing limitations in LGU waste systems.
Residents also shared observations regarding the increase in plastic waste during heavy rainfall, monsoon seasons, and periods of heightened beach activity, such as weekends and local tourism. These community insights show how both environmental conditions and human activities contribute to the movement and buildup of plastics along the coast. Overall, the FGD results highlight the importance of community behaviors and perceptions in determining the dynamics of coastal waste, underscoring the necessity of participatory, culturally informed approaches to enhance waste management in coastal municipalities. Recognizing community experience is particularly important in coastal areas, where livelihood, daily mobility, and shoreline use are deeply intertwined with local culture. These findings emphasize that addressing macroplastic pollution requires not only infrastructure improvements but also an understanding of local cultural practices, making community engagement essential for effective and sustainable waste management interventions.
Conclusion and Recommendation
A total of 1,332 macroplastics were collected throughout the six-days sampling in the sampling sites of different municipalities along Iligan Bay. Lugait recorded 39% of the total macroplastic collected and was classified as extremely dirty according to the clean-coast index. While Naawan and Manticao has 31% and 30% total of macroplastic wastes collected, respectively, which rendered both sites a costa index grade of dirty coasts. These abundance of macroplastic wastes is associated with the prominent area classification that is residential, where the footprints of anthropogenic activities are very evident. As reflected in the collected wastes, they were primarily food packaging (25%), plastic bottles (22%), plastic bags (18%), which are categorically multilayers (30%), PET (25%), and PP (20%) in the polymer type.
The focus group discussions revealed that the abundance of plastics on the shoreline was primarily attributed to residents’ disposal practices and the current municipal solid waste management of their locality. Food wrappers, plastic bags, and plastic beverage bottles were identified as common household waste, often disposed of through burning or burying. Climatic factors (i.e., heavy rains, typhoons, and monsoons), were also identified as contributors to the increased wastes on their shorelines.
The study provides baseline status on the macroplastic litters in the different coastal areas along Iligan Bay and how this reflects the current municipal solid waste management of the area. Thus, the findings of the study inform the Local Government Units (LGUs) and may prompt them to revisit and critically evaluate their solid waste management (SWM) plans. The classification of the three coastal areas as dirty shores highlights the urgent need for a comprehensive reassessment and optimization of current waste management strategies. This study provides a robust baseline for the LGU to refine plans, implement targeted interventions, and promote sustainable practices, including a ban on single-use plastics, to mitigate plastic pollution and support environmental sustainability.
Acknowledgements
The researchers express their heartfelt gratitude to the Local Government Units (LGUs) of the Municipality of Naawan, Manticao, and Lugait for their assistance and cooperation, as well as the coastal communities within these municipalities for their participation and invaluable insights, which greatly contributed to the success of this research. They also extend their utmost gratitude to the DOST-SEI through the ASTHRDP scholarship that made this study possible. Lastly, the researchers extend their appreciation to Christine Joy Pacilan and to the Batch Envision for their unwavering support throughout the study.
Conflicts of Interest
The authors declare no conflict of interest.
References
- Abreo, N. A. S., Siblos, S. K., Macusi, D., 2020. Anthropogenic marine debris (AMD) in mangrove forests of Pujada Bay, Davao Oriental, Philippines. Journal of Marine and Island Cultures, 9(1), 34-48. doi: 10.21463/jmic.2020.09.1.03
- Acot, F., Sajorne, R., Omar, N., Suson, P., Rallos, L., Bacosa, H., 2022. Unraveling macroplastic pollution in rural and urban beaches in Sarangani Bay Protected Seascape, Mindanao, Philippines. Journal of Marine Science and Engineering, 10(10), 1532. https://doi.org/10.3390/jmse10101532
- Alabi, O.A., Ologbonjaye, K.I., Awosolu, O., Alalade, O.E., 2019. Public and environmental health effects of plastic wastes disposal: a review. Journal of Toxicology and Risk Assessment 5 (2), 1–13. doi: 10.23937/2572-4061.1510021.
- Alkalay, R., Pasternak, G., Zask, A., 2007. Clean-coast index; a new approach for beach cleanliness assessment. Ocean Coastal Management, 50, 352-362. doi: 10.1016/j.ocecoaman.2006.10.002
- Alrawahi, S., Sellgren, S. F., Altouby, S., Alwahaibi, N., Brommels, M., 2020. The application of Herzberg’s two-factor theory of motivation to job satisfaction in clinical laboratories in Omani hospitals. Heliyon, 6(9), e04829. doi:10.1016/j.heliyon.2020.e04829.
- Ang, Z., & Massingham, P., 2007. National culture and the standardization versus adaptation of knowledge management. Journal of Knowledge Management, 11(2), 5–21. https://doi.org/10.1108/13673270710738889
- Arcadio, C.K., Similatan, K., Inocente, S., Ancla, S., Banda, M.H., Capangpangan, R., Torres, A., Bacosa, H., 2022. Microplastics in surface water of Laguna de Bay: first documented evidence on the largest lake in the Philippines. Environmental Science and Pollution Research, 30(11), 29824–29833. https://doi.org/10.1007/s11356-022-24261-5
- Barboza, L. G. A., Cózar, A., Gimenez, B. C. G., Barros, T. L., Kershaw, P., Guilhermino, L., 2019. Macroplastics pollution in the marine environment. In Elsevier eBooks (pp. 305–328). https://doi.org/10.1016/b978-0-12-805052-1.00019-x
- Barnes, D. K. A., Galgani, F., Thompson, R. C., Barlaz, M., 2009. Accumulation and fragmentation of plastic debris in global environments. Philosophical Transactions of the Royal Society B Biological Sciences, 364(1526), 1985–1998. https://doi.org/10.1098/rstb.2008.0205
- BFAR., 2021. Philippine fisheries profile 2020. Retrieved from: https://www.bfar.da.gov.ph/wp-content/uploads/2022/02/2020-Fisheries-Profile-Final.pdf
- Birt, L., Scott, S., Cavers, D., Campbell, C., Walter, F., 2016. Member checking: A tool to enhance trustworthiness or merely a nod to valida-tion? Qualitative Health Research, 26(13), 1802–1811. https://doi.org/10.1177/1049732316654870
- Browne, M. A., Crump, P., Niven, S. J., Teuten, E., Tonkin, A., Galloway, T., Thompson, R., 2011. Accumulation of microplastic on shorelines Woldwide: sources and sinks. Environmental Science & Technology, 45(21), 9175–9179. https://doi.org/10.1021/es201811s
- Browne, M. A., Niven, S. J., Galloway, T. S., Rowland, S. J., Thompson, R. C., 2013. Microplastic moves pollutants and additives to worms, reducing functions linked to health and biodiversity. Current Biology, 23(23), 2388–2392. https://doi.org/10.1016/j.cub.2013.10.012
- Díaz-Mendoza, C., Mouthon-Bello, J., Pérez-Herrera, N. L., Escobar-Díaz, S. M., 2020. Plastics and microplastics, effects on marine coastal areas: a review. Environmental Science and Pollution Research International, 27(32), 39913–39922. https://doi.org/10.1007/s11356-020-10394-y
- Emmerik, T., 2021. Macroplastic research in an era of microplastic. Microplastics and Nanoplastics, 1(1). https://doi.org/10.1186/s43591-021-00003-1
- Esquinas, G.G.M.S., Mantala, A.P., Atilano, M.G., Apugan, R.P., Galarpe, V.R.K.R., 2020. Physical characterization of litter and microplastic along the urban coast of Cagayan de Oro in Macajalar Bay,Philippines. Mar. Pollut. Bull. 154, 111083 https://doi.org/ 10.1016/j.marpolbul.2020.111083.
- Fernando, M. D., 2015. Sachets in the Philippine context. The Catholic Economist. https://thecatholiceconomistphilippines.wordpress.com/2015/07/08/sachets-in-the-philippine-context/.
- Gaboy, S.M., Guihawan, J., Leopardas, V., Bacosa, H., 2022. Unravelling macroplastic pollution in seagrass beds of Iligan City, Mindanao, Philippines. Marine Pollution Bulletin, 185, 114233. https://doi.org/10.1016/j.marpolbul.2022.114233
- Galarpe, K.R., Kalnasa, M.L., Lantaca, S.M.O., Boter, L.C., Flores, G.H.T., 2019. Occurrence of surface sand microplastic and litter in Macajalar Bay, Philippines. Marine Pollution Bulletin, 149, 110521. doi:10.1016/j.marpolbul.2019.110521.
- GESAMP, 2016. Sources, fate and effects of microplastics in the marine environment: part two of a global assessment. (Kershaw, P.J., and Rochman, C.M., eds). (IMO/FAO/UNESCO-IOC/UNIDO/WMO/IAEA/UN/UNEP/UNDP Joint Group of Experts on the Scientific Aspects of Marine Environmental Protection). Rep. Stud. GESAMP No. 93, 220 p.
- Hammer, Ø., Harper, D., Ryan, P., 2001. PAST: Paleontological Statistics Software Package for Education and Data Analysis. Palaeontologia Electronica. Palaeontological Association, 22 June 2001.
- Horton, A. A., & Barnes, D. K., 2020. Microplastic pollution in a rapidly changing world: Implications for remote and vulnerable marine ecosystems. The Science of the Total Environment, 738, 140349. https://doi.org/10.1016/j.scitotenv.2020.140349
- Horton, A. A., Walton, A., Spurgeon, D. J., Lahive, E., Svendsen, C., 2017. Microplastics in freshwater and terrestrial environments: Evaluating the current understanding to identify the knowledge gaps and future research priorities. Science of the Total Environment, 586, 127–141. https://doi.org/10.1016/j.scitotenv.2017.01.190
- Inocente, S.A., & Bacosa, H.P., 2022. Prevalence of microplastic pollution on selected tourism beaches of Barobo, Surigao del Sur, Philippines. J. Mar. Island Cult. 11 (1) https://doi.org/10.21463/jmic.2022.11.1.14.
- Jambeck, J., Geyer, R., Wilcox, C., Siegler, T. R., Perryman, M. E., Andrady, A. L., Narayan, R., Law, K. L., 2015. Plastic waste inputs from land into the ocean. Science, 347(6223), 768–771. https://doi.org/10.1126/science.1260352
- Jimenez, C., Molina, D., Garcia, J., Quiñones, M., De La Rosa, H. K., Samson, J., Paghasian, M., 2020. Species Composition, Abundance, and Catch Trends of Roundscads Decapterus spp. in Iligan Bay, Northern Mindanao, Philippines. Journal of Environment and Aquatic Resources, 5. https://doi.org/10.48031/msunjear.2020.05.03
- Kalnasa, M.L., Lantaca, S.M.O., Boter, L.C., Flores, G.J.T., Galarpe, V.R.K.R., 2020. Occurrence of surface sand microplastic and litter in Macajalar Bay, Philippines. Mar. Pollut. Bull. 149, 110521 https://doi.org/10.1016/j.marpolbul.2019.110521.
- Khadanga M. K., Behera A. K., Swain G. K., Dora D. P., Padhi C. P., Mishra R. K., Pradhan S., Barik S., Mohanty P. K., Mishra P., Patro S., 2022. Evaluation of the status of marine plastic pollution along a tourist beach of Bay of Bengal during lockdown and post lockdown. Marine Pollution Bulletin, 182, 113970. https://doi.org/10.1016/j.marpolbul.2022.113970.
- Martins, J., & Sobral, P., 2011. Plastic marine debris on the Portuguese coastline: A matter of size? Marine Pollution Bulletin, 62(12), 2649–2653. https://doi.org/10.1016/j.marpolbul.2011.09.028
- Lahens, L., Strady, E., Kieu-Le, T.C., Dris R, Boukerma, K., Rinnert, E., Gasperi, J., Tassin, B., 2018. Macroplastic and microplastic contamination assessment of a tropical river (Saigon River, Vietnam) transversed by a developing megacity. Environ Pollut. 2018 May;236:661-671. doi: 10.1016/j.envpol.2018.02.005. PMID: 29438952.
- Lamb J., Willis B., Fiorenza E., Couch C., Howard R., Rader D., True J., Kelly L. A., Ahmad A., Jompa J., Harvell C. D., 2018. Plastic waste associated with disease on coral reefs. Science, 359, 460–462. https://doi.org/10.1126/science.aar3320
- Lazar, J., Feng, J. H., Hochheiser, H., 2017. Interviews and focus groups. Research Methods in Human Computer Interaction, 187–228. doi:10.1016/b978-0-12-805390-4.00008-x.
- Lebreton, L., Egger, M., Slat, B., 2019. A global mass budget for positively buoyant macroplastic debris in the ocean. Scientific Reports, 9(1), 12922. https://doi.org/10.1038/s41598-019-49413-5
- Lebreton, L., Van Der Zwet, J., Damsteeg, J. W., Slat, B., Andrady, A. L., Reisser, J., 2017. River plastic emissions to the world’s oceans. Nature Communications, 8(1). https://doi.org/10.1038/ncomms15611.
- Lechthaler, S., Waldschlager, K., Stauch, G., Schüttrumpf, H., 2020. The way of macroplastic through the environment. Environments 7 (10), 73. https://doi.org/10.3390/environments7100073.
- Lippiatt, S., Opfer, S., Arthur, C., 2013. Marine debris monitoring and assessment. NOAA Technical Memorandum NOS-OR&R-46.
- Li, Y., Zhang, H., Tang, C., 2020. A review of possible pathways of marine microplastics transport in the ocean. Anthropocene Coasts, 3(1), 6–13. https://doi.org/10.1139/anc-2018-0030
- Pinnell, L. J., & Turner, J. W., 2020. Temporal changes in water temperature and salinity drive the formation of a reversible plastic-specific microbial community. FEMS Microbiology Ecology, 96(12). https://doi.org/10.1093/femsec/fiaa230
- Pacilan, C. J. M., & Bacosa, H. P., 2022. Assessment of macroplastic litter on the coastal seabeds of Sultan Naga Dimaporo, Lanao del Norte, Philippines. Journal of Marine and Island Cultures, 11(2). https://doi.org/10.21463/jmic.2022.11.2.02.
- Paler, M.K.O., Malenab, M.C.T., Maralit, J.R., Nacorda, H.M., 2019. Plastic waste occurrence on a beach off southwestern Luzon, Philippines. Mar. Pollut. Bull. 141, 416–419. https://doi.org/10.1016/j.marpolbul.2019.02.0.
- Philippine Atmospheric Geophysical Astronomical Services Administration (PAGASA), 2021. Climate of the Philippines. http://bagong.pagasa.dost.gov.ph/information/climate-philippines (Accessed: 27 Jul 2021)
- Plantado, L., Malto, M., Bantigue1, J., Baleta, F., 2023. Characterization and Distribution of macroplastics along the Coastal Municipalities of Partido District, Camarines Sur. https://papers.ssrn.com/sol3/papers.cfm?abstract_id=4496281.
- Posadas, D., 2014. Sachets help low-income communities but are a waste nightmare. The Guardian. https://www.theguardian.com/sustainable-business/sachet-packaging-low-income-communities-waste-nightmare.
- Provencher, J., Borrelle, S., Bond, A., Lavers, J., Van Franeker, J., Kühn, S., Hammer, S., Avery-Gomm, S., Mallory, M., 2019. Recommended best practices for plastic and litter ingestion studies in marine birds: Collection, processing, and reporting. FACETS. 4. 111-130. https://doi.org/10.1139/facets-2018-0043
- Requiron, J. C., & Bacosa, H., 2022. Macroplastic transport and deposition in the environs of Pulauan River, Dapitan City, Philippines. The Philippine Journal of Science, 151(3). https://doi.org/10.56899/151.03.33
- Ritchie, H., & Roser, M., 2019. Plastic pollution. Our World in Data. https://ourworldindata.org/plastic-pollution.
- Rosa, H. K. D., Quiñones, M., Jimenez, C., Garcia, J., Molina, D., Samson, J., Paghasian, M., 2022. First Report on the Reproductive Biology of the Redtail Scad Decapterus kurroides Bleeker, 1855 in Iligan Bay, Southern Philippines. The Philippine Journal of Fisheries, 193–208. https://doi.org/10.31398/tpjf/29.2.2022-0024.
- Sajorne, R. E., Bacosa, H. P., Cayabo, G. D. B., Ardines, L. B., Sumeldan, J. D., Omar, J. M., Creencia, L. A., 2021. Plastic litter pollution along sandy beaches in Puerto Princesa, Palawan Island, Philippines. Marine Pollution Bulletin, 169, 112520. https://doi.org/10.1016/j.marpolbul.2021.112520
- Santos, I.R., Friedrich, A.C., Wallner-Kersanach, M., Fillmann, G., 2005. Influence of socio-economic characteristics of beach users on litter generation. Ocean & Coastal Management, 48(9–10), 742–752. https://doi.org/10.1016/j.ocecoaman.2005.08.006
- Singh, N. R., & Khatri, N. G., 2022. Impact and Solution of Marine Plastic Pollution: A review. International Journal of Advanced Research in Science, Communication and Technology, 813–820. https://doi.org/10.48175/ijarsct-3513
- Skliris, N., Zika, J. D., Nurser, G., Josey, S. A., Marsh, R., 2016. Global water cycle amplifying at less than the Clausius-Clapeyron rate. Scientific Reports, 6(1), 38752. https://doi.org/10.1038/srep38752
- Su, L., Xue, Y., Li, L., Yang, D., Kolandhasamy, P., Li, D., Shi, H., 2016. Microplastics in Taihu Lake, China. Environmental Pollution, 216, 711–719. https://doi.org/10.1016/j.envpol.2016.06.036
- Superio, M. D., Superio, A., Abreo, N. A. S., Abreo, S., 2020. Plastic in Freshwater Ecosytems: A looming crisis in the Philippines. ResearchGate. https://www.researchgate.net/publication/339029548
- Syakti, A.D., Bouhroum, R., Hidayati, N.V., Koenawan, C.J., Boulkamh, A., Sulisyo, I., Lebarillier, S., Akhulus, S., Doumeq, P., Wong-Wah-Chung, P., 2017. Beach macrolitter monitoring and floating microplastc in a coastal area of Indonesia. Marine Pollution Bulletin 122 (1-2), 217-225. doi:10.1016/j.marpolbul.2017.06.046
- Philippines Statistics Authority (PSA)., 2020. Census of Population and Housing Population Counts Declared Official by the President. Region X. Reference Number: 2021-251
- Vlachogianni, T., Fortibuoni, T., Ronchi, F., Zeri, C., Mazziotti, C., Tutman, P., Varezić, D. B., Palatinus, A., Trdan, Š., Peterlin, M., Mandić, M., Markovic, O., Prvan, M., Kaberi, H., Prevenios, M., Kolitari, J., Kroqi, G., Fusco, M., Kalampokis, E., Scoullos, M., 2018. Marine litter on the beaches of the Adriatic and Ionian Seas: An assessment of their abundance, composition and sources. Marine Pollution Bulletin, 131(Pt A), 745–756. https://doi.org/10.1016/j.marpolbul.2018.05.006
- Winton, D. J., Anderson, L. G., Rocliffe, S., Loiselle, S., 2020. Macroplastic Pollution in Freshwater Environments: Focusing Public and Policy Action. Science of the Total Environment, 704, 135242. https://doi.org/10.1016/j.scitotenv.2019.135242
- World Bank Group, 2023. Market Study for Philippines: Plastics Circularity Opportunities and Barriers. In World Bank. https://www.worldbank.org/en/country/philippines/publication/market-study-for-philippines-plastics-circularity-opportunities-and-barriers-report-landing-page
- Xu, L., Cao, L., Huang, W., Liu, J., Dou, S., 2021. Assessment of plastic pollution in the Bohai Sea: Abundance, distribution, morphological characteristics and chemical components. Environmental Pollution, 278, 116874. https://doi.org/10.1016/j.envpol.2021.116874
- Yoshioka, N., Era, M., Sasaki, D., 2021. Towards integration of climate disaster risk and waste management: A case study of urban and rural coastal communities in the Philippines. Sustainability, 13(4), 1624. https://doi.org/10.3390/su13041624
- Zhang, J., Quoquab, F., Mohammad, J., 2023. What Do We Know About Plastic Pollution in Coastal/Marine Tourism? Documenting Its Present Research Status from 1999 to 2022. SAGE Open, 13(4). https://doi.org/10.1177/21582440231211706