Importance of Biotic and Soil Factors in Determining the Distribution Strategies of Coastal Salt Marsh Plants
Department of Biological Science, Mokpo National University, Korea
Department of Biology, Kunsan National University, Korea
Department of Biological Science, Mokpo National University, Korea
Korea Environmental Technology Consulting Hotline, Korea
Institution for Marine and Island Cultures, Mokpo National University, Korea
Division of Ecosystem Research, National Park Research Institute, Korea
Division of Ecological Assessment, National Institute of Ecology, Korea
Jeollanam-do Environmental Industries Promotion Institute Gangjin, Korea
Jeollanam-do Environmental Industries Promotion Institute Gangjin, Korea
Department of Computer Science, Shingyeong University, Korea
Department of Biological Science, Mokpo National University, Korea keco@mokpo.ac.kr
Abstract
The distribution of plant communities in the salt marshes of the southwestern coasts of South Korea was studied, along with environmental or plant factors, by canonical correspondence analysis (CCA) and the competitor (C), stress tolerator (S), and ruderal (R) (CSR) ecological strategies. The coastal salt-marsh plants were classified into three plant-factor groups in the CCA biplot diagram. Group 1 was correlated with LS and FP. Group 2 was correlated with CH and SLA, and Group 3 was correlated with LA, LDMC and LDW. The salt-marsh plants were classified into four soil-factor groups in the CCA biplot diagram. First, the group factor was correlated with TN, TOC, and Ca2+. Second, the group factor was distributed according to Mg2+, soil texture as Clay and Silt. Third, the group factor was distributed according to Salinity and Na+ content. Fourth, the group factor was distributed according to Sand content. To clarify the relative significance of competition, stress, and disturbance in the distribution process of plant communities, the CSR distribution model was adopted. The nine species showed CR (competitor-ruderal) strategies: Artemisia fukudo, Artemisia scoparis, Aster tripolium, Atriplex gmelinii, Imperata cylindrica var. koenigii, Salicornia europaea, Suaeda japonica, and Suaeda maritima. The four species with C (competitor) strategies were Artemisia capillaris, Limonium tetragonum, Triglochin maritimum, and Zoysia sinica. Carex scabrifolia and Phragmites communis displayed SC (stress-tolerant-competitor). Both distribution patterns of the CCA diagrams and CSR triangles may provide a useful scientific basis for protecting and restoring salt marshes and their valuable ecosystem services, considering the increasing disturbances.
Keywords
salt-marsh plants, plant and soil factor, CCA analysis, CSR strategy
Introduction
In controlling the distribution of coastal plants, the chemical, physical and biological factors of soil are all believed to play major roles (Ihm and Lee 1998). Because of their transitional situation between sea and terrestrial ecosystems, the southwestern coastal wetlands of South Korea include various habitats, such as salt marshes, salt swamps, and sand dunes (Ihm et al. 2007; Lee and Kim 2018). In many multivariate analyses of coastal wetlands in South Korea, plant communities are arranged along gradients for either soil texture and water potential or soil moisture and soil pH (Lee and Ihm 2004; Shim et al. 2009; Kim et al. 2010). Understanding how global salt marsh plant distribution is caused by abiotic and biotic factors is essential for successful conservation plans in the face of ongoing environmental change (Bertness and Shumway 1993; Bertness and Callaway 1994; Bertness and Hacker 1994; Ihm et al. 2007; Alvarez-Rogel 2007; Kim 2011; Lee and Kim 2018). If the physical and chemical factors of the soil are important attributes conferring a stable distribution, then any perturbations that leave those characteristics relatively unchanged should have little effect on the salt marsh (Pomeroy and Wiegert 1981; Woerner and Hackney 1997; Cho et al. 2017). In general, this seems to be the case, because long-term permanent change in the pattern of tidal flow does affect the vegetation and also the chemical and physical factors of the soil. The frequency of flooding is more important than elevation in predicting marsh-plant zones. Studies done to date indicate that redox potential, ionic composition and moisture content of soil, and latitude, topographical, and climatic factors may play some role in forming vegetation distribution.
Evidence for stable distribution as the result of biological factors or interactions in the salt marshes is more elusive (Pomeroy and Wiegert 1981; Tessier et al 2003; Silander and Antonovics 1982). Spartina does have a large biomass of roots and rhizomes and thus has a relatively slow turnover. In fact, the biomass of these reserves is greatest in the high marsh, where potential limits imposed by lack of nutrients are most common. Competition and facilitation are important in mediating zonation, and the importance of facilitation of plant growth increases with increasing physical stress within the abiotic range limits. A refined understanding of facilitation along stress gradients would help inform successful restoration and management of vegetation. In the salt-marsh plant community, a trade-off between belowground competitive ability and the ability to tolerate physical stressors appears to drive plant distribution patterns across the landscape.
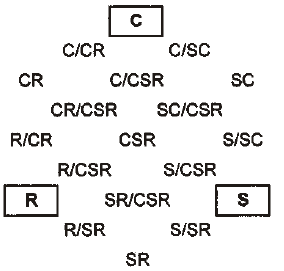
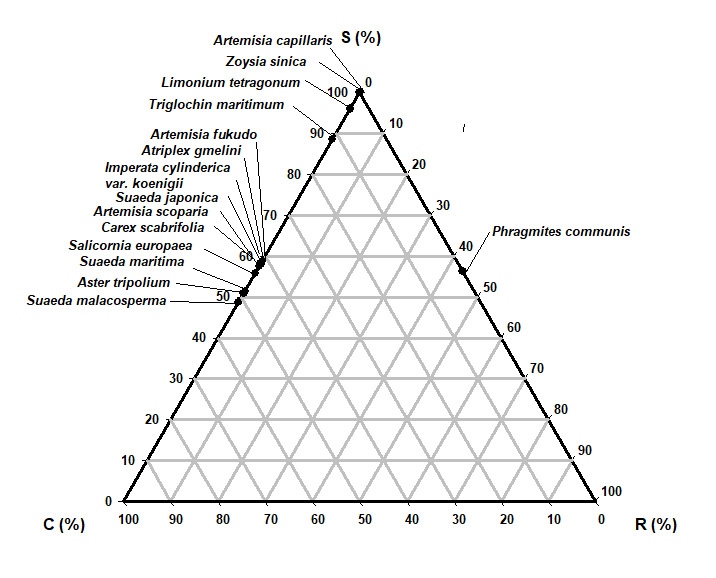
Grime (1974) postulated that typical species of three environmental extremes possess distinct factors: competition (C), stress tolerance (S), and ruderal (R). Species position can be plotted in a triangular diagram to indicate their relative importance. Grime (2002), Hodgson et al. (1999), Pierce et al. (2007), and Negreiros et al. (2014) reported that a competitor-ruderal strategy occurred in habitats disturbed by ruderality (a plant's ability to survive in disturbed conditions) and competition. The ratio of ruderalism reflects the dominant disturbance intensity in different habitats. Coastal salt-marsh plant strategies can change from CR to C because of changes from competitor-ruderal to competitor [refer to the location of Fig. 4 (Hodgson et al. 1999)]. Competition also affects the niche differentiation of plant species. More intense disturbance increased functional diversity and species diversity and inhibited dominant stress-tolerator plants. CR plants require rich soil nutrients and, as perennial, biennial or annual plants, can adapt and survive in coastal salt-marsh habitats.
Our research objectives were as follows.
- We expected that in coastal salt marshes, plants would be classified by disturbance- or stress-tolerant and competition-related variables, and that a higher proportion of the strategies would be near the competition corner of the triangle (ie., CR, C, and SC).
- Since coastal salt-marsh plant communities have distinct soil environmental features (salinity, pH, etc.), we expected that these differences would show distinct functional strategies and features in Canonical Correspondence Analysis (CCA) Ordinations.
- We expected that the results in this study would show the relative importance of plant species distribution in CCA ordinations and C, S, and R strategies in coastal salt marshes.
Methods
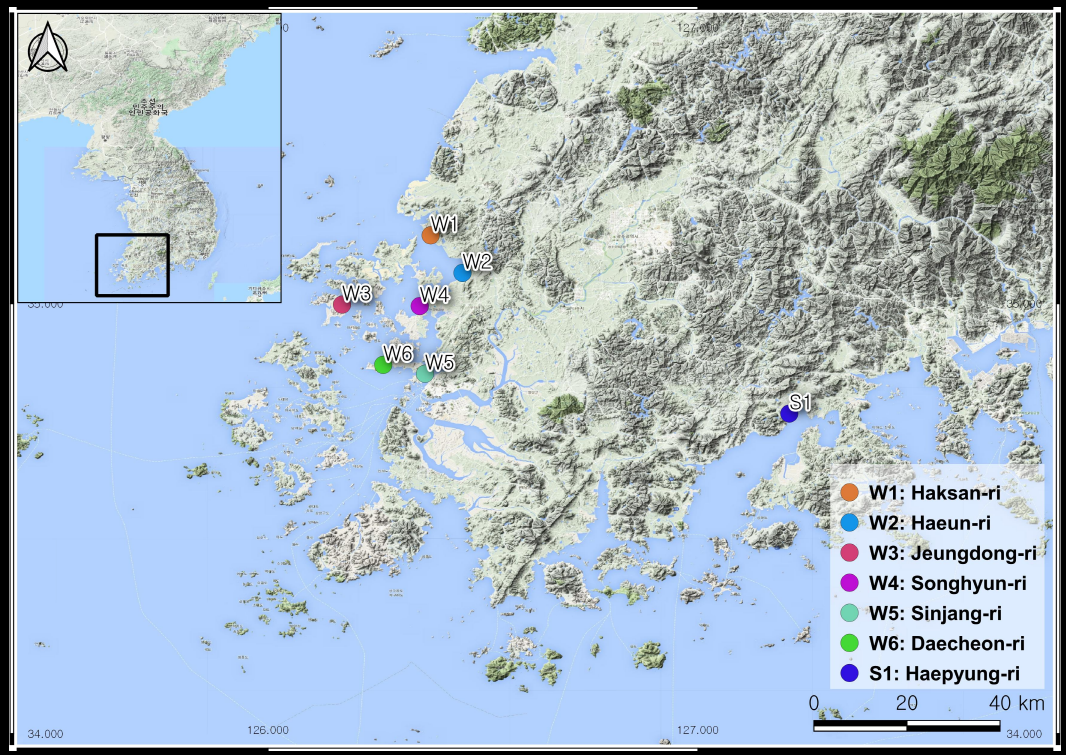
We examined several soil environment and plant factors and analyzed them for halophyte distributions of the coastal salt marshes of South Korea (Fig. 1).
Study area
Fifteen salt-marsh plant communities were sampled from the west coast to the south coast of South Korea (Fig. 1). The banks of salt marshes were constructed in the study areas. We observed: six west salt marshes and one south salt marsh. The habitat disturbance and status of the study sites are included in Table 1.
| Abbreviation | Local Name of sand dunes | Latitude | Longitude | Habitat status | Dominant community |
|---|---|---|---|---|---|
| W1 | Haksan-ri | N 35º 09’ 33.4” | E 126º 22’ 41.9” | Nondisturbed and protected | Suaeda japonica |
| W2 | Haeun-ri | N 35º 04’ 18.7” | E 126º 27’ 08.5” | Disturbed | Phragmites communis |
| W3 | Jeungdong-ri | N 34º 59’ 53.1” | E 126º 10’ 19.7” | Protected and nondisturbed | Imperata cylindrica var. koenigii |
| W4 | Songhyun-ri | N 34º 59’ 41.0” | E 126º 21’ 10.2” | Nondisturbed | Suaeda maritima |
| W5 | Sinjang-ri | N 34º 50’ 14.4” | E 126º 21’ 54.6” | Beach and disturbed | Artemisia scoparis |
| W6 | Daecheon-ri | N 34º 51’ 28.8” | E 126º 16’ 04.6” | Disturbed and roadside | Aster tripolium |
| S1 | Haepyung-ri | N 34º 44’ 40.9” | E 127º 12’ 45.0” | Nondisturbed and protected | Carex scabrifolia |
Plant research by species
We did Canonical Correspondence Analysis (CCA) and he competitor (C), stress tolerator (S), and ruderal (R) (CSR) ecological strategies on 15 species (1 x 1m2 quadtat, 3 replicates per species) and 19 communities of salt-marsh plants from seven areas July–September 2019 (Table 1). The seven areas and species in them were Haksan-ri, Zoysia sinica (Seaside lawngrass); Limonium tetragonum (Square-stem statice); Suaeda japonica (East Asian seepweed); Suaeda maritima (Herbaceous seepweed); Haeun-ri, Suaeda malacosperma (Brackish zone seepweed); Artemisia fukudo (Asian coastal wormwood); L. tetragonum and Phragmatis communis (Common reed); Jeungdong-ri, Salicornia europaea (Marshfire glasswort); Imperata cylindrica var. koenigii (Blady grass) ; and Artemisia capillaris (Capillary wormwood); Songhyun-ri, S. maritima and Triglochin maritimum (Sea arrowgrass); Sinjang-ri, Artemisia scoparia (Virgate wormwood) and Carex scabrifolia (Scabrous-leaf sedge); Daecheon-ri, Aster tripolium (Seashore aster); Haepyung-ri, Atriplex gmelinii (Gmelin’s saltbush); C, scabrifolia and A. fukudo.
Soil analysis
We examined the soil environment near the roots at a depth of 15 cm. Air-dried samples (3 replicates per each species) were used for physicochemical analysis (Lee et al. 2020) (Table 4). Soil particle sizes, salinity, total nitrogen, total organic carbon, Na+, Mg2+, Ca2+, and K+ were determined by each analyser.
Plant trait analysis
We analyzed several plant factors (Hodgson et al. 1999; Pierce et al. 2013; Lee et al. 2020) (Table 2). The coverage (%), canopy height (CH, mm), lateral spread (LS, mm), leaf area (LA, mm2), leaf dry weight (LDW, mg), leaf dry weight/water-saturated fresh mass (LDMC, %), specific leaf area (SLA, mm2mg-1), flowering period (FP), and flowering start (FS) were measured. We selected a total of 15 shrub and herbaceous species for the measurements of plant functional factors.
| Variable | Definition | |||
|---|---|---|---|---|
| CanopyHeight | Six-point classification | 1 | 1–49 mm | |
| 2 | 50–99 mm | |||
| 3 | 100–299 mm | |||
| 4 | 300–599 mm | |||
| 5 | 600–999 mm | |||
| 6 | >999 mm | |||
| DryMatterContent | Mean of percent dry matter content in the largest, fully hydrated, fully expanded leaves (%) | |||
| FloweringPeriod | Normal duration of flowering period (months) | |||
| FloweringStart | Six-point classification | 1 | First flowering in March or earlier | |
| 2 | in April | |||
| 3 | in May | |||
| 4 | in June | |||
| 5 | in July | |||
| 6 | in August or later, or before leaves in spring | |||
| LateralSpread | Six-point classification | 1 | Plant short-lived | |
| 2 | Loose tufted ramets radiating about a single axis, no thickened rootstock | in graminoids | ||
| 2 | Compactly tufed about a single axis, no thickened rootstock | in non-graminoids | ||
| 3 | Compactly tufed ramets appressed to each other at base | in graminoids | ||
| 3 | Compactly tufed about a single axis, thickened rootstock present | in non-graminoids | ||
| 4 | Shortly creeping, <40 mm between ramets | |||
| 5 | Creeping, 40–79 mm between ramets | |||
| 6 | Widely creeping, >79 mm between ramets | |||
| LeafDryWeight | Natural logarithm of mean dry weight in the largest, fully hydrated, fully expanded leaves (mg), plus 3 | |||
| SpecificLeafArea | Mean of area/dry weight quotient in the largest, hydrated, fully expanded leaves (mm2/mg) | |||
Statistical analyses
Significance of differences in plant factors (Table 3) and in soil factors (Table 4) among the samples were tested with one-way ANOVA. We did CCA analyses of soil factors and plant factors by using CANOCO 5.1 (Ter Braak 1986; Ter Braak and Smilauer 2018; Lee et al. 2020). The CSR strategies were chosen using plant functional factors and the triangular diagrams generated according to Hodgson et al. (1999) and Pierce et al. (2013), using SigmaPlot 13 (www.sigmaplot.com).
| Canopy height (mm) | Leaf dry matter content (%) | Flowering period (# of months) | Lateral spread (six-point model) | Leaf dry weight (mg) | Specific leaf area (mm2 mg-1) | Flowering start (month) | |
|---|---|---|---|---|---|---|---|
| Means | 380 | 18 | 2 | 2 | 784 | 2 | 5 |
| SD | 215 | 13 | 0 | 1 | 982 | 2 | 1 |
| N | 15 | 15 | 15 | 15 | 15 | 15 | 15 |
| MAX | 700 | 44 | 3 | 3 | 3840 | 8 | 6 |
| MIN | 150 | 6 | 2 | 1 | 97 | 0 | 3 |
| Range | 550 | 37 | 1 | 2 | 3743 | 7 | 3 |
| Salinity (psu) | T-N (mg/kg) | TOC (%) | Ca2+ (cmol/kg) | K+ (cmol/kg) | Mg2+ (cmol/kg) | Na+ (cmol/kg) | Sand (%) | Silt (%) | Clay (%) | |
|---|---|---|---|---|---|---|---|---|---|---|
| Means | 1.025 | 526.0 | 0.945 | 75.556 | 31.172 | 45.587 | 159.6 | 93.7 | 3.713 | 2.543 |
| SD | 1.037 | 331.8 | 0.679 | 85.463 | 18.627 | 29.934 | 154.7 | 8.0 | 4.523 | 3.465 |
| N | 15 | 15 | 15 | 15 | 15 | 15 | 15 | 15 | 15 | 15 |
| MAX | 3.052 | 1109.5 | 3.033 | 343.203 | 60.207 | 91.437 | 448.1 | 99.9 | 15.816 | 11.350 |
| MIN | 0.092 | 124.5 | 0.317 | 5.361 | 5.958 | 7.528 | 13.9 | 72.8 | 0.062 | 0.020 |
| Range | 2.961 | 985.1 | 2.716 | 337.842 | 54.248 | 83.909 | 434.2 | 27.1 | 15.754 | 11.330 |
Results
The most abundant species (Table 5) in this study was Artemisia fukudo and Imperata cylindrica var. koenigii; (cover = 100%), which exhibited a CR (competitor-ruderal strategy) (C:S:R = 58.8:0.0:41.2; C:S:R = 58.1:0.0:41.9). The second most abundant species (Carex scabrifolia and Phragmatis communis; cover = 100%) exhibited an SC (stress-tolerant-competitor) strategy (C:S:R = 53.2:46.8:0.0; C:S:R = 56.3:43.7:0.0). The third most abundant species (Triglochin maritimum and Zoysia sinica; cover = 100%) demonstrated C (C:S:R = 88.5:0.0:11.5; C:S:R =100.0:0.0:0.0). One-way ANOVA results showed significant differences of all plant factors and soil factors among the plant communities (df = 14, p < 0.001).
| Species | Percentage from Hodgson et al.(1999) | Strategy type | Percentage from Cacciniga et al. (2006) | Strategy type | Plant cover (%) | ||||
|---|---|---|---|---|---|---|---|---|---|
| C(%) | S(%) | R(%) | C(%) | S(%) | R(%) | ||||
| Artemisia capillaris | 100.0 | 0.0 | 0.0 | C | 100.0 | 0.0 | 0.0 | C | 90 |
| Artemisia fukudo | 58.8 | 0.0 | 41.2 | CR | 59.0 | 0.0 | 41.0 | CR | 100 |
| Artemisia scoparis | 55.8 | 0.0 | 44.2 | CR | 56.2 | 0.0 | 43.8 | CR | 90 |
| Aster tripolium | 50.9 | 0.0 | 49.1 | CR | 51.7 | 0.0 | 49.3 | CR | 50 |
| Atriplex gmelinii | 58.1 | 0.0 | 41.9 | CR | 57.5 | 0.0 | 42.5 | CR | 80 |
| Carex scabrifolia | 53.2 | 46.8 | 0 | SC | 52.8 | 47.2 | 0.0 | SC | 100 |
| Imperata cylindrica var. koenigii | 58.1 | 0.0 | 41.9 | CR | 57.5 | 0.0 | 42.5 | CR | 100 |
| Limonium tetragonum | 96.0 | 0.0 | 4.0 | C | 94.7 | 0.0 | 5.3 | C | 50 |
| Phragmites communis | 56.3 | 43.7 | 0.0 | SC | 56.5 | 43.5 | 0.0 | SC | 100 |
| Salicornia europaea | 51.4 | 0.0 | 48.6 | CR | 51.4 | 0.0 | 48.6 | CR | 70 |
| Suaeda japonica | 57.6 | 0.0 | 42.4 | CR | 58.7 | 0.0 | 41.3 | CR | 70 |
| Suaeda malacosperma | 48.6 | 0.0 | 51.4 | CR | 48.8 | 0.0 | 51.2 | CR | 60 |
| Suaeda maritima | 51.4 | 0.0 | 48.6 | CR | 52.2 | 0.0 | 47.8 | CR | 80 |
| Triglochin maritimum | 88.5 | 0.0 | 11.5 | C | 88.5 | 0.0 | 11.5 | C | 100 |
| Zoysia sinica | 100.0 | 0.0 | 0.0 | C | 25.9 | 74.1 | 0.0 | S/SC | 70 |
Fifteen of the 19 species were allocated to CR, C, and SC strategies (Table 5 and Fig. 5). They displayed competition and disturbance adaptation strategies reflecting the ecological environment (Lee et al. 2020). In the study area, 9 species showed CR (competitor-ruderal) strategies; these were Artemisia fukudo, Artemisia scoparis, Aster tripolium, Atriplex gmelinii, Imperata cylindrica var. koenigii, Salicornia europaea, Suaeda japonica, Suaeda malacosperma, and Suaeda maritima (Table 5 and Fig. 5). They had 0.17–2.55 mm2/mg SLA and 150-700 mm canopy height. Some of them had rhizomes and lateral vegetative growth and showed CR strategies in disturbed salt marshes. The four species with C strategies were Artemisia capillaris, Limonium tetragonum, Triglochin maritimum, and Zoysia sinica (Fig. 5). Meanwhile, Carex scabrifolia and Phragmatis communis displayed SC (stress-tolerant-competitor) strategies.
Figure 2 shows the canonical correspondence analysis (CCA) bi-plot diagram of coastal salt marshes in the southwestern coasts of South Korea. Axes 1 and 2 are the vegetation plots and the plant factors. The plant factors are shown as arrows. The 15 plant communities, classified into three groups, are displayed on axes 1 and 2. Group 1 was correlated with LS and FP (Table 6). Group 2 was correlated with CH and SLA, and Group 3 was correlated with LA, LDMC and LDW. The total variation was 12.70, and explanatory variables accounted for 56.39% of the variation. The eigenvalues of axes 1 and 2 were 1.0000 and 0.9955, and those of axes 3 and 4 were 0.8859 and 0.7274, respectively. The explained variations (cumulative) of axes 1 and 2 were 7.88 and 15.72, respectively.
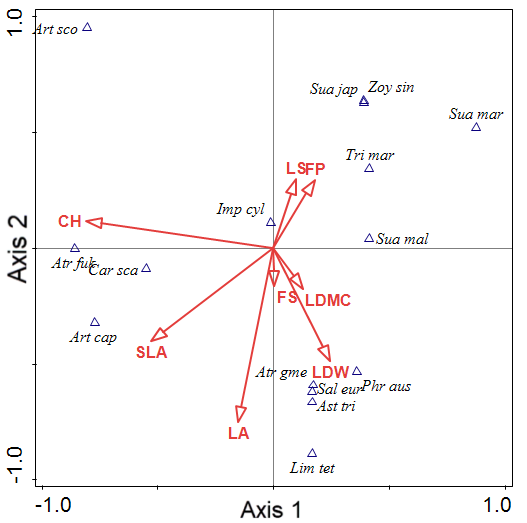
Note: Axes 1 and 2 are the vegetation plots and the plant-factor variables. Plant-factor variables are shown as arrows. The arrows point in the direction of plant factors with the highest values in the vegetation plots. The lengths of the arrows are proportional to their importance in explaining the species variation.
Art cap = Artemisia capillaris; Art fuk = Artemisia fukudo; Atr sco = Artemisia scoparis; Ast tri = Aster tripolium; Atr gme = Atriplex gmelinii; Car sca = Carex scabrifolia; Imp cyl = Imperata cylindrica var. koenigii; Lim tet = Limonium tetragonum; Phr com = Phragmites communis; Sal eur =Salicornia europaea; Sua jap = Suaeda japonica; Sua mal = Suaeda malacosperma; Sua mar = Suaeda maritima; Tri mar = Triglochin maritimum; Zoy sin = Zoysia sinica.
| Statistic | Axis 1 | Axis 2 | Axis 3 | Axis 4 |
|---|---|---|---|---|
| Eigenvalues | 1.0000 | 0.9955 | 0.8859 | 0.7274 |
| Explained variation (cumulative) | 7.88 | 15.72 | 22.69 | 28.42 |
| Pseudo-canonical correlation | 1.0000 | 0.9995 | 0.9936 | 0.9699 |
| Explained fitted variation (cumulative) | 13.97 | 27.87 | 40.24 | 50.40 |
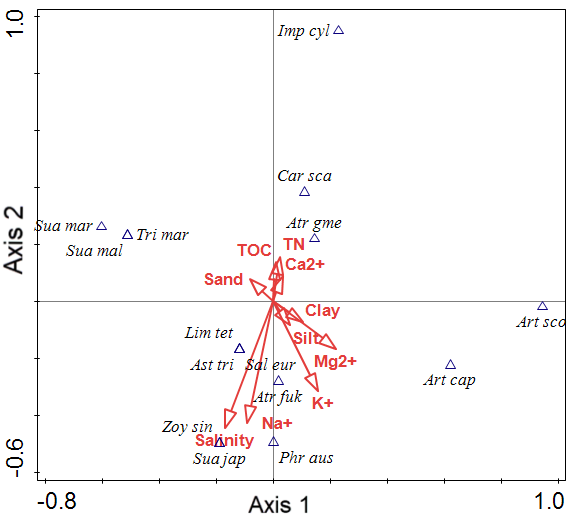
Figure 3 presents the CCA ordination results of the coastal plant dataset. The 15 community scores are plotted along axes 1 and 2 and clustered into four groups. The CCA eigenvalues for the first two ordination axes were 1.0000 and 1.0000 (Table 7). The explanatory variables accounted for 63.27% of the variance in the community data. First, the group factor was correlated with TN, TOC, and Ca2+. Second, the group factor was distributed according to Mg2+, soil texture as Clay and Silt. Third, the group factor was distributed according to Salinity and Na+ content. Fourth, the group factor was distributed according to Sand content.
| Statistic | Axis 1 | Axis 2 | Axis 3 | Axis 4 |
|---|---|---|---|---|
| Eigenvalues | 1.0000 | 1.0000 | 1.0000 | 1.0000 |
| Explained variation (cumulative) | 7.88 | 15.75 | 23.63 | 31.50 |
| Pseudo-canonical correlation | 1.0000 | 1.0000 | 1.0000 | 1.0000 |
| Explained fitted variation (cumulative) | 12.45 | 24.90 | 37.35 | 49.80 |
Discussion
In this article, one of our intent was to identify the CSR strategies of salt-marsh plants. In this study, plant-factor measurements and Braun-Blanquet’s vegetation classification (1964) were useful for coastal-plant ecosystem conservation in South Korea (Townend et al. 2010, Gu et al. 2018). Ihm and Lee (1998) reported that, to describe the major environmental factors operating in coastal wetlands and to characterize the distribution of the plant species over the coastal wetlands, 12 physical and chemical properties of the soil were assessed. The gradient of water and osmotic potential of the soil, electrical conductivity, sodium and chloride content, and soil texture along the three habitat types of salt marshes, salt swamp, and sand dunes were found. The 24 coastal-plant communities from principal component analysis (PCA) on the 12 variables were designated as a gradient for soil texture and water potential related to salinity by Axis 1 and as a gradient for soil moisture and total nitrogen by Axis 2. Those on Axis 1 were divided into 3 groups: (1) 9 salt-marsh communities, including Salicornia herbacea; (2) 5 salt-swamp communities, including Scirpus fluviatilis; and (3) 10 sand-dune communities, including Imperata cylindrica. Those on Axis 2 were divided into 2 groups: (1) salt-marsh and sand-dune communities, and (2) 3 salt-swamp communities. The results could account for the zonation of plant communities on coastal wetlands observed along environmental gradients.
In the diagram produced by CCA, the pattern of ordination was consistent with that of our DCA results (Lee et al. 2012). The communities were arranged into two groups of sand-dune and other vegetation along Axis 1, as well as two groups of salt-marsh plus salt-swamp vegetation along Axis 2. CCA Axis 1 displayed soil water and osmotic potential, soil moisture content, electrical conductivity, and organic matter gradient. In all, 14.9% of the variance among species data could be explained by the two CCA axes. These low values could be attributed to the high noise levels typical of species-abundance data (ter Braak, 1986).
Abiotic factors (Lee and Kim 2018): Understanding salt-marsh plant distribution and zonation is essential for successful conservation and restoration plans in the face of ongoing environmental change (Bertness and Ellison 1987; Pennings and Callaway 1996; Min and Kim 1999; Kim 2005; Engels and Jensen 2010; Lee and Kim 2018). The results of studies by Bertness and Ellison (1987) and Pennings and Callaway (1996) indicate that salt-marsh plants tend to cluster into various vegetation groups because of the combination of abiotic and biotic factors and positive feedback. These are, first, flooding frequency; second, soil moisture content; third, salinity; fourth, geographical variations in the physical environment; and fifth, spatial heterogeneities in soil properties.
Biotic factors (Lee and Kim 2018): Besides various chemo-physical factors, the biotic influences are important for understanding the pattern of halophyte distribution. These are, first, competition and facilitation; second, a trade-off between belowground competitive ability and the ability to tolerate the physical stressors; third, salt tolerance; fourth, the early seedling establishment phase; fifth, grazing; sixth, Spartina densiflora alters native zonation patterns via invasion of Spartina maritima tussocks into areas that should be occupied by native species.
Fifteen of the 19 species were allocated to CR, C, and SC strategies. They displayed competition and disturbance adaptation strategies reflecting the ecological environment (Lee and Kim 2018; Lee et al. 2016; Lee et al. 2020). In the study area, 9 species showed CR (competitor-ruderal) strategies: Artemisia fukudo, Artemisia scoparis, Aster tripolium, Atriplex gmelini, Imperata cylindrica var. koenigii, Salicornia europaea, Suaeda japonica, Suaeda malacosperma and Suaeda maritima (Table 4 and Fig. 5). Some of them had rhizomes and lateral vegetative growth and showed CR strategies in disturbed salt marshes. The four species with C strategies were Artemisia capillaris, Limonium tetragonum, Triglochin maritimum, and Zoysia sinica. Meanwhile, Carex scabrifolia and Phragmatis communis displayed SC (stress-tolerant-competitor) strategies. Distribution research on biotic factors and abiotic factors is especially important for restoration and conservation plans considering environmental changes (Lee and Kim 2018). To date, the vegetation establishment of coastal salt marshes has been related to salinity in the soil and seawater, redox potential, the soil ion composition, and soil moisture content. CCA showed that the distributions of invasive native and exotic species were significantly segregated, according to the disturbance level, exotic species number, gravel, sand, and silt contents, and vegetation size (Kim 2005; Lee and Kim 2018; Fig. 4 and Fig. 5). We also found that human disturbance strongly favored the settlement of invasive and exotic species.
Conclusions
The coastal salt-marsh plants were classified into three plant-factor groups in the CCA biplot diagram. The 15 plant communities, classified into three groups, are displayed on axes 1 and 2. Group 1 was correlated with LS and FP (Table 6). Group 2 was correlated with CH and SLA, and Group 3 was correlated with LA, LDMC and LDW. The plants were classified into two soil-factor groups in axes 1 and 2 of the CCA biplot diagram. First, the vegetation was correlated with total organic carbon (TOC), total nitrogen (T-N), and Ca2+. Second, it was correlated with the salinity, Na+, and K+. To clarify the relative significance of competition, stress, and disturbance in the distribution process of plant communities, we adopted the CSR distribution model. The nine species showed CR (competitor-ruderal) strategies. Both distribution patterns of the CCA diagrams and CSR triangles may provide a useful scientific basis for protecting and restoring salt marshes and their valuable ecosystem services, in the face of increasing disturbances.
Acknowledgments
This research was supported by the Basic Science Research Program through the National Research Foundation of Korea (NRF) funded by the Ministry of Education of Korea (NRF-2018R 1D 1A 1B06043748).
References
- Alvarez-Rogel, J., Jiménez-Cárceles, F.J., Roca, M.J., and Ortiz, R. (2007). Changes in soils and vegetation in a Mediterranean coastal salt marsh impacted by human activities. Estuar Coast Shelf S, 73, 510-526.
- Bertness, M.D., & Shumway, S.W. (1993). Competition and facilitation in marsh plants. Am Nat, 142, 718–724.
- Bertness M.D., & Ellison, A.M. (1987). Determinants of pattern in a New England salt marsh plant community. Ecol Monogr, 57, 129–147.
- Bertness M.D., & Callaway, R. (1994). Positive interactions in communities. Trends Ecol Evol, 9, 191–193.
- Bertness, M.D., & Hacker, S.D. (1994). Physical stress and positive associations among marsh plants. Am Nat, 144, 363–372.
- Braun-Blanquet, J. (1964). Pflanzensoziologie. Grundzuge der Vegetationskude (p. 865). Wien, New York: Springer-Verlag.
- Cho, J.-S., Lee, J.-S., & Kim, J.-W. (2017). Distribution of Phragmites australis communities with different habitat salinity. J Coastal Res, 33, 1210–1216.
- Engels, J.G., & Jensen, K. (2010). Role of biotic interactions and physical factors in determining the distribution of marsh species along an estuarine salinity gradient. Oikos,119, 679–685.
- Grime, J.P. (1974). Vegetation classification by reference to strategies. Nature, 250(5461), 26-31.
- Grime, J.P. (2002) Plant strategies, vegetation processes and ecosystem properties. John Wiley and Sons, Chichester, UK.
- Gu J, Luo M, Zhang X, Christakos G, Agusti S, Duarte, CM., Wu, J. (2018) Losses of salt marsh in China: Trends, threats and management. Estuarine, Coastal and Shelf Science 214: 98–109. Available: http://dx.doi.org/10.1016/j.ecss.2018.09.015.
- Hodgson, J.G., Wilson, P.J., Hunt, R., Grime, J.P., & Thompson, K. (1999). Allocating C-S-R plant functional types: a soft approach to a hard problem. Oikos, 85(2), 282-294.
- Ihm, B.-S., & Lee, J.-S. (1998). Soil factors affecting the plant communities of wetland on southwestern coast of Korea. Kor J Ecol, 21, 321-328.
- Ihm, B.-S., Lee, J.-S., Kim, J.-W., & Kim, J.-H. (2007). Coastal plant and soil relationships along the southwestern coast of South Korea. Journal of Plant Biology, 50(3), 331-335.
- Kim, D., Cairns, D.M., & Bartholdy, J. (2010). Environmental controls on multi-scale spatial pattern of salt marsh vegetation. Physical Geography, 31:58-78.
- Kim, D., Cairns, D.M., & Bartholdy, J. (2011). Wind-driven sea-level variation influences dynamics of salt marsh vegetation. Annals of the Association of American Geographers, 101(2), 231-248.
- Kim, K.D. (2005). Invasive plants on disturbed Korean sand dunes. Estuarine, Coastal and Shelf Science, 62(1–2), 353–364.
- Lee, J.S., & Ihm, B.S. (2004). Growth strategies of four salt marsh plants on Mankyung River estuary in Korea. Ecological Research, 19, 37-42.
- Lee, J.-S., & Kim, J.-W. (2018). Dynamics of zonal halophyte communities in salt marshes in the world. Journal of Marine and Island Cultures, v7n1, 84-106.
- Lee, J.-S., Kim, J.-W., Lee, S.H., Myeong, H.-H., Lee, J.-Y., & Cho, J.S. (2016). Zonation and soil factors of salt marsh halophyte communities. J Ecol Environ, 40:4. DOI 10.1186/s41610-016-0010-3.
- Lee, J.-S., Son, D.-H., Lee, S.-H., Myeong, H.-H., Cho, J.-S., Lee, J.-C., Lee, J.-Y., Park, C.-S., & Kim, J.-W. (2020). Canonical correspondence analysis ordinations and competitor, stress tolerator, and ruderal strategies of coastal dune plants in South Korea. J Coastal Res. 36(3), 528–535.
- Min, B.M., & Kim, J.-H. (1999). Plant distribution in relation to soil of reclaimed lands on the west coast of Korea. J Plant Biol. 42:279-286.
- Negreiros, D., Stradic, S.L., Fernandes, G.W., & Renno, H.C. (2014). CSR analysis of plant functional types in highly diverse tropical grasslands of harsh environments. Plant Ecology, 215, 379-388.
- Pennings, S.C. & Callaway, R.M. (1996). Impact of parasitic plant on the structure and dynamics of salt marsh vegetation. Ecology 77, 1410-1419.
- Pierce, S., Brusa, G., Vagge, I., & Cerabolini, B.E.L. (2013). Allocating CSR plant functional types: The use of leaf economics and size traits to classify woody and herbaceous vascular plants. Functional Ecology, 27(4), 1002–1010.
- Pierce, S., Luzzaro, A., Caccianiga, M., Ceriani, R.M., and Cerabolini, B., 2007. Disturbance is the principal a-scale filter determining niche differentiation, coexistence and biodiversity in an alpine community. Journal of Ecology, 95(4), 698–706.
- Pomeroy, L.R., & Wiegert, R.G. 1981. The ecology of a salt marsh. Ecological Studies Series, vol. 38. Springer-Verlag Inc., New York, NY.
- Silander, J.A., & Antonovics, J. (1982). Analysis of interspecific competition in a coastal plant community, a perturbation approach. Nature, 298, 557-560.
- Shim, H.-B., Cho, W.-B., & Choi, B.-H. (2009). Distribution of halophytes in coastal salt marsh and on sand dunes in Korea. Korean J. Pl. Taxon. 39(4), 264-276.
- Ter Braak, C.J.F. (1986). Canonical correspondence analysis: a new eigenvector technique for multivariate direct gradient analysis. Ecology, 67(5), 1167-1179.
- Ter Braak, C.J.F., & Smilauer, P. (2018). Canoco reference manual and user's guide: software for ordination (version 5.10). Microcomputer Power (Ithaca, NY, USA), 536p.
- Tessier M, Vivier J-P, Ouin A, Gloaguen J-C, Lefeuvre J-C. (2003) Vegetation dynamics and plant species interactions under grazed and ungrazed conditions in a western European salt marsh. Acta Oecol, 24, 103–111.
- Townend I, Fletcher C, Knaapen M, Rossington, S. 2010. A review of salt marsh dynamics. Water and Environment Journal 25(4):477 -488. DOI: 10.1111/j.1747-6593.2010.00243.x
- Woerner LS, Hackney CT. (1997) Distribution of Juncus roemerianus in North Carolina tidal marshes: the importance of physical and biotic variables. Wetlands, 17, 84–291.