Perception of Solid Waste Management and Rate of Accumulation in Schools in Mati City, Mindanao Island, Philippines
Institute of Agriculture and Life Sciences (IALS); Regional Integrated Coastal Resources Management Center (RIC-XI); Fisheries catch assessment project, Davao Oriental State College of Science and Technology (DOSCST), Philippines edmacusi@gmail.com
Institute of Agriculture and Life Sciences (IALS); Fisheries catch assessment project, Davao Oriental State College of Science and Technology (DOSCST), Philippines
Regional Integrated Coastal Resources Management Center (RIC-XI), Davao Oriental State College of Science and Technology (DOSCST), Philippines
Institute of Agriculture and Life Sciences (IALS); Regional Integrated Coastal Resources Management Center (RIC-XI) Davao Oriental State College of Science and Technology (DOSCST), Philippines
Abstract
Solid waste management is a perennial problem in the Philippines and this can be due to lack of information dissemination on proper waste disposal. This study assessed and compared the solid waste management practices of three technical and vocational colleges in Mati City, Davao Oriental. The study utilized a combination of semi-structured interviews (n=90), and actual field collection of solid wastes with weekly sampling for three months. Result of the survey on proper solid waste disposal showed high awareness of the students from the three schools (TS, CS and VS with 37%-67%). In addition, the prevailing perception on impacts of improper solid waste disposal are the following: diseases, pollution, floods, clogging of waterways and providing mosquitoes with breeding areas. Moreover, the respondents also perceived negative impacts on local economy of the improper solid waste disposal. All solid waste found in each institution were classified as either non-biodegradable or biodegradable. A large chunk of solid wastes was primarily plastic (45%) and paper (27%) in the three schools monitored. Based on the result of the field sampling, the non-biodegradable waste was significantly lesser in one of the schools (CS) compared to the other two schools (TS and VS; P=0.000). The results also revealed that the students were willing to pay for their shopping bags, but only if this cost less than Php 5.00 (1.0 U$ cent). Our study underscores the need to continue to conduct information and education campaign among students and youth for proper waste disposal inside school campuses and in immediate surrounding communities.
Keywords
Davao Oriental, Ecological Solid Waste Management Act (RA 9003), Mati City, Solid waste, Solid waste management
Introduction
Solid waste management is a critical problem in the Philippines due to inconsistent efforts of collection, segregation and processing of solid wastes (Wynne et al., 2018). Municipal solid wastes are composed of sewage sludge, scraps, domestic refuse, bulky refuse, yard, gardening wastes and other types of wastes that are produced due to overproduction and consumerism (Brunner and Ernst, 1986; Sapuay, 2016). Most solid wastes are classified into different types based on their sources: (1) Household waste is generally classified as municipal solid wastes; (2) Industrial wastes as hazardous wastes and; (3) Biomedical wastes or hospital wastes as infectious wastes. The term solid waste means any garbage, refuse, or sludge from a waste treatment plant, water supply treatment plant, or air pollution control facility and other discarded material, including solid, liquid, semisolid, or can contain gaseous material resulting from industrial, commercial, mining, and agricultural operations (Srivastava & Singhvi, 2015). The Philippines lack facilities for collection and disposal of its solid wastes in its many urban areas. Open dumps are common and responsible for the blockage of storm drains, and breeding of flies that can spread epidemic diseases (Lettor, 2018). To properly manage solid wastes, several processes are involved which include collection, transport, processing, recycling, disposal and monitoring. This is one of the great challenges affecting various local governments which must address the issue at hand. Unlike many advanced countries where the infrastructure for collection and segregation and recycling of solid wastes are in place, many developing countries like the Philippines lack resources and trained staffs to oversee and properly implement an ecologically sustainable solid waste management system (Turan et al., 2009).
Even with material recovery facilities, some solid waste components cannot be directly recycled as these can be hazardous to human health such as expired batteries (Upadhyay et al., 2012). Urbanization, rapid population growth, industrialization and consumerism are the main drivers of solid waste generation and its management is a major problem in municipalities in the Philippines (Sapuay, 2016; Trang et al., 2007). Due to changes in lifestyle and consumption patterns, this has resulted to an increase in the volume and diversity of wastes during the past decades making the Philippines the third largest source of marine litter in the ocean (Jambeck et al., 2015; Premakumara et al., 2016). This is reflective in the case of Metro Manila where it generates almost a quarter of the country’s total waste generation (Navarro, 2003). The average generation of solid waste in the Philippines is estimated to be more than 10,000 tons per day (Trang et al., 2007). There are no published data available for many other areas because of the scant study devoted to waste management and control. In addition, in order to address and design proper waste disposal, there is a need to identify what types of materials are included in wastes generated, and what are the common disposal practices of the residents and stakeholders in a community so that waste emissions can be predicted from these inputs of wastes (Brunner and Ernst, 1986).
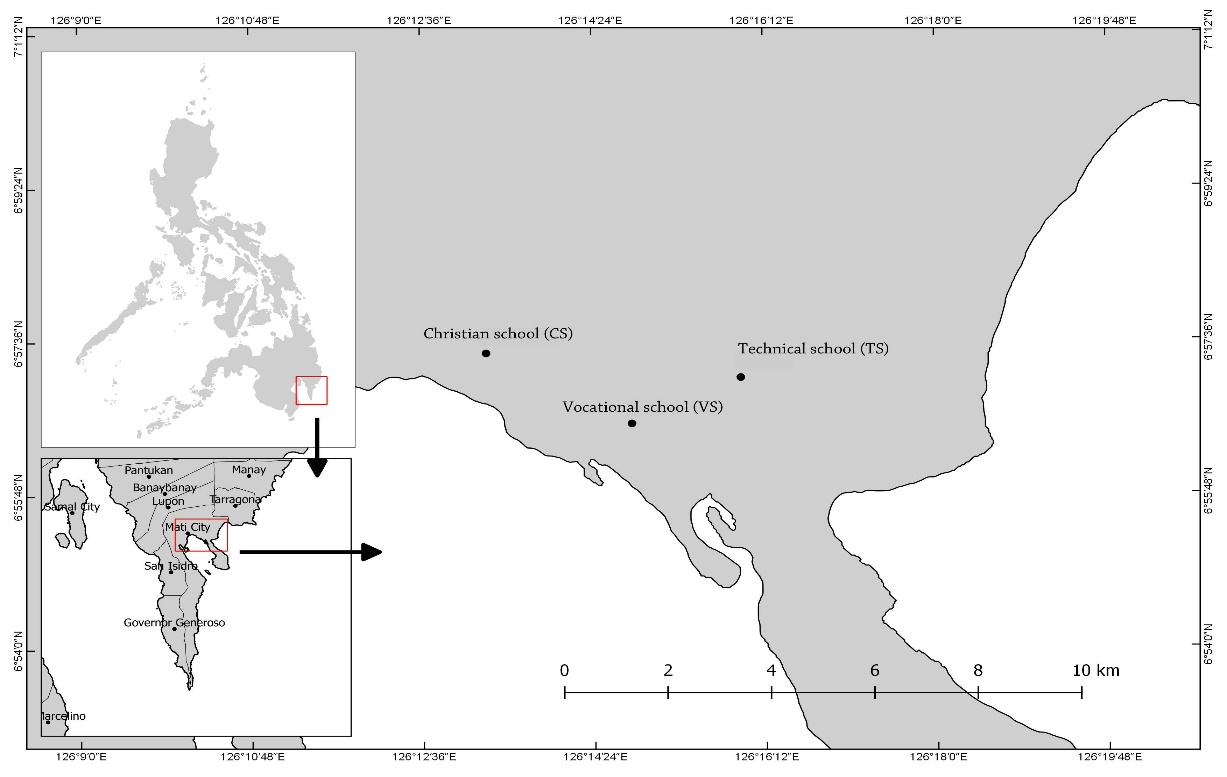
The ecological solid waste management law (Republic Act 9003) provides a policy framework direction for all LGUs in the country to establish a proper management system based on the waste hierarchy to promote the 3Rs (reduce, reuse and recycle) to reduce the amount of municipal solid waste generated. The main goal of RA 9003 was to protect the environment and public health through the creation of ecological solid waste management plans (Philippines, 2000). This then places the responsibility for solid waste management and its implementation to local government units (LGUs). Unfortunately, this was not followed by the LGUs prompting the Department of Environment and Natural Resources (DENR) to declare that about 108 municipalities did not comply with their solid waste management plans (Talabong, 2019). Given the urgency of this situation, the early adopters of SWM plans which include local governments, schools and their constituents are expected to be knowledgeable of solid waste management programs. Some examples of previous information campaigns conducted by the Department of Education (DEPED) in the past, include WOW SIGA (an acronym that stands for War on Waste and School in a Garden) and YES-O (Youth for Environment in School Organization YES-O) and participation in yearly coastal clean-ups. The goal of our study was to compare the solid waste management practices of three local schools in Mati City, anonymized as CS, TS, and VS (Figure 1). Thus, this study evaluated whether a higher level of awareness on the part of students on solid waste management resulted to a better management of solid waste inside their school campuses. Moreover, this study also quantified the accumulation rate of solid wastes found in the three schools.
Materials and Methods
Description of the study area
The study was conducted in three private colleges of Mati City, Davao Oriental anonymized as CS for the Christian school, TS for the technical school, and VS for the vocational school (Figure 1). All three schools provide courses related to computer repair, web development, good housekeeping, computer hardware servicing, book keeping, bartending, commercial cooking and some education courses.
Respondents
The respondents of the study were students, faculty personnel and utility workers from the three colleges. These were selected based on their knowledge and awareness of solid waste management and their ability to answer the questionnaire (18 years and up). The study utilized a purposive sampling design with a minimum of 30 respondents from each institution (N=90 respondents in which 12 of them were faculty personnel, 75 were students and 3 were utility workers). A purposive sampling design was utilized since it required knowledge from the respondents about the subject of waste disposal.
Data Collection
Interview Survey
A pilot survey was conducted to check the validity and reliability of the questionnaire and to ensure that the respondents understood all the questions being asked. This pilot survey allowed the researchers to focus on particular areas that may have been unclear previously and to test procedures. The researchers selected a group of ten different students from each institution to conduct the pilot survey. The ten respondents were not necessarily able to take part in the actual survey but they were comparable to the respondents in the full study. The questionnaire took 20-30 minutes to complete. Some revisions of the scales were necessary to take account of the level of education of the respondents. All questions were written in English and then translated into Cebuano when the interview was conducted because this was the local language in the study sites. The semi-structured questionnaire contained both close-ended and open-ended questions in order to elicit further information from the respondents. The main questions asked dealt with the following topics: Perception or awareness of solid wastes, knowledge about solid waste management in the school, awareness about government regulations and legislations, knowledge about other utilization of waste into useful products, characterization of solid wastes, knowledge about impacts of solid wastes to the environment, and attitude about plastic replacement in grocery stores.
Field Sampling
The field sampling occurred from January to April 2018 by randomly choosing what days per week to sample at any given school. Collected solid wastes from the three schools were identified, sorted and then quantified using a weighing scale apparatus. The categories followed the sorting procedure of (Siblos, 2017) and this was later modified for data analysis where bigger categories were used (Abreo et al., 2018). A photo documentation was also carried out during each visit.
Data Analysis
The interview data was analyzed using descriptive statistics such as frequency counts and percentages which were tabulated, analyzed and interpreted. Whenever possible, all numbers with decimal places were rounded to the nearest whole number because these were based on individual respondents. The same was done for the accumulation rate which was rounded to the nearest tenth or whole number. The volume of solid waste was also analyzed by weeks and categories using one-way ANOVA. However, the initial data exploration showed that weekly collections were not significantly different from each other so that the various categories of solid wastes were then compared and the significantly different means further tested using post-hoc tests. All data were first graphically explored using probability plots (PP and QQ plots) and when not normally distributed the weight data were \(\log_{10}\) transformed and then tested again for normality using the Ryan-Joiner test1. In addition, the accumulation rate of solid waste in the three schools was calculated based on sediment accumulation rate (Segeström and Renberg, 1986). Although the method was originally applied to determining the net annual accumulation rate of pollen grains in a given area, their formula can also be applied to solid wastes because these are also produced daily and they accumulate through time. This was to express how much refuse was being collected at any given period, and we find this formula simple to follow so that other researchers can also follow it. The quantity used was in terms of number of kilograms for the various pieces of items like plastics and papers as well as other biodegradable wastes. The alternative counting method was to do this by simply counting them one by one, in clumps or individual pieces, although this was more subjective and less accurate compared to the former method.
$$R = \frac{Q}{W}$$Where;
- \(R\) = Rate of accumulation of solid waste per week
- \(Q\) = Quantity of solid waste in kilograms (kg) or number of pieces
- \(W\) = Number of weeks (wk) of sampling
Results
Level of Awareness on Solid Waste Management
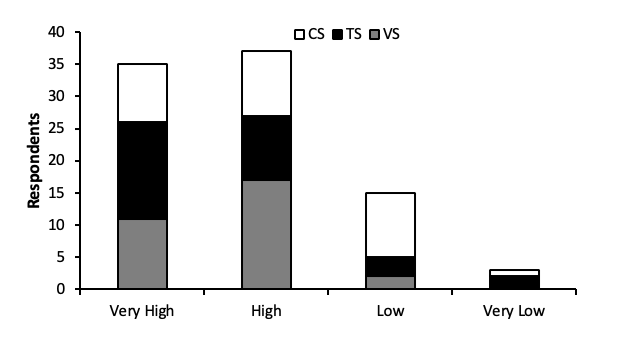
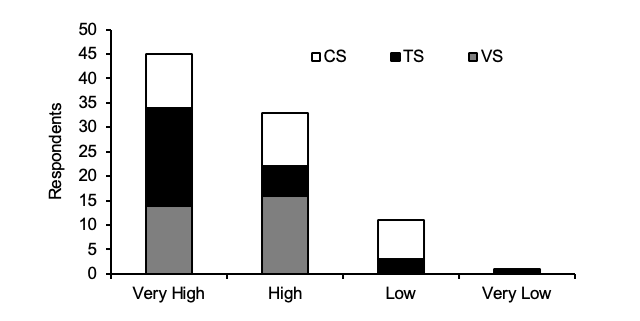
This part of the result shows the self-reported awareness of respondents regarding their knowledge on solid waste management. When the respondents were ask about their level of awareness on solid waste management, a rating of very high manifested all the time. This rating means that their self-reported awareness often manifested, while those with low and very low means that their awareness rarely manifested and never manifested towards solid waste management, they have very little information to give about solid waste management. Based from the gathered data, nine respondents from the Christian school (CS) rated themselves with very high in terms of their self-reported awareness on solid waste management and only one respondent rated very low. On the other hand, the 15 respondents from the technical school (TS) rated themselves very high and only two respondents rated themselves with very low. About 11 respondents from the vocational school (VS) rated themselves very high and none of them rated themselves very low (Figure 2). This showed a high level of self-reported awareness concerning solid waste management in the three schools.
Solid Waste Composition
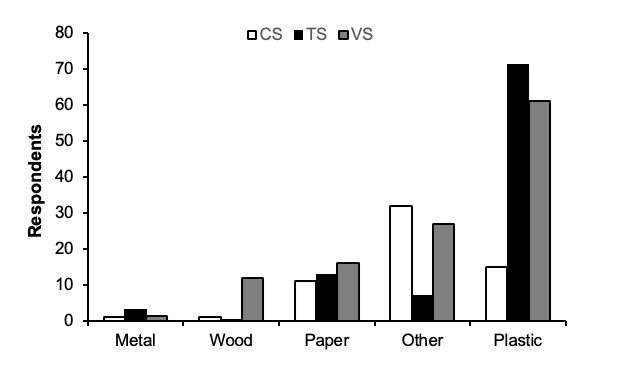
Solid waste consists of various materials, some of which can be recycled and other parts may not be recycled. Therefore, a detailed understanding on the composition of solid wastes is indicative of the management methods employed on solid wastes. When the researchers asked the respondents about the different compositions of solid wastes that they generated, they had multiple responses that were then categorized in Figure 3. Based on the figure, plastics are high on top, more than half for the technical school (TS) and the vocational school (VS) (75% and 52%) but only 25% for the Christian school (CS).
Solid Waste Segregation
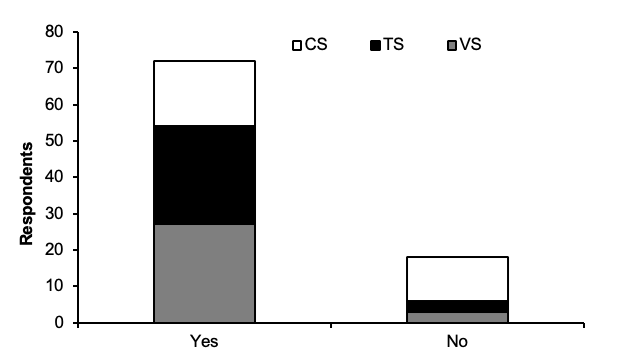
Concerning information on the self-reported awareness of respondents on solid waste segregation, 18 respondents or 60% from Christian school (CS) segregated their waste and only 40% or 12 respondents from the same institution did not practice waste segregation. About 90% of respondents from the technical school (TS) and the vocational school (VS) mentioned that they do practice waste segregation and only 10% or three respondents did not (Figure 4). Proper segregation of solid waste is very much needed at the household level to ensure that all organic wastes could be kept aside for composting and utilized for making organic fertilizers.
Solid Waste Disposal
In terms of self-reported awareness on solid waste disposal, results showed that respondents from the Christian school (CS) gave themselves a rating of very high, 37% of the respondents being highly aware towards proper solid waste disposal and none of them have rated low. On the other hand, respondents from the technical school (TS) also rated themselves very high, 67% and only one respondent gave a self-rating of low. Last, the respondents from the vocational school (VS) also rated themselves very high, 47% with none of the respondents rating very low (Figure 5).
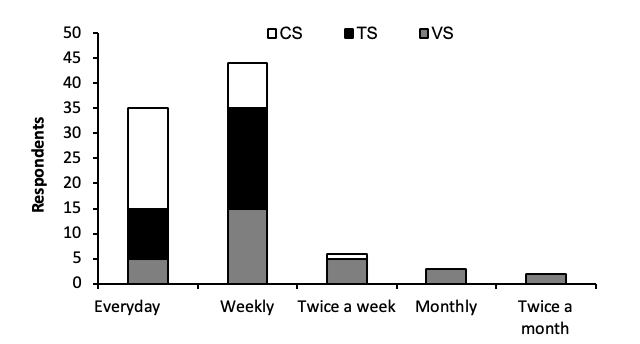
The disposal of solid wastes on land without careful planning and management can be dangerous to human health and the environment because of filth, spread of disease and leaching of hazardous wastes. Janitors and street sweepers in urban centers often dust and collect solid wastes. Many of these workers also collect the solid wastes from residential, commercial areas, and including parks and open spaces. In terms of the collection of solid wastes from the three schools, 67% of the respondents from Christian school (CS) mentioned that their wastes were collected everyday by janitors whereas for the technical school (TS=67%) and vocational school (VS=50%) their solid wastes were collected on a weekly basis. Daily collection of solid wastes by the government dump trucks would be an ideal arrangement although a weekly collection would still be satisfactory compared to a monthly collection which is the case for most municipalities (Figure 6).
Perceived Impacts
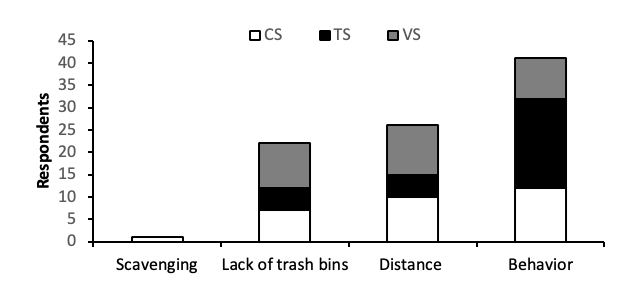
During the many field visits and semi-structured interviews, the respondents gave various reasons on why they disposed their wastes improperly like the lack of trash bins, distance from existing trash bins, sheer behavior (lazy) and scavenging. Both the Christian school (CS=40%) and the technical school (TS=67%) answered that behavior was the most important reason as to why some solid wastes are still dumped improperly. On the other hand, about 37% from the vocational school (VS) reasoned that distance to existing trash bins was also a problem towards disposing their wastes properly (Figure 7).
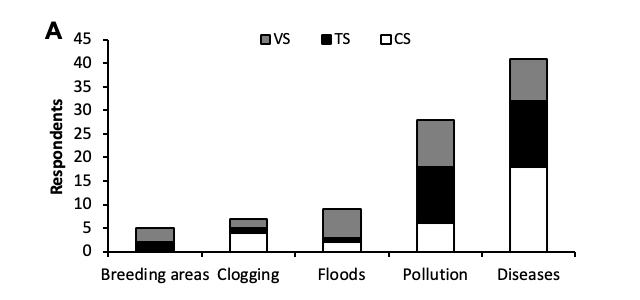
The improper disposal of solid wastes can clog waterways leading to flooding and marine litter in the ocean. All three schools have shown high awareness regarding improper solid waste disposal, which can lead to various ailments that might affect the residents (Figure 8A). The ailments could spread through inhalation of toxic fumes or spread by flies and mosquitoes that breed in dumping sites (Figure 8B).
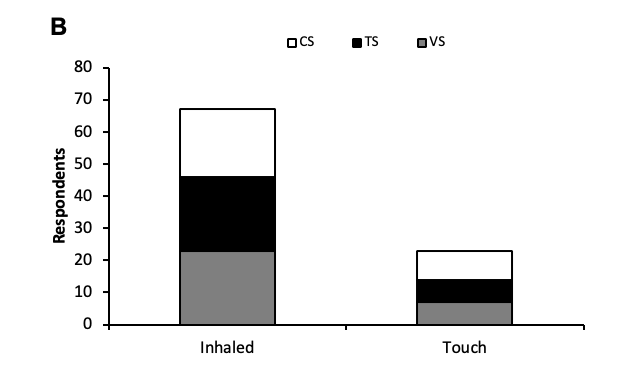
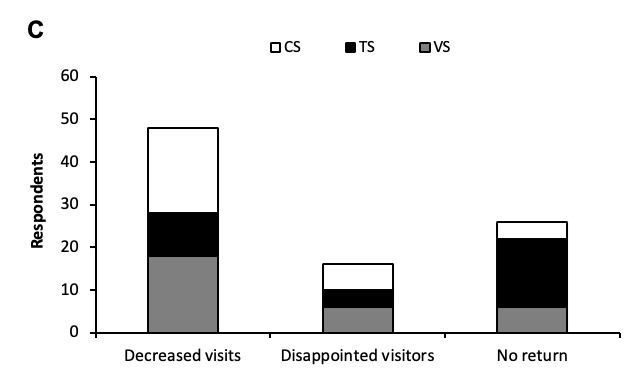
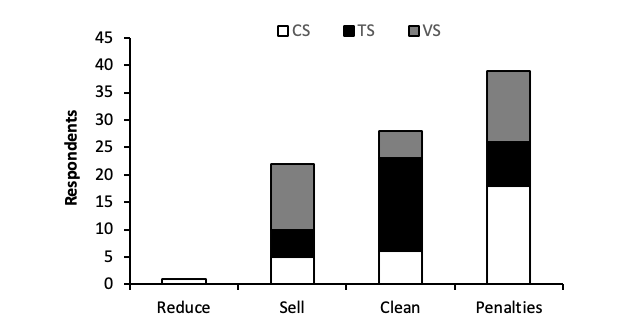
Open dumpsites are sources of pollution, the leaching of hazardous substances to groundwater and contamination of rivers and eventually the coastal waters. This can lead to illnesses affecting the coastal communities. It can also affect the tourism and business environment within the city based on the perception of tourists. Both the respondents coming from the Christian and vocational schools have emphasized a strong perception with regards to possible reduction on the number of visiting tourists in the city (67% and 60%). Meanwhile, the respondents from the technical school (TS) also mentioned that tourists might not come back to the city due to improper solid waste management (53%) (Figure 8C). The respondents were also asked whether they know how to help solve the waste disposal problem in their schools. Their answers ranged from putting up stiffer penalties to those who use singled used plastic products, e.g. sachets of shampoo, coffee, laundry powder and fabric conditioner (Christian school = 60%, vocational school = 43%) and those who will try to keep their school campus clean (technical school = 57%) (Figure 9).
Willingness to Pay for Shopping Bags
In addition, the researchers also asked the students a hypothetical situation, if the supermarkets and grocery stores will charge a cost for shopping bag, how much will they be willing to pay? The students unanimously decided that they can only afford less than five pesos (< Php 5.00; U$ 1.0 cent) (see Table 1).
| Plastic bag | Christian (CS) | Technical (TS) | Vocational (VS) |
|---|---|---|---|
| A. Small plastic bag (0-1 kg) | |||
| Less than Php 5.00 | 26 | 25 | 18 |
| Between Php 5.00 to Php 10.00 | 1 | 3 | 7 |
| Between Php 10.00 to Php 20.00 | 1 | 2 | 2 |
| Between Php 20.00 to Php 50.00 | 2 | 0 | 3 |
| Between Php 50.00 to Php 100.00 | 0 | 0 | 0 |
| More than Php 100.00 | 0 | 0 | 0 |
| B. Medium plastic bag (2-5 kg) | |||
| Less than Php 5.00 | 22 | 23 | 13 |
| Between Php 5.00 to Php 10.00 | 5 | 4 | 4 |
| Between Php 10.00 to Php 20.00 | 0 | 3 | 7 |
| Between Php 20.00 to Php 50.00 | 1 | 0 | 3 |
| Between Php 50.00 to Php 100.00 | 2 | 0 | 2 |
| More than Php 100.00 | 0 | 0 | 1 |
| C. Large plastic bag (Up to 10 kg) | |||
| Less than Php 5.00 | 20 | 21 | 8 |
| Between Php 5.00 to Php 10.00 | 6 | 4 | 6 |
| Between Php 10.00 to Php 20.00 | 1 | 3 | 4 |
| Between Php 20.00 to Php 50.00 | 0 | 1 | 7 |
| Between Php 50.00 to Php 100.00 | 1 | 1 | 0 |
| More than Php 100.00 | 2 | 0 | 5 |
Solid Waste Composition
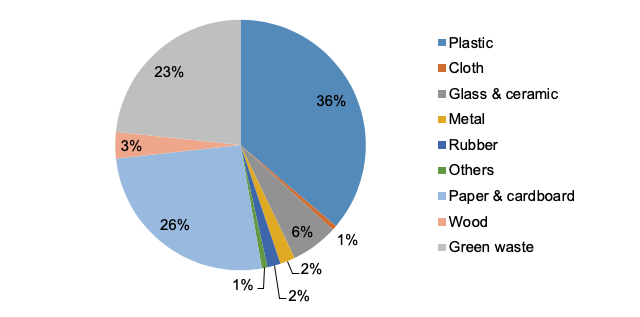
The results of the field sampling on solid wastes from the schools show that the five most common solid waste compositions determined from the Christian school (CS) were composed of plastic (36%), paper (26%), glass (6%) and wood (3%). Organic waste was also present in the school and primarily composed of fruit wastes (23%) (Figure 10) while the waste composition found in the technical school (TS) were composed mainly of recyclable wastes namely plastic (64%), paper (10%), metal (3%) and glass and ceramic (2%). The second most abundant type of solid waste was organic waste made up of fruits (20%) (Figure 11). The solid waste composition found in the vocational school (VS) on the other hand are composed of paper (43%), plastic (35%), wood (7%), glass (6%) and cloth (4%) (Figure 12). Green waste which was made up of fruits, fruit peelings was only 2%.
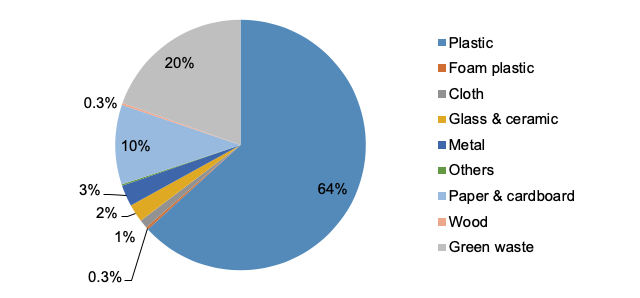
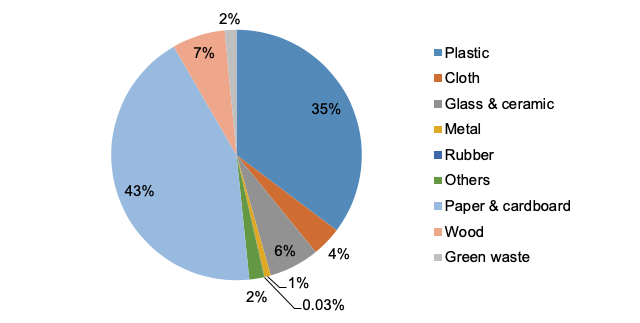
Plastic waste had the highest proportion in both the Christian (36%) and technical (64%) schools while in the vocational school, this was the second highest (35%) after paper and cardboard (43%). There were no toxic or infectious wastes observed during the gathering of the data for three months, perhaps because the setting was not in a hospital or research unit. It was however expected that the largest proportion of solid wastes present in the study sites should be made up of papers and plastics since the sampling sites were all schools. Solid wastes generated by students from the schools were mostly from food packages and school materials such as papers, cardboards and plastic bags. Since solid wastes coming from different sources were sometimes mixed together in trash bins, the solid waste composition presented in Figures 10-12 represents the average composition of solid wastes from all sources in the study sites.
Accumulation Rate of Solid Waste
There was a total of 3,876 pieces of non-biodegradable wastes accumulated from the technical school (TS) which weighed 7,850g followed by the vocational school (VS) where there was a total of 1,471 pieces of non-biodegradable wastes which weighed 8,515g. Meanwhile, the Christian school (CS) had a total of 434 pieces of non-biodegradable wastes found which weighed 1,945g. This was during the whole duration of the study where solid wastes were collected and sorted for three months. Thus, the technical school (TS) had the highest accumulation rate of non-biodegradable wastes at 323 pieces/week, followed by the vocational school (VS) with an accumulation rate of 123 pieces/week and Christian (CS) with 36 pieces/week. In terms of biodegradable wastes, the technical school had an accumulated waste that totaled to 1,305 pieces (9,085g), followed by the technical school with an accumulated waste of 372 pieces (3,320g) and then the Christian school which had an accumulated waste of 335 pieces (2,070g). In terms of accumulation rate, the vocational school (VS) had the highest accumulation rate of biodegradable wastes (109 pieces/week), followed by the technical school (31 pieces/week) and then the Christian school (28 pieces/week). The accumulation rates varied because of differences in terms of the total population of the three schools. Both the technical (TS) and vocational school (VS) schools have high accumulation rates which can be explained by the higher number of students in their campuses (354 and 721) compared to the Christian school (CS) (58).
| Source | Df | SS | MS | F | P |
|---|---|---|---|---|---|
| Christian school (CS) | 2 | 2179893 | 1089947 | 10.14 | 0.000 |
| Technical school (TS) | 33 | 3545737 | 107447 | ||
| Vocational school (VS) | 35 |
Moreover, the result of the statistical test on comparison of the average weight of non-biodegradable solid wastes from the three schools showed high significant differences among all three schools with the Christian school (CS) having less weight compared to the technical school (TS) and the vocational school (VS) (162g < 654g = 710g; P=0.000, see Table 2). In addition, there was also significant differences in terms of the weight of biodegradable wastes, with TS and CS having less weight compared to VS (173g = 277g < 757g; P=0.019, see Table 3).
| Source | Df | SS | MS | F | P |
| Christian school (CS) | 2 | 2333554 | 1166777 | 4.49 | 0.019 |
| Technical school (TS) | 33 | 8574115 | 259822 | ||
| Vocational school (VS) | 35 |
On the other hand, the result of the analysis of solid wastes based on categories showed high significant differences, mainly with plastics, foam plastics, cloths, glass and ceramics, metals, rubbers, paper and cardboards, woods and others were different from other categories (P=0.000; Table 4). The Fisher LSD post-hoc analyses showed differences in terms of the means making the paper and cardboards and plastics as the primary waste products from the three schools during the sampling period.
| Source | Df | SS | MS | F | P |
| Christian school (CS) | 11 | 6279228 | 697692 | 15.74 | 0.000 |
| Technical school (TS) | 348 | 15515444 | 44330 | ||
| Vocational school (VS) | 359 | 21794672 |
Discussion
Solid waste is a pressing environmental problem driven by population growth and various economic activities. This has combined together with the lack of well-trained personnel from the local government to handle solid wastes making it more difficult to implement a solid waste management program (Khajuria, Yamamoto & Morioka, 2008; Jambeck et al., 2015). Compared to those in developed nations, residents from the Philippines especially the urban poor, are more severely impacted by unsustainably managed waste. Oftentimes, solid waste is disposed in unregulated dumps or openly burned. These practices create serious health, safety, and environmental concerns (Kaza et al., 2018). Poorly managed waste serves as a breeding ground for disease vectors, contributes to global climate change through methane generation, and can even result to urban violence (Group, 2018). There is also the lack of budget appropriation and inappropriate scale of operation for the solid waste collection and disposal making it impossible to be efficient in the operation of a solid waste management program (Pagunsan and Shimada, 2012). Further research evidence in Malaysia revealed that limited information, lack of basic data and inappropriate system for data collection, industrial waste generation and composition, conflicts in solid waste definition are some of the most fundamental barriers for planning a suitable waste management (Mallak et al., 2014).
Good and proper solid waste management reduces or eliminates impacts to the environment, human health and supports economic development leading to improved quality of life (Lettor, 2018). Most of the problem emanating from non-biodegradable solid wastes are due to the synthetic organic polymers, including the majority of plastics that are extremely resistant to biodegradation. This phenomenon starts to create significant economic and environmental problems when landfill sites overflow with plastics (Salam, 2010). As shown by our study, plastics and papers are the most abundant waste materials found in the school campuses. Plastic is one of the major objectionable components of solid wastes. Plastics can be recycled to produce insulating materials, sheets, bags, and structural material (Singh et al., 2014). When plastics are burned it contributes to greenhouse gases and other carcinogenic gases. It also poses serious marine litter problem that impacts marine wildlife (Abreo, 2016; Abreo et al., 2018; Abreo et al., 2015; Abreo et al., 2019). Recycling plastics will help in job generation along with the reduction of transport and space requirement for dumping. Most plastics can be densified locally by flattening, baling or granulating and sold to converters where the resins are turned into pellets. They can also be sold directly to other end users who manufacture them into products like bottles, carpets, flower pots and insulation materials (ISWA, 2009).
Based on the results of our survey, the perception of waste segregation is very high among the students but in reality, waste segregation of plastic bags, sachets, packaging materials, glass bottles and rubber materials could be very challenging because of the insufficient practice of labeling (Mallak et al., 2014). Proper labeling of packaging materials leads to faster waste segregation because they can be sorted and classified easier. Other than this, most schools in the area do not really practice waste segregation, as there were mixing of solid wastes during the field collection of data. For biodegradable wastes, the organic part can decompose and attract insects which can cause diseases if not properly addressed. Organic wastes can be composted and then used as a fertilizer.
The segregation of wastes at source and promotion of recycling or reuse of segregated materials reduces the quantity of waste (Singh and Francis, 2017). Some LGUs have strictly enforced segregation at source coupled with segregated collection through a “no segregation, no collection” ordinance (Premakumara et al., 2016). The wastes will be segregated and properly marked as can be composted, non-recyclable, recyclable or special wastes (Parayno & Trang, 2007). In recent years, a small number of industrial sectors have applied the segregation of solid wastes at the source for the goal of on-site recycling as one method of waste minimization (Babu et al., 2009). In fact, in our study, the students were highly aware of the need to recycle and reuse plastic products or packaging materials. But this awareness was not translated into action. Yet in spite of that, there is a global trend towards resource recovery rather than waste disposal. Resource recovery is no longer limited to solid wastes such as plastics, glass, tins, papers and rubber but includes residual wastes (Sapuay, 2016). A move toward a greater emphasis on reduction, reuse and recycling activities in Malaysia, for example, is mainly affected by knowledge and awareness (Agamuthu and Fauziah, 2011). As shown by the study, behavior change is one of the problems encountered. Therefore, organizing workshops and campaigns under the supervision of knowledgeable trainers/facilitators such as those from academic institutions can be effective in dealing with the above issues (Mallak et al., 2014). In terms of perceived impacts by the general public, it seems that most are indifferent towards garbage disposal, everyone is minding their own business except proper waste disposal. This mind set is primarily responsible for the failure of solid waste management and lack of cooperation in its implementation. If the communities are made to understand how to dispose their solid wastes properly, they will understand the consequences of their actions. Poorly collected or improperly disposed wastes can have detrimental impacts to the environment and to human health (Lettor, 2018; Triassi et al., 2015). Market based incentives to influence behavior have been tested in other fields of study so that solid waste management should not be any different.
Conclusion
Our study challenges the notion that it is enough to have a textbook knowledge about solid waste management. On the contrary, previous programs on solid waste management which have been inadequately implemented by schools need to be enhanced and strengthened at all levels of education because of the gap between self-reported awareness and the behavioral problem pointed out by the students in the management of solid waste. Likewise, programs of local government units on solid waste management should be strictly implemented and supported by the community. A sectoral approach could potentially have a wider impact and reach compared to having small programs in selected schools. This also implies that given a growing population, waste minimization, including reduced consumption will be required to attain the goal of meeting the minimum standards of ecologically sound waste management.
Acknowledgements
This study would not have been possible without the earlier permission granted for the study by the different school heads of Christian school, Technical school and Vocational school in Mati City for the sake of science for development. We are grateful for the students who participated in this study and for the time lent to us by the administrators from the three schools. We are also grateful for the reviewers who helped vastly improve the manuscript.
Endnotes
References
- Abreo, N.A., Macusi, E.D., Jimenez, L.A., 2018. A survey of subtidal anthropogenic marine debris (AMD) in Mayo Bay, Mati City, Davao Oriental, Philippines. Philipp J of Sci 147, 597-600.
- Abreo, N.A., Macusi, E.D., Blatchley, D.D., Cuenca, G.C., 2016. Ingestion of marine plastic debris by Green Turtle (Chelonia mydas) in Davao Gulf, Mindanao, Philippines. Philipp J of Sci 145, 17-23.
- Abreo, N.A.S., Macusi, E.D., Cuenca, G.C., Ranara, C.T.B., Andam, M.B., Cardona, L.T., Arabejo, G.F.P., 2015. Nutrient enrichment, sedimentation, heavy metals and plastic pollution in the marine environment and its implications on Philippine marine biodiversity: a review. IAMURE Int J Ecol Conserv 15, 111-168.
- Abreo, N.A.S., Thompson, K.F., Arabejo, G.F.P., Superio, M.D.A., 2019. Social media as a novel source of data on the impact of marine litter on megafauna: The Philippines as a case study. Mar Pollut Bull 140, 51-59.
- Agamuthu, P., Fauziah, S., 2011. Challenges and issues in moving towards sustainable landfilling in a transitory country-Malaysia. Waste Manament & Research 29, 13-19.
- Brunner, P.H., Ernst, W.R., 1986. Alternative methods for the analysis of municipal solid waste. Waste Manage Res 4, 147-160.
- Congress of the Philippines. 2000. Republic Act no. 9003 (Ecological Solid Waste Management Act). Congress of the Philippines, Manila, Philippines, pp. 1-44.
- Group, W.B., 2018. Municipal solid waste management : a roadmap for reform for policy makers. World Bank, Washington, DC., p. 162.
- ISWA, 2009. A study of waste and climate change. International Solid Waste Association (ISWA), Vienna, Austria, pp. 3-38.
- Jambeck, J.R., Geyer, R., Wilcox, C., Siegler, T.R., Perryman, M., Andrady, A., Narayan, R., Law, K.L., 2015. Plastic waste inputs from land into the ccean. Science 347, 768-771.
- Kaza, S., Yao, L., Bhada-Tata, P., Van Woerden, F., 2018. What a Waste 2.0: A global snapshot of solid waste management to 2050, urban development series. World Bank, Washington, DC.
- Lettor, I.B.K., 2018. Assessing the operational efficiency of the Tamale landfill site and its health implications. J Environ Pollut Hum Heal 6, 148-156.
- Mallak, S.K., Ishak, M. B., & Mohamed, A. F., 2014. Waste minimization benefits and obstacles for solid industrial wastes in Malaysia. J Environ Sci Toxic Food Tech 8(2).
- Navarro, R.A., 2003. A systems approach on solid waste management in Metro Manila, Philippines. Lund University, Sweden, p. 49.
- Pagunsan, J., Shimada, K., 2012. Efficiency evaluation of Philippines waste management sector: a two stage approach, 17th annual conference of the society for environmental economics and policy studies, Tohoku University, Sendai, Japan.
- Premakumara, D., Gilby, S., Kataoka, Y., 2016. Policy brief: Barriers for implementation of the Philippine national solid waste management framework in cities. Institute for Global Environmental Strategies (IGES), pp. 1-12.
- Salam, A., 2010. Environmental and health impact of solid waste disposal at Mangwaneni dumpsite in Manzini: Swaziland. J Sustain Dev Africa 12, 64-78.
- Sapuay, G.P., 2016. Resource recovery through RDF: current trends in solid waste management in the Philippines Procedia Environ Sci 35, 464-473.
- Segeström, U., Renberg, I., 1986. Calculating net annual accumulation rates of sediment components exemplified by pollen. Hydrobiologia 143, 45-47.
- Siblos, S.K.V., 2017. Composition and rate of accumulation of anthropogenic marine debris in the mangrove forest of selected coastal barangays of Pujada bay, City of Mati, Davao Oriental, Institute of Agriculture and Life Science (IALS). Davao Oriental State College of Science and Technology, Mati City, p. 57.
- Singh, G.K., Gupta, K., Chaudhary, S., 2014. Solid waste management : its sources, collection, transportation and recycling. Int J Environ Sci Dev 5, 347-351.
- Singh, R., Francis, R., 2017. Case study and comparison of data for solid waste management in Allahabad , Varanasi and Kanpur District in Uttar Pradesh (India) Int J Mech Eng Tech 8, 1060-1067.
- Talabong, R., 2019. DILG orders 108 LGUs to explain absence of waste management plan, Rappler. Maria Ressa, Manila, Philippines.
- Trang, D.N.T., Parayno, P.P., Karagiannidid, A., Bilirtewski, B., 2007. The effects of local cultural and socioeconomic features on the structure of solid waste management in developing countries: the case of Philippines and Vietnam, 11th international waste management and landfill symposium, Cagliari, Italy.
- Triassi, M., Alfano, R., Illario, M., Nardone, A., Caporale, O., 2015. Environmental pollution from illegal waste disposal and health effects: a review on the triangle of death. Int J Env Res Pub He 12, 1216–1236.
- Turan, N.G., Çoruh, S., Akdemir A., Ergun, N.O., 2009. Municipal solid waste management strategies in Turkey. Waste Manage 29, 465–469.
- Upadhyay, V., Jethoo, A.S., Poonia, M.P., 2012. Solid waste collection and segregation : a case study of MNIT campus , Jaipur. Int J Eng Innovative Tech (IJEIT) 1, 144-149.
- Wynne, A.L., Nieves, P.M., Vulava, V.M., Qirko, H.N., Callahan, T.J., 2018. A community-based approach to solid waste management for riverine and coastal resource sustainability in the Philippines. Ocean and Coast Manage 151, 36-44.