Mangrove assessment in Manamoc Island for coastal retreat mitigation
School of Environmental Science and Management, University of the Philippines Los Baños, College, Laguna mrmartinez3@up.edu.ph
School of Environmental Science and Management, University of the Philippines Los Baños, College, Laguna
Institute of Biological Sciences, College of Arts and Sciences, University of the Philippines Los Baños, College, Laguna
Faculty of Management and Development Studies, University of the Philippines Open University, Los Baños, Laguna
Abstract
Manamoc Island is experiencing coastline retreat and is in urgent need of economical mitigating measures. This study explored the role of mangroves in the mitigation of coastal retreat in Manamoc Island. Assessment of mangroves through standard vegetation analysis was done in relation to the topography and coastal dynamics prevalent in Manamoc Island. Time series analysis of sand and mangrove cover change was carried out to determine the role of mangroves in coastal retreat mitigation. Cluster analysis revealed five clusters named after the dominant species: Cluster I – Avicennia marina (Forsk.) Vierh.; Cluster II – Bruguiera sexangula (Lour.) Poir.; Cluster III – Rhizophora apiculata Blume and Rhizophora mucronata Lam.; Cluster IV – Rhizophora mucronata Lam.; and Cluster V – Sonneratia alba J. Smith. The clustering pattern followed that of typical mangrove zonation landward, middleward, and seaward although with a relatively short width. Canonical correspondence analysis (CCA) indicated that environmental factors like soil texture, pH, N, and P influenced mangrove distribution in Manamoc Island. Time series analysis of sand and mangrove cover change revealed that mangrove were responsible for the accumulation of sand in the entrance of the studied lagoon. In areas with less sediments and the very strong water currents, mangroves were not able to colonize.
Keywords
coastal dynamics, coastal retreat, hydrometeorological hazards, Manamoc Island, mangroves
Introduction
The threat of coastal retreat has been disturbing the community of Manamoc Island. It may be not much compared to large islands experiencing the same issue. However, the retreat will progress if left unabated. With the impending impacts of sea level rise and hydrometeorological hazards, disaster is inevitable (Capili, Ibay, & Villarin, 2005; Roebeling, et al., 2013; Cinco, et al., 2016). To address the issue, the community built a 1km seawall with assistance from the national government. Maintenance for this kind of structure, aside from being costly is also temporary and interrupts the natural processes i.e. sand budget. It was therefore imperative to design mitigating measures that are ecological, practical, the least costly and proactive. Mangroves are among these least costly and proactive soft structures. Duke (1992) described mangrove as group of trees and shrubs that thrive in marine intertidal zone. Studies have proved that mangroves are important in the stabilization of coastal areas (i.e. Ahmad & Pheng, 2013; Cruz et al., 2011; Winterwerp et al., 2005). In the Philippines, mangrove reforestation has been used as a strategy in coastal resource management primarily because of the role of mangrove in the production of fish and other seafood.
Recently, the role of mangroves in stabilizing coastline and protecting against strong waves and winds has been recognized due to the risks of hydrometeorological hazards such as typhoons and storm surge. This is especially critical in small islands like Manamoc, Cuyo, Palawan. Generally, this study explored the suitability and possibility of mangrove as mitigating measure for coastal retreat. Specifically, the objectives of this study were: (a) assess the structure of the mangrove ecosystem on Manamoc Island; and (b) analyze the environmental factors and coastal processes that influence the distribution of mangroves on the island.
Materials and Methods
Study Area
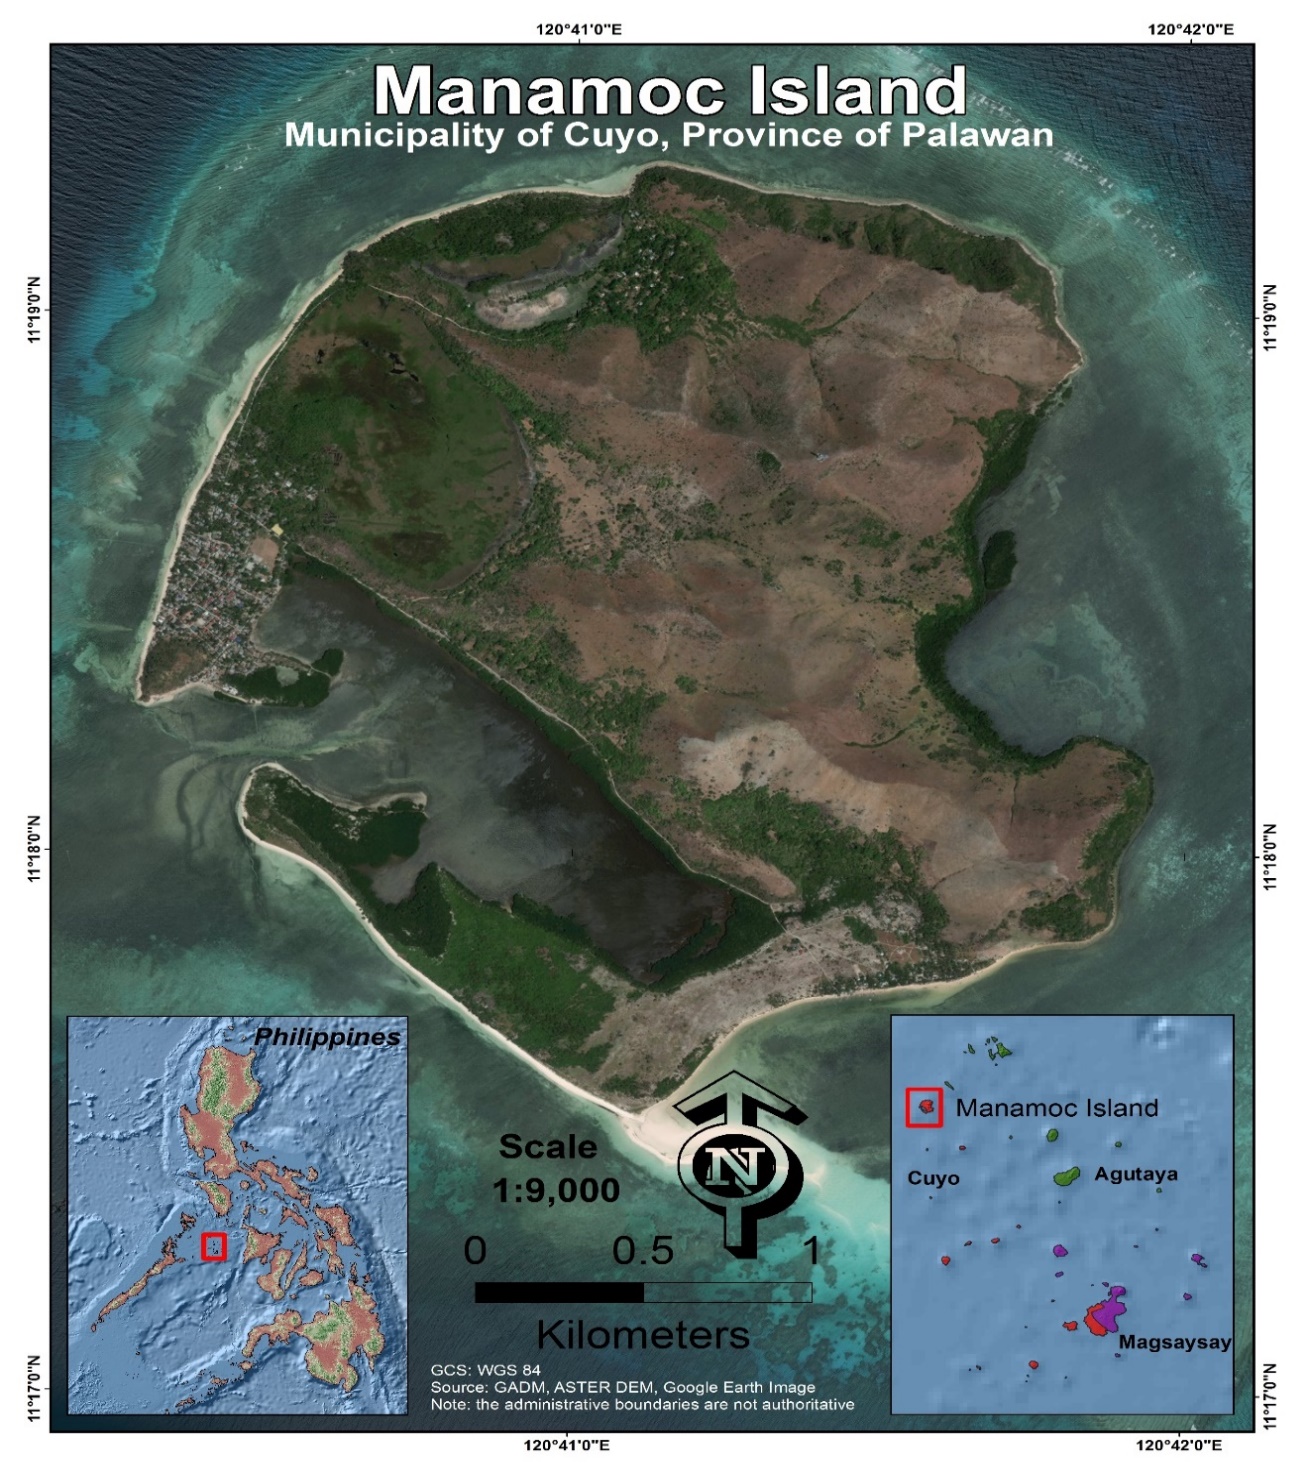
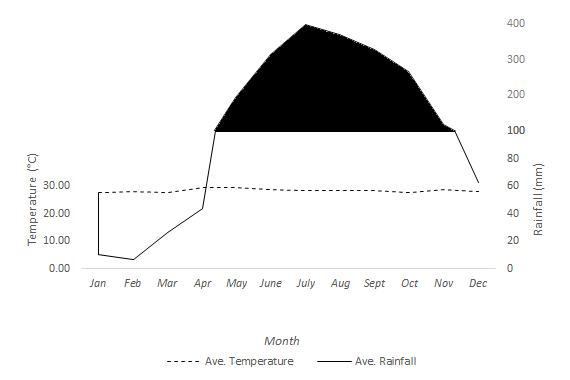
The study was conducted on Manamoc Island, northeast of Palawan, Philippines (Figure 1). There are two major mangrove forests on the island: Caseledan Lagoon and Sitio Kanike. Caseledan is an 80-hectare coastal lagoon surrounded by mangroves and Kanike is a small embayment in the eastern part of the island bordered by fringing-mangrove forest. Manamoc Island has Type I climate similar to that of Cuyo (Figure 2) which is characterized by a distinct dry period from November to April and a wet season from May to October (Tolentino, et al., 2016). Average annual precipitation is 2,136.80mm.
Methods
1. Assessing the mangrove structure
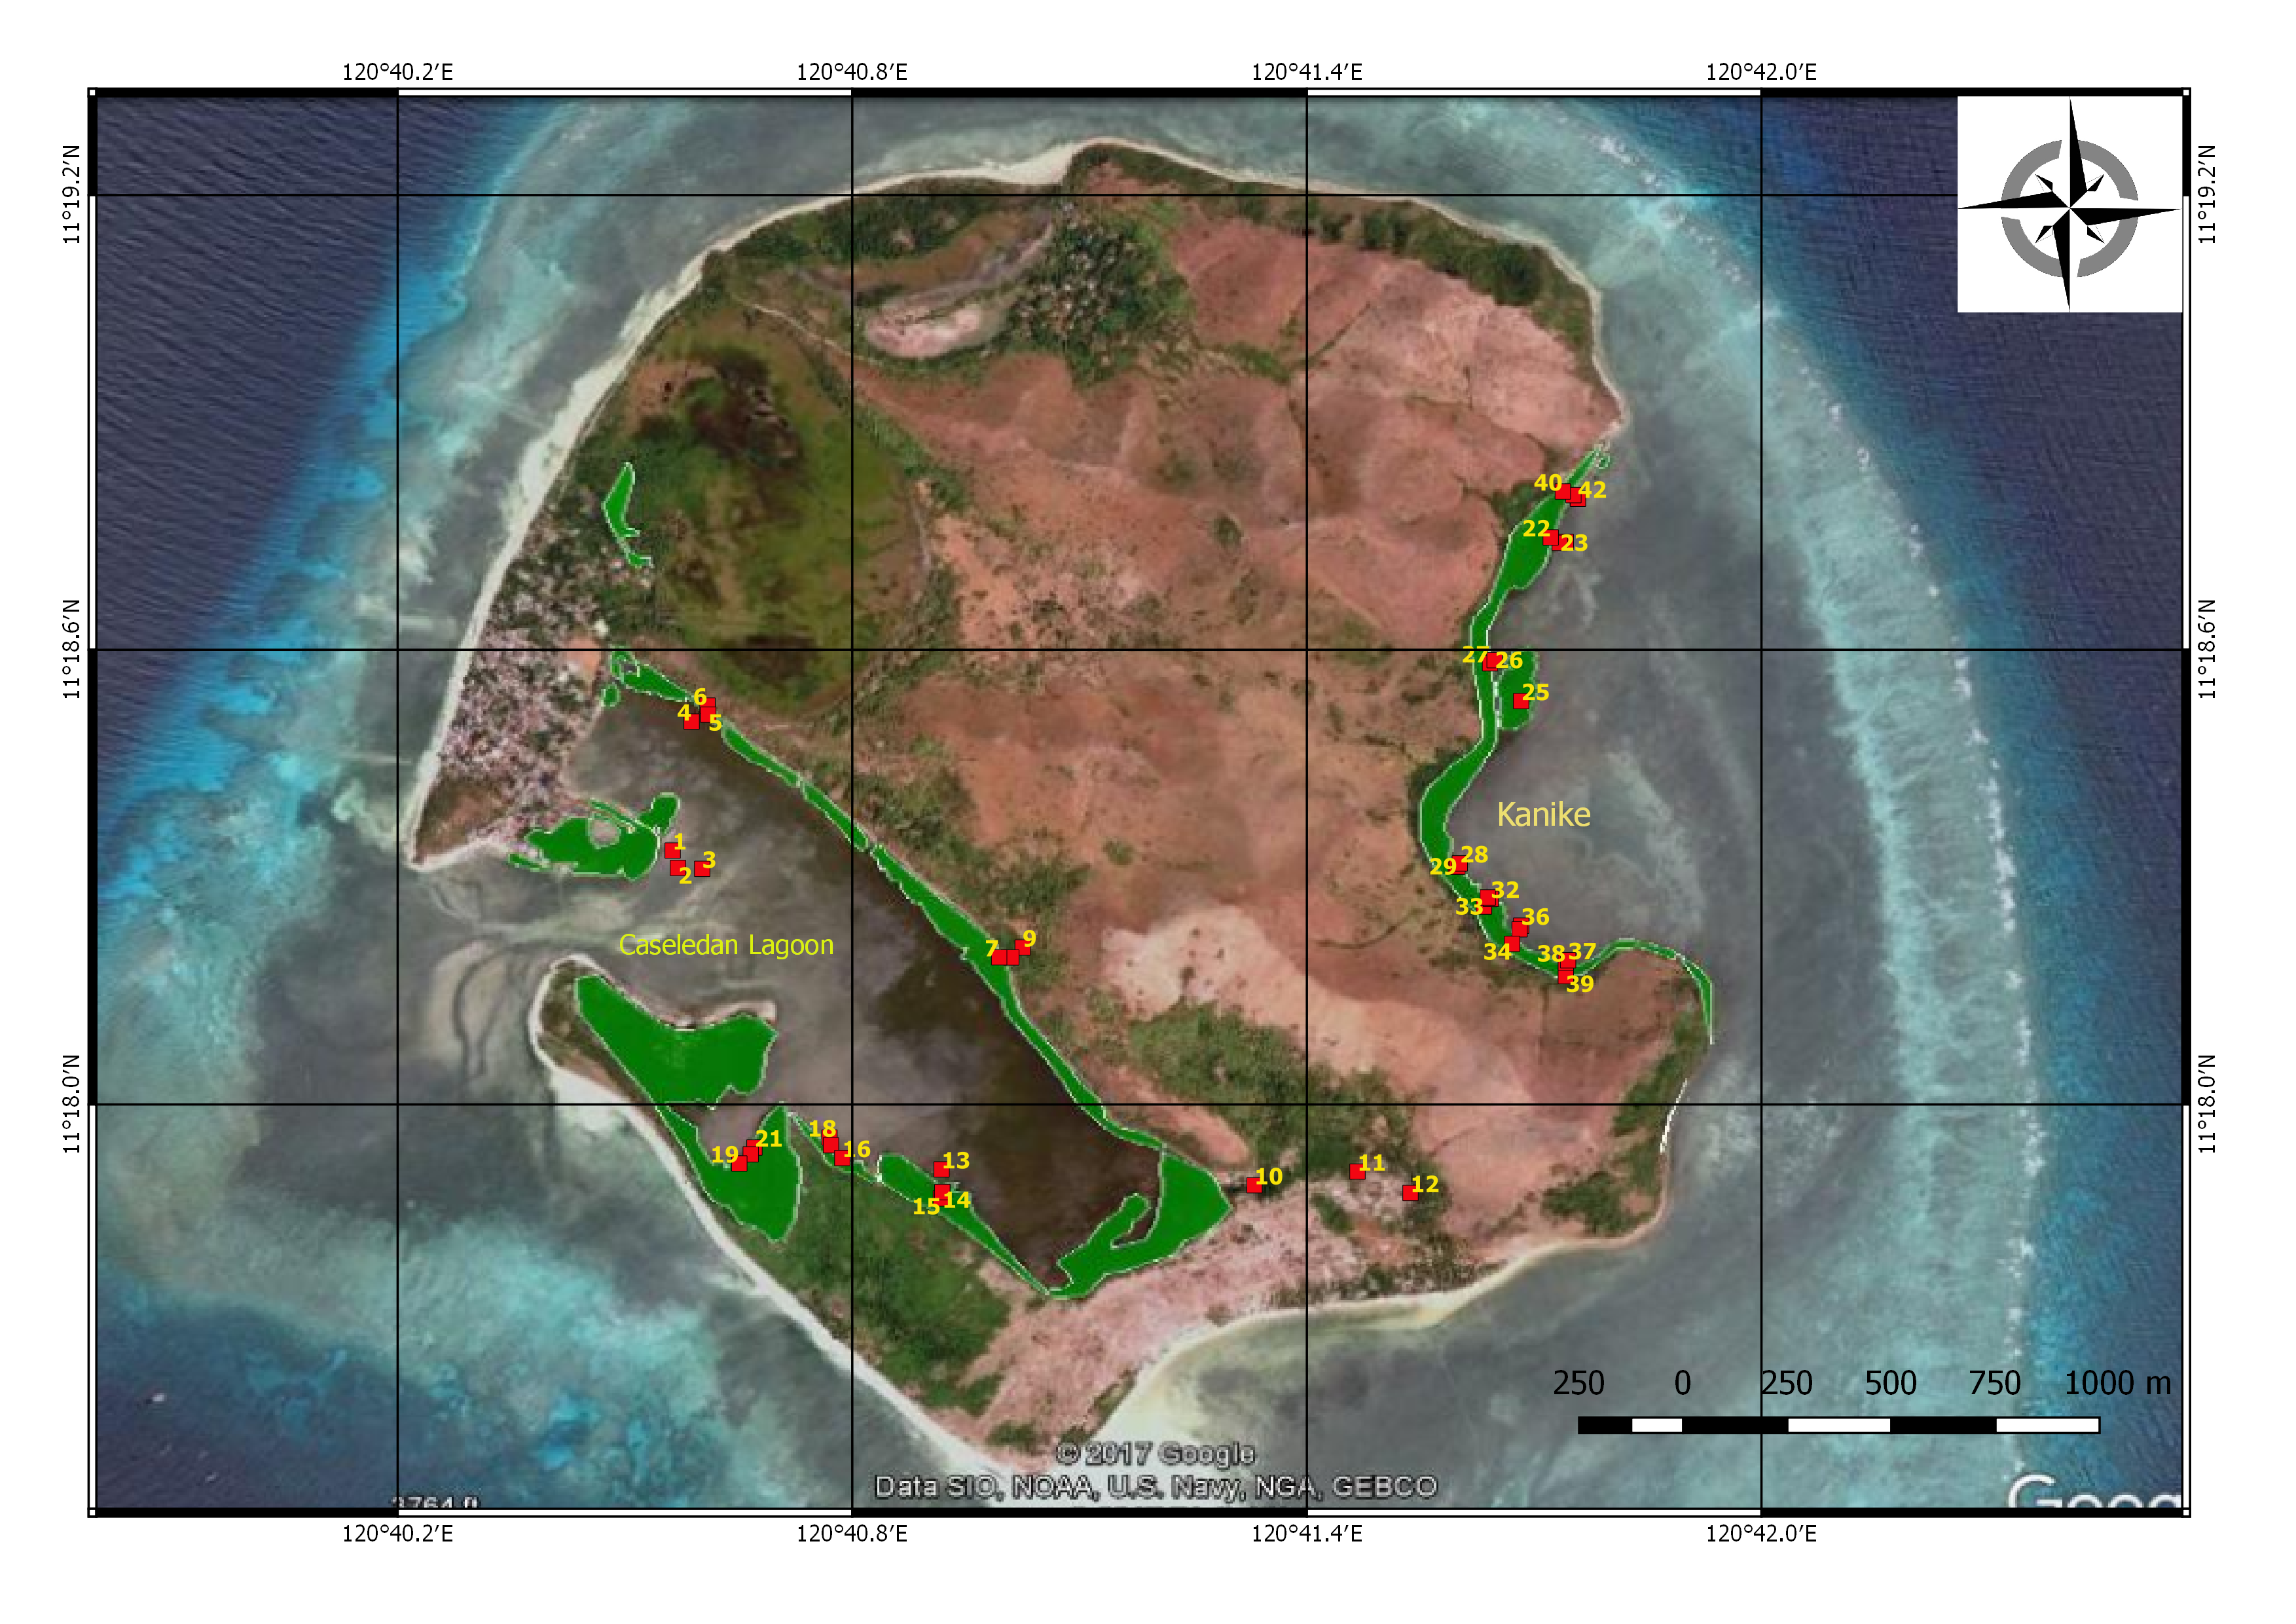
Using the plot method, forty-two (42) 10m × 10m sampling plots were laid-out along the mangrove stretch of the two major mangrove forests on Manamoc Island: Caseledan Lagoon and Kanike (Figure 3). Plots were distributed according to mangrove zones: landward, middleward and seaward. Number of trees, species, diameter at breast height (dbh), height, coordinates of each plot, and the disturbances observed were noted and recorded per plot. The Field Guide to Philippine Mangroves by Primavera (2009) was used in identifying the mangroves. Species names were validated by For. Caringal a PhD candidate and an expert from the University of the Philippines Los Baños (UPLB).
Average height and relative basal area per plot were computed to describe the physiognomy. Shannon’s index (Spellerberg & Fedor, 2003) was used to compute the index. Importance value (IV) was computed using density, frequency, and basal area. Dominance was computed using Ohsawa’s model (Ohsawa, 1984) as follows:

where d = the deviation, xi = the actual percent share (in this study, IV values are used) of the top species (T), i.e., the most dominant in the one-dominant model, or the two most dominant in the two-dominants model and so on; x is the ideal percent share based on the model as mentioned above; xj is the percent share of the remaining species (U); and N is the total number of species.
The vegetation data were supplemented with socio-economic data from key informants to provide information on the disturbances in the mangroves. Meanwhile, the total relative basal area (RBA) was used in cluster analysis. A dendrogram was constructed using the unweighted pair group method with arithmetic (UPGMA) averaging linking algorithm and Bray-Curtis similarity index at 0.4. The resulting zones were named after the dominant mangrove species. The dominant mangrove species were those with highest RBA. Following Ohsawa’s model of dominance, if there were two co-dominant species, the name of the second dominant was combined with the first dominant species and so on.
2. Analyzing the relationship between mangrove distribution and environmental factors and coastal processes
In determining the environmental factors affecting the distribution of mangroves, soil sampling was done following compositing sampling described by Tan (2005). Teacup sized soil samples were collected and mixed thoroughly. Nitrogen (N), phosphorus (P), potassium (K), and pH were analyzed using the soil test kit developed by Soil Science Cluster University of the Philippines, Los Baños. Particle size were tested using the “feel method” by Thien (1979).
To analyze the relationship of soil texture and pH, N, P, and K with the species distribution of mangroves, canonical correspondence analysis (CCA) was employed. Further analysis was carried out by examining the longshore transport, prevailing winds, rainfall pattern, temperature, and the geographic features of Manamoc Island in relation to the species distribution of mangroves.
3. Assessing the role of mangroves in coastal retreat
To assess the role of mangroves in coastal retreat, time series analysis of land cover change of Manamoc Island was used. Landsat images of Manamoc Island in 1989, 1997, 2003, 2006, and 2016 were downloaded from the USGS website and processed using remote sensing techniques. The unsupervised classification (a method of classifying image in remote sensing) was employed to produce a land cover map of the island. However, it should be noted that there were limitations to this method: 1) coarse resolution of the image; 2) no accuracy assessment; and 3) limited available images. This study focused on two land covers: mangrove and adjacent sand. Changes in the area cover of these two were computed. To support the results, key informant interviews were used.
Results
1. Structure of mangrove communities in Manamoc Island
Eleven true mangrove species from six families were found in the Manamoc Island sampling plots (Table 1). Other species of true mangroves and mangrove associates were also observed outside the sampling plots and these included: Nypa fruticans Wurmb., Bruguiera gymnorhiza (L.) Lam., Aegiceras floridum Roem and Schult., Pongamia pinnata (L.) Pierre, and Dolichandrone spathacea (L.f.) Baill. ex K. Schum. Diversity index was 1.71. Analysis of the importance value (Table 1) showed that Rhizophora mucronata Lam. (R. mucronata hereafter) was the most important mangrove species, followed by Rhizophora apiculata Blume, Avicennia marina (Forsk.) Vierh., Sonneratia alba Sm., and Bruguiera sexangula (Lour.) Poir. For convenience, the following abbreviations will be used hereafter: R. apiculata, A. marina, S. alba, and B. sexangula hereafter. Dominance analysis following Ohsawa’s model and using IV resulted in four dominant species: R. mucronata, R. apiculata, A. marina, and S. alba.
| Family | Species | F | D | BA | RD | RF | RBA | IV | Rank |
|---|---|---|---|---|---|---|---|---|---|
| Avicenniaceae | Avicennia marina (Forsk.) Vierh. | 0.200 | 390.48 | 0.2232 | 17.79 | 20.00 | 22.32 | 20.04 | 3 |
| Rhizophoraceae | Bruguiera parviflora (Roxb.) Wight and Arn. ex Griff. | 0.008 | 4.76 | 0.0006 | 0.22 | 0.80 | 0.06 | 0.36 | 10 |
| Rhizophoraceae | Bruguiera sexangula (Lour.) Poir | 0.104 | 219.05 | 0.0524 | 9.98 | 10.40 | 5.24 | 8.54 | 5 |
| Rhizophoraceae | Ceriops tagal (Perr.) C. B. Rob. | 0.024 | 16.67 | 0.0018 | 0.76 | 2.40 | 0.18 | 1.11 | 7 |
| Combretaceae | Lumnitzera racemosa Willd. | 0.032 | 78.57 | 0.0086 | 3.58 | 3.20 | 0.86 | 2.55 | 6 |
| Rhizophoraceae | Rhizophora apiculata Blume | 0.248 | 552.38 | 0.2655 | 25.16 | 24.80 | 26.55 | 25.50 | 2 |
| Rhizophoraceae | Rhizophora mucronata Lam. | 0.240 | 735.71 | 0.2565 | 33.51 | 24.00 | 25.65 | 27.72 | 1 |
| Rhizophoraceae | Rhizophora stylosa Griff. | 0.008 | 28.57 | 0.0010 | 1.30 | 0.80 | 0.10 | 0.73 | 8 |
| Rubiaceae | Scyphiphora hydrophylacea C.F. Gaertn. hydrophylacea | 0.008 | 4.76 | 0.0002 | 0.22 | 0.80 | 0.02 | 0.34 | 11 |
| Sonneratiaceae | Sonneratia alba Sm. | 0.120 | 147.62 | 0.1865 | 6.72 | 12.00 | 18.65 | 12.46 | 4 |
| Meliaceae | Xylocarpus granatum J. Koenig. | 0.008 | 16.67 | 0.0038 | 0.76 | 0.80 | 0.38 | 0.65 | 9 |
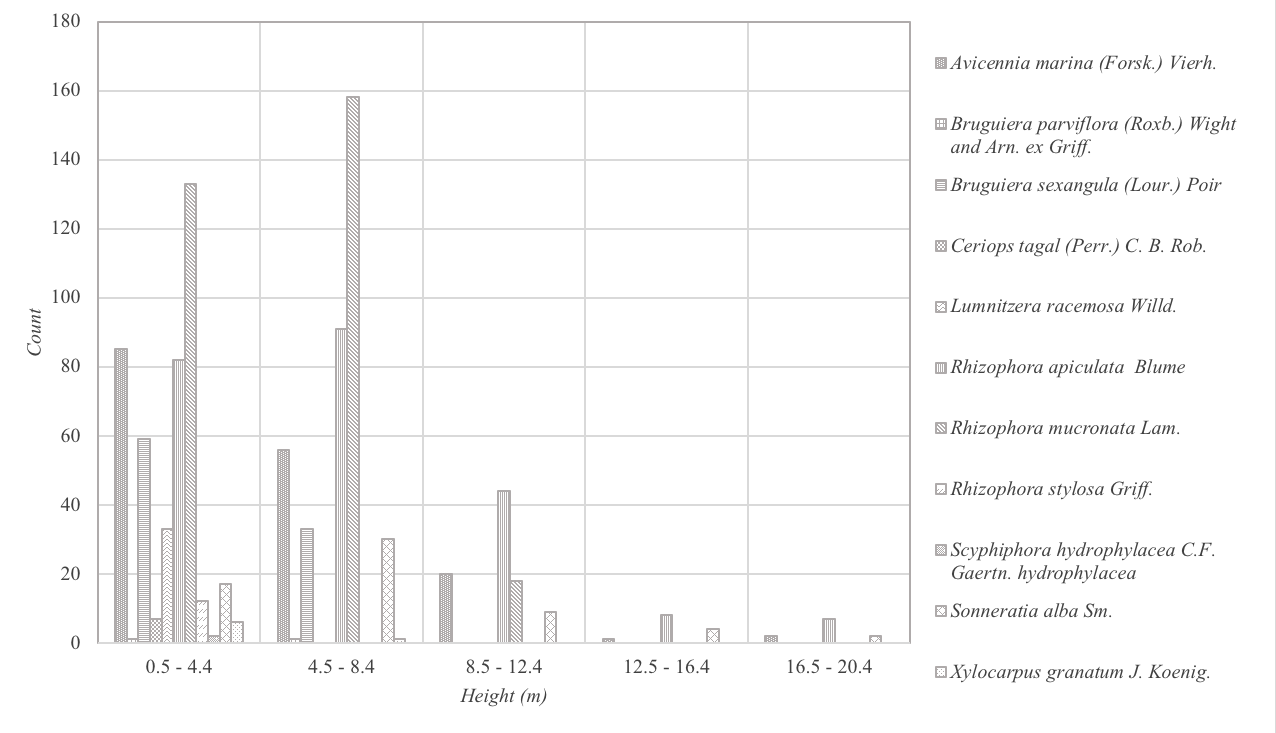
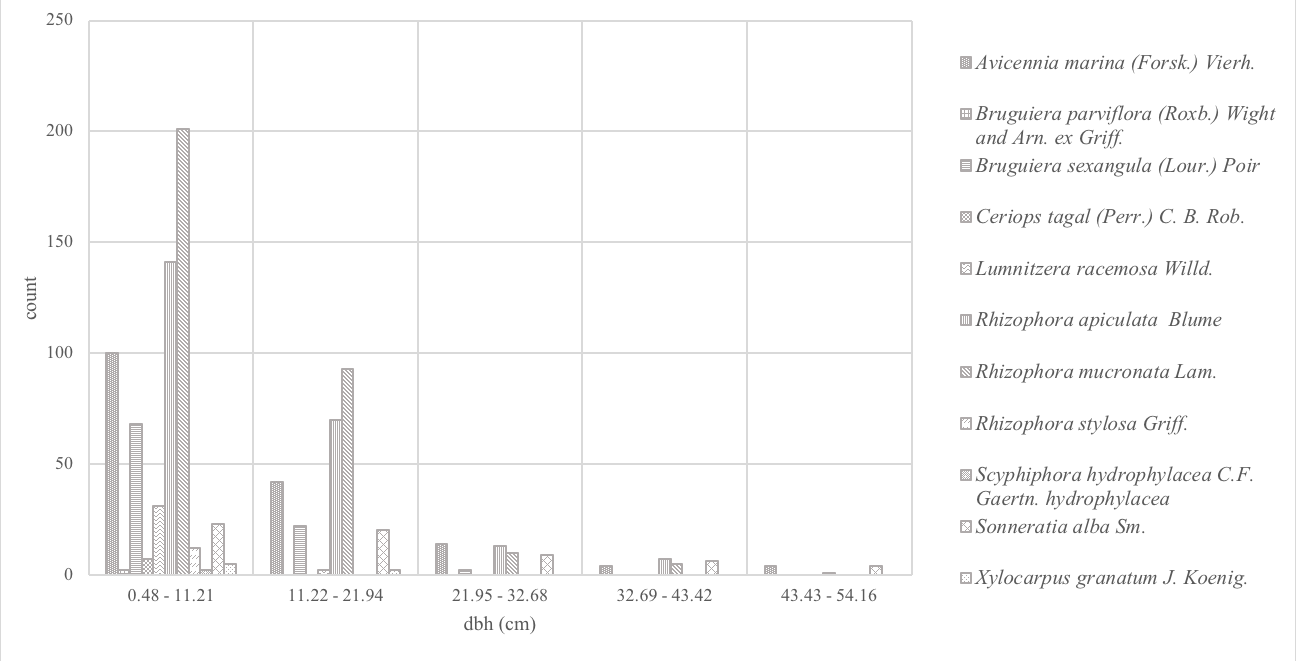
Figures 4–5 show the height and dbh distributions of mangrove species in meters and centimeters respectively. Height distribution analysis showed that eighty-eight percent (88%) of the mangroves were <8.5m high and mostly consisted A. marina, R. apiculata and R. mucronata. Very few tall trees (16m above high) were encountered and this comprised only 1% of the total population. The tallest mangroves recorded were 20m high and were from A. marina, R. apiculata, and S. alba. For the dbh distribution (Figure 6), more than half of the trees (64%) were very small with dbh of <11.22cm. Likewise, very few (<1%) large-trunked mangroves, with 43.4cm dbh were. The highest dbh recorded was 54.11cm from an A. marina. Results of height and dbh distributions indicated disturbance and therefore classify the mangroves as secondary growth forest.
Vegetation clusters/Mangrove clusters
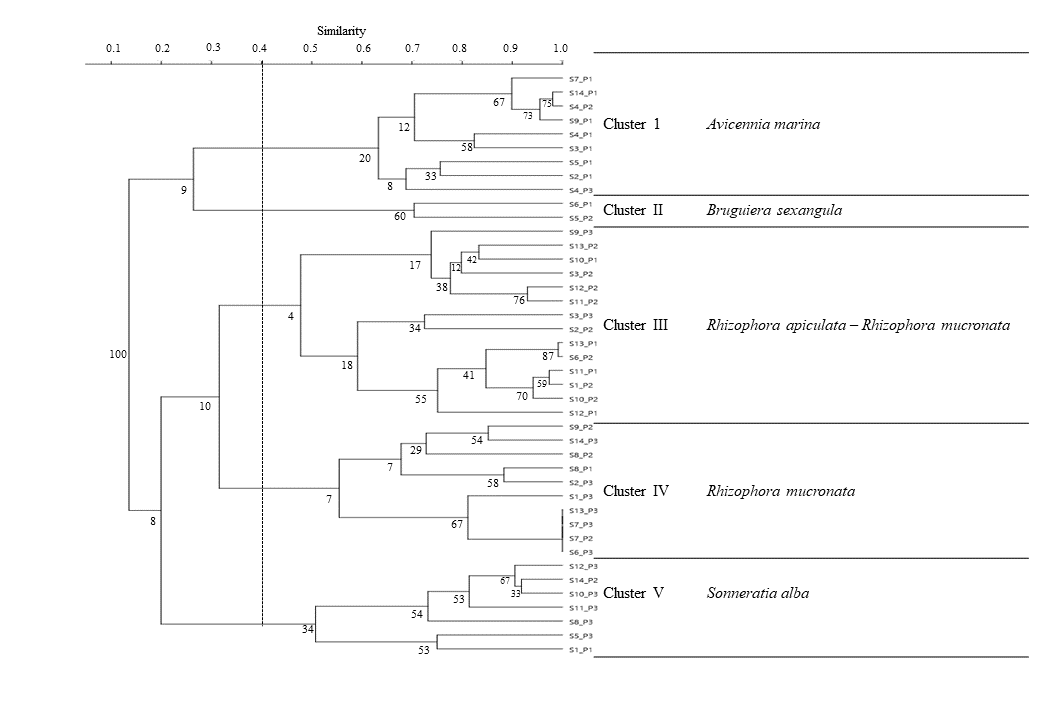
Hierarchical cluster analysis of plots resulted in five (5) distinct clusters as shown in the dendrogram in Figure 6. These were: Cluster I – Avicennia marina (Forsk.) Vierh.; Cluster II – Bruguiera sexangula (Lour.) Poir.; Cluster III – Rhizophora apiculata Blume and Rhizophora mucronata Lam.; Cluster IV – Rhizophora mucronata Lam; and Cluster V – Sonneratia alba J. Smith. The clusters were arranged according to mangrove zones. Clusters I and II were commonly found in the landward zone. Meanwhile, Clusters III and IV occupied a wide range of habitats but were commonly found in the middleward or seaward zones. Cluster V, on the other hand, was mostly found in the seaward zone.
Cluster I: Avicennia marina (Forsk.) Vierh. Cluster
Cluster I was composed of nine plots, most of which were in the landward zone (Figure 7). This cluster had two branches at a 0.65 similarity level: A. marina and A. marina – R. apiculata (Figure 6). The A. marina branch was an A. marina dominated zone mixed with L. racemosa, R. mucronata, R. apiculata, and C. tagal. On the other hand, the A. marina – R. apiculata branch was dominated by both A. marina and R. apiculata and was also mixed with other mangroves: B. sexangula, S. alba, and C. tagal. Substrate for this cluster ranged from silty clay-loam to sandy substrate. There were 194 mangrove individuals and 7 mangrove species found in this cluster: A. marina, B. sexangula, C. tagal, L. racemosa, R. apiculata, R. mucronata, and S. alba. A majority (66%) of the mangrove population in this cluster was 0–4m tall. The highest height recorded was 11m from an A. marina. Likewise, 73% of individuals had a dbh of 2.86–11.84cm. The highest dbh recorded was 47.75cm from an A. marina. The diversity index for this cluster was 2.67.
Cluster II: Bruguiera sexangula (Lour.) Poir Cluster
This cluster was composed of only two plots and thus the smallest in terms of number of plots (Figure 6). It was characterized by sandy loam to silty clay-loam substrate and was located in the upper intertidal zone which was suitable for B. sexangula, the dominant species in this cluster (Figure 8). There were only 51 mangrove individuals and six (6) mangrove species found in this cluster: A. marina, B. parviflora, B. sexangula, L. racemosa, R. apiculata, and S. hydrophylacea. Most (47%) of the trees in this cluster stand 1–3.2m tall. The highest height recorded was 7.5m from an A. marina. Most (45%) individuals had a dbh of 3.18–7.64cm (45%). The highest dbh recorded was 25cm from a B. sexangula. The diversity index was 2.47.
Cluster III: Mixed Rhizophora apiculata Blume and Rhizophora mucronata Lam. Cluster
This cluster was composed of 14 plots and therefore the largest among the clusters in terms of the number of plots as shown in Figure 6. There were two distinct branches for this cluster at a 0.55 level of similarity: R. mucronata – R. apiculata – A. marina and R. apiculata. Similar to Cluster I, there was an overlap of three mangrove zones: landward, middleward, and seaward. A majority of the plots were in the middleward zone (Figure 9). There were 268 mangrove individuals and 7 mangrove species found in this cluster. These were: A. marina, B. sexangula, R. apiculata, R. mucronata, S. alba, X. granatum and C. tagal. A majority (63%) of the mangroves in this cluster were within the height range of 0.8–7.2m. The highest height recorded was 20m both from a R. apiculata and A. marina. For the dbh distribution, 64% had dbh of 3.18–13.37cm. The highest dbh recorded was 54cm from an A. marina. The diversity index for this cluster was 2.61.
Cluster IV: Rhizophora mucronata Lam. Cluster
There were ten (10) plots in this cluster (Figure 6). There were also two distinct branches in this cluster: R. mucronata – R. apiculata and R. mucronata at a 0.55 level of similarity. Most of the plots in this cluster were located in the seaward zone with a few in the middleward which was characterized by sandy to silty clay-loam substrate. There were 292 mangrove individuals and 6 species of mangroves found in this cluster. These were: A. marina, B. sexangula, R. apiculata, R. mucronata, and R. stylosa. Most of the mangroves in this cluster (68%) stood 1–5.3m high. The highest height recorded was 14m from a S. alba. Dbh distribution showed that 63% had a dbh of 2.55–9.55cm. The highest dbh recorded was 37.56cm from a R. mucronata. The diversity index was 1.7.
Cluster V: Sonneratia alba Sm. Cluster
There were seven plots comprising this cluster and a majority were in the seaward zone (Figure 11). Cluster V had two prominent branches at a 0.65 level of similarity: S. alba and mixed of S. alba – A. marina – B. sexangula. Substrate in this cluster was characterized as sandy, sandy loam to sandy clay-loam. There were 117 mangrove individuals from five (5) species of mangrove in this cluster: A. marina, B. sexangula, R. apiculata, R. mucronata, and S. alba. A large portion (78%) were <7.4m tall and the highest height recorded was 20m from a S. alba. 52% of the mangroves in this cluster had dbh of 0.48–10.76cm. The highest dbh recorded was 51.88cm from a S. alba. Diversity index for this cluster was 3.05.
2. Relationship between physical processes and island vegetation
Distance between plots and distribution of mangrove species across edaphic characteristics of Manamoc Island
The scatterplot diagram (Figure 12) shows the distance between plots and the distribution of mangrove species across edaphic factors in Manamoc Island. Plots sharing the same species composition were plotted close to each other and near to the shared mangrove species. Plots in Cluster I (S7_P1, S14_P1, S4_P2, and S9_P1) were plotted very close to each other and grouped around A. marina. Similarly, plots in cluster III, IV, and V were dominated by R. apiculata, R. mucronata, and S. alba respectively. Plots S11_P1, S1_P2, S10_P2, S13_P1, and S6_P2 were plotted very close to each other and clustered around R. apiculata. Plots S12_P3, S14_P2, S10_P3, S11_P3, and S8_P3 were plotted close to each other and clustered around S. alba. Plots in Cluster III which had co-dominants: R. apiculata and R. mucronata were plotted in between these species. Plots in Cluster II however behaved differently. The plots did not cluster around the dominant species, B. sexangula, but instead were plotted near to B. parviflora. Species plotted near the edge of the diagram indicated rare distribution i.e. B. sexangula.
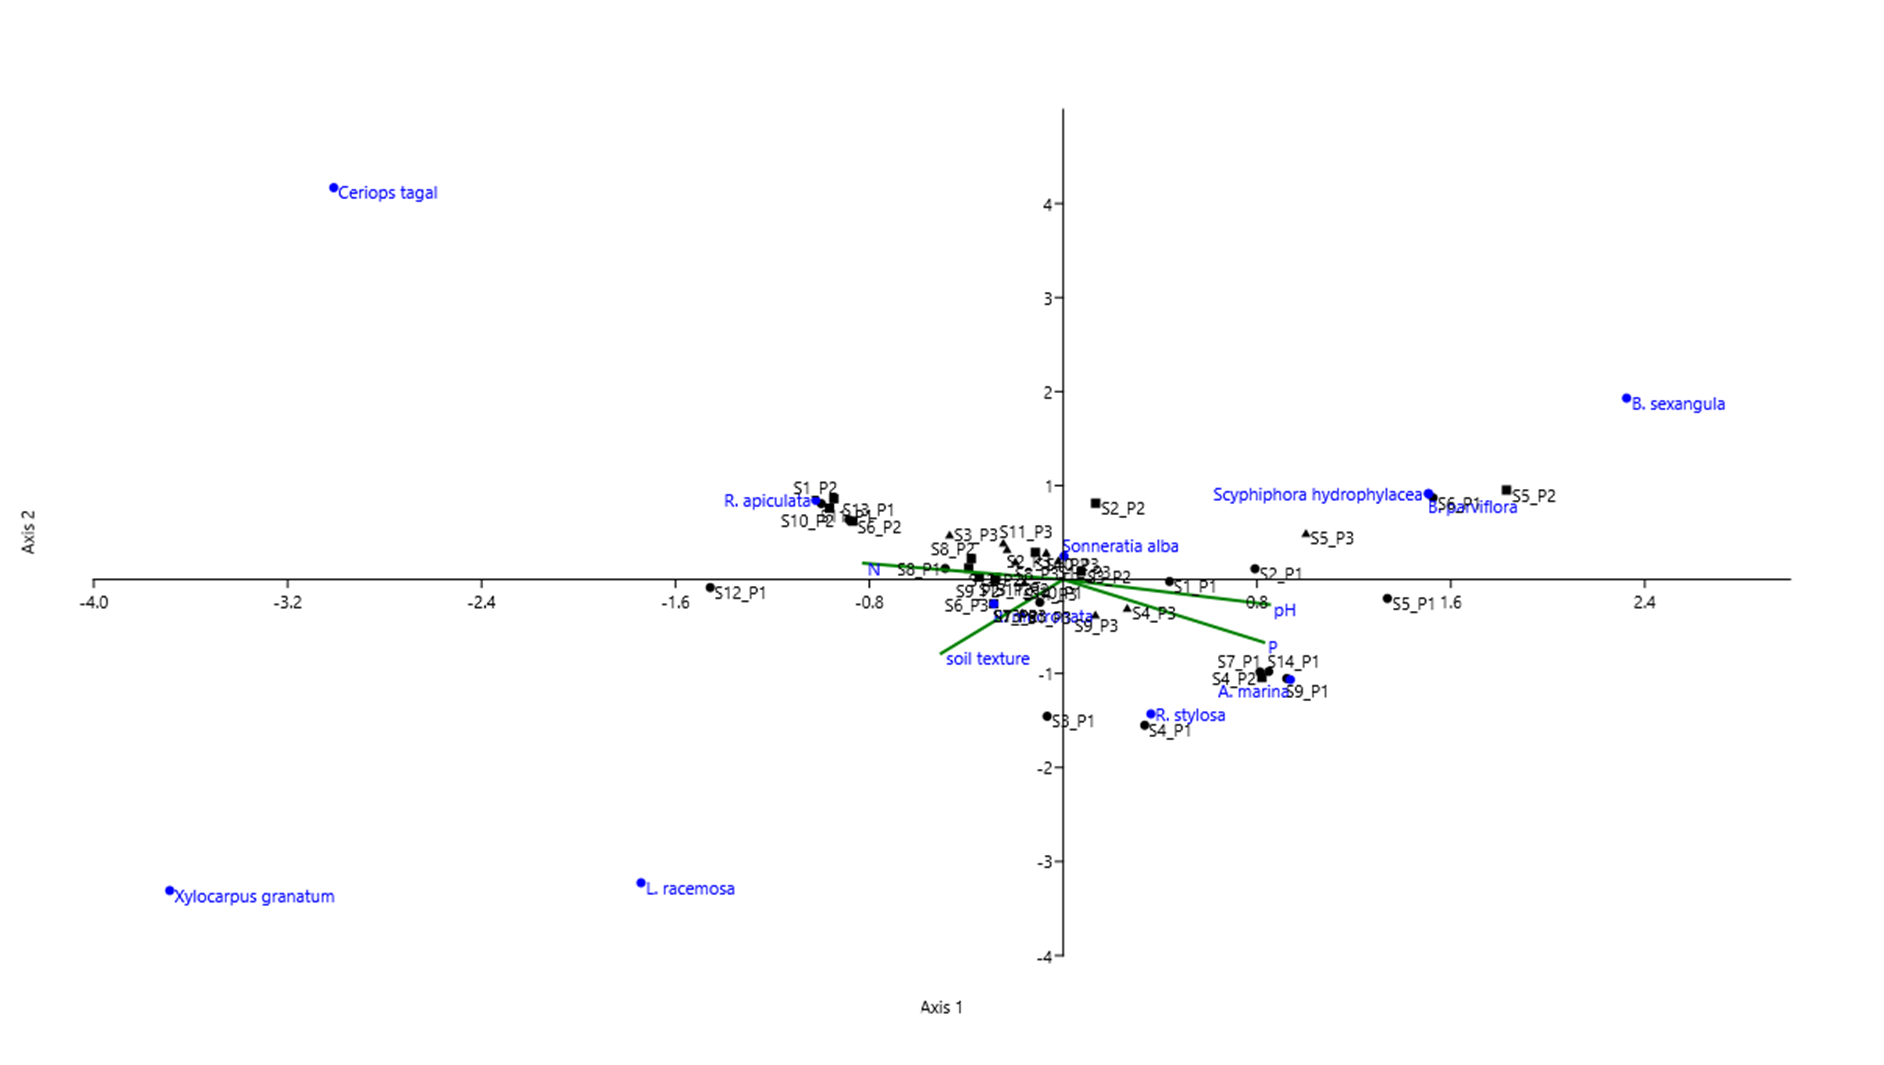
Figure 12 also shows the edaphic factors affecting the distribution of mangrove species specifically soil texture, pH, N, and P. Avicennia marina and R. stylosa were positively correlated with pH and the macro nutrient Phosphorous (P) but were negatively correlated with the macro nutrient N. Both R. apiculata and R. mucronata were positively correlated with macro nutrient N but were negatively correlated with P and pH. L. racemosa, R. stylosa, and R. mucronata were positively correlated with soil texture which means this species preferred coarse soil texture i.e. sandy soil. In contrast, S. alba, B. parviflora, B. sexangula, and S. hydrophylacea were negatively correlated with soil texture which means these species preferred fine soil texture i.e. silty clay. Species plotted at the edge of the diagram i.e. B. sexangula, Ceriops tagal, Xylocarpus granatum, and L. racemosa were either with rare distribution or occupying relatively extreme soil parameters.
Other physical processes affecting the distribution of mangrove species
Aside from the edaphic characteristics of Manamoc Island, other physical processes also affect the distribution of mangroves directly and indirectly. These are: wind, waves, tides, rainfall, and temperature. As mentioned earlier, Manamoc has a Type I climate (Figure 2). It is characterized by a dry season from the months of November to April and wet season from the months of May to October (Figure 2). The average annual rainfall was 2,136mm which can be considered a median compared to the nationwide rainfall distribution that ranges from 965mm to 4,064mm (PAG-ASA, 2016). Although mangroves can tolerate salinity, fresh water is still needed for the physiological processes. During wet season, a short-lived supply of run-off water flows downhill to the mangroves (locally known as bangalog) and thus replenish the freshwater needed by the mangroves. Meanwhile, during dry season, mangroves can only get water seeping from underground. This is only possible during low tide where seawater retreats and thus freshwater from the underground flows to the mangroves. Therefore, aside from the rainfall, tides also play an important role for the mangroves. Tide do not only help facilitate groundwater movement, tides also bring nutrients and sediments necessary for the establishment of mangrove propagules. Being a small island, Manamoc has a limited supply of nutrients coming from the terrestrial habitat. It also lacks a river to supply sediments and nutrients to the mangroves like most of the mangroves in other places. Tides and waves bring nutrients and sediments from offshore. Table 2 shows the tide characteristics affecting Manamoc Island. Mean tide level was 1.82m. The mean highest high water (MHHW) level was 2.54m and the mean lowest low water (MLLW) was 1.19m.
| MHHW | MHW | Mean tide level | MLW | MLLW |
|---|---|---|---|---|
| 2.54 | 2.21 | 1.82 | 1.49 | 1.19 |
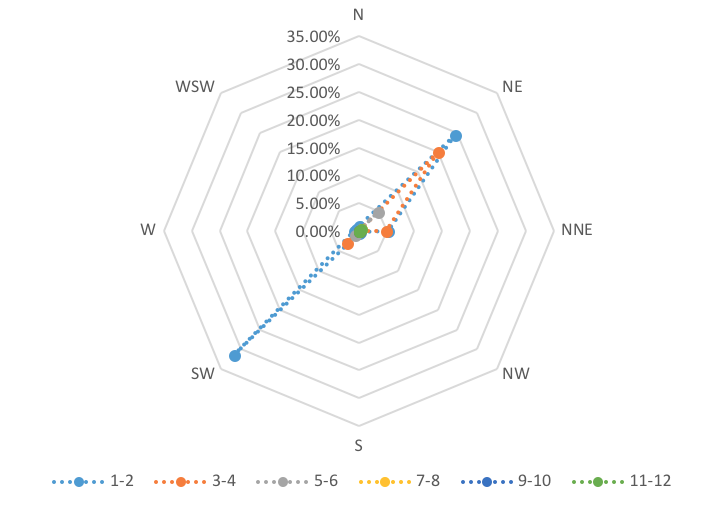
Another factor affecting the distribution of the mangroves was the prevailing wind. Figure 13 shows the windrose diagram. There were three (3) prevailing winds affecting Manamoc Island: NE, SW, and NNE. Normal wind speed ranged from 1–2ms-1 to an extreme of 11–12ms-1.
Strong winds resulted in high and forceful waves. Thus, in the mangrove area exposed to this, only the frontliner species such as S. alba. This was the case in Kanike area where most of the S. alba can be found.
3. Mangroves and coastal retreat
Analysis of sand cover change has shown that a total of 18,000m2 water to sand change has been detected in the upper left portion of Manamoc Island from 1989–2016 as shown in Figure 14. Most of these changes were at the mouth of the lagoon, the northwest section, which is adjacent to the mangrove forest. Similarly, a total of 50,400m2 of water to sand has been detected in the southern section of Manamoc Island during the same span of time (Figure 15). Most of these changes were observed at the mouth of the lagoon, adjacent to the mangrove forest.
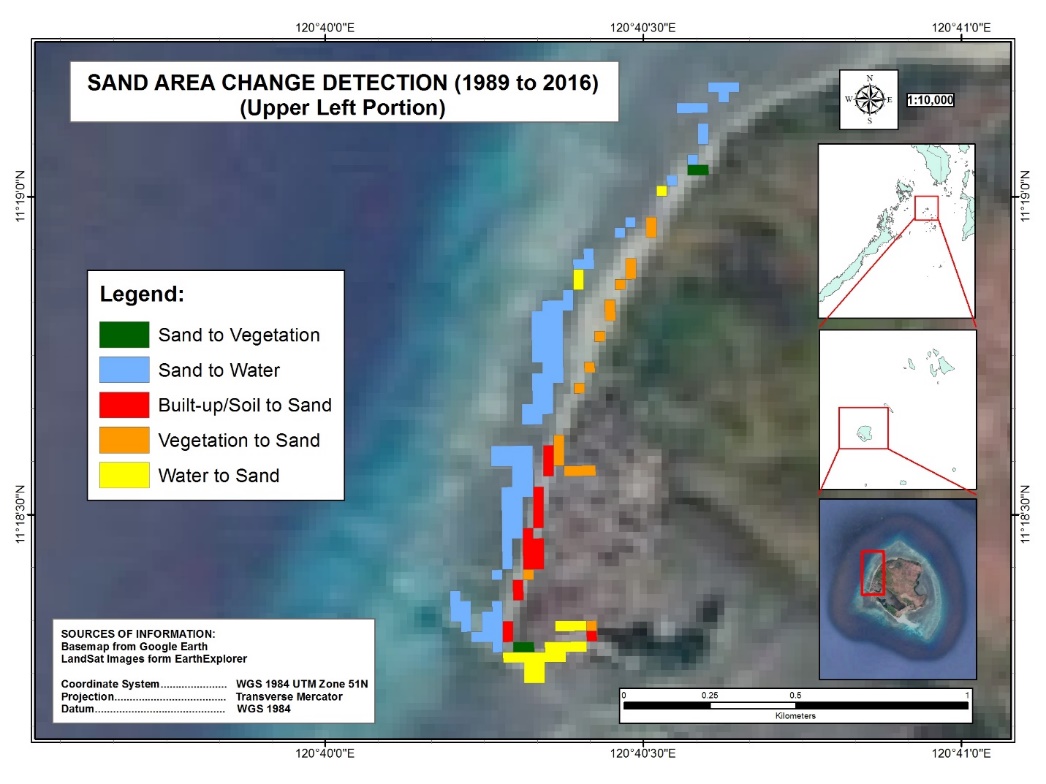
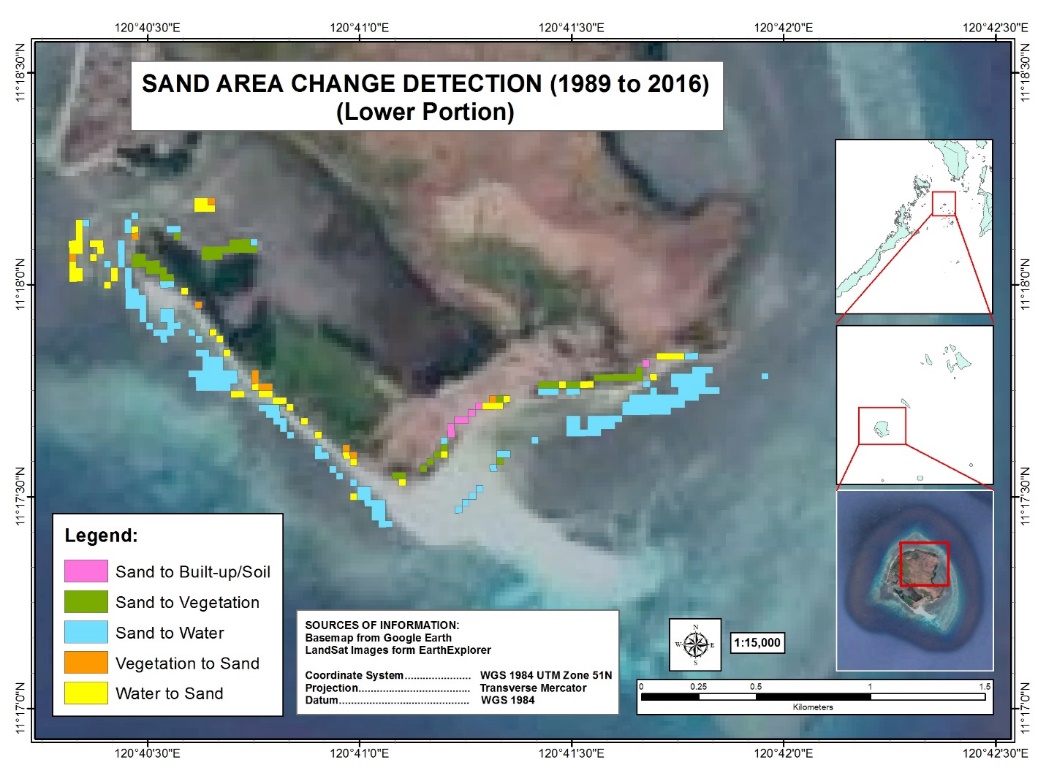
Results from KII have revealed that the upper section of the mouth of the lagoon (Figure 14 inside the purple box) was already observed to be retreating way back in 1990’s. Incidentally, the communal cemetery was located at this area. Out of fear of losing the cemetery, the people started to reforest this area by planting mangroves in front of the cemetery about fifteen years ago or more. The mangrove cover increased in this area and incidentally, the sand cover also increased. According to the locals, the sand stopped retreating and the sand cover increased instead. Similar changes have been observed at the lower section of the mouth of the lagoon (Figure 15 inside the purple box). Although no reforestation has been done in this area, the proclamation of the Province of Palawan as a mangrove reserve helped in the increase of mangrove cover. Results of both sand cover change and KII imply that mangroves mitigate coastal retreat and helped increased sand cover.
Discussion
Floristic character, species diversity, and human disturbances
Out of the 39 true mangrove species in the Philippines (Sinfuego & Buot, 2008), 11 were found on Manamoc Island. This number was relatively high compared to the results of previous studies conducted by UP-MSI in 2002 (unpublished) and the Palawan Council for Sustainable Development (PCSD) in 2003 (Table 3). The former reported 7 species whereas the latter reported 5 species of mangroves (Table 3). The previous studies did not include the following species: C. tagal, S. hydrophylacea and L. racemosa.
The diversity index shows that mangroves on Manamoc island were relatively more diverse than those in Puerto Princesa City Palawan which had H’ values ranging from 0.35–0.91 (Galon et al., 2016) using the same diversity index. Dominance analysis shows that R. mucronata Lam. was the most dominant mangrove species on the island. This was due to the species’ high density and frequency.
| Mangrove species | UP-MSI (2002) | PCSD (2003) |
|---|---|---|
| Avicennia marina (Forsk.) Vierh. | ✓ | ✓ |
| Bruguiera gymnorhiza (L.) Lam. | ✓ | ✓ |
| Rhizophora apiculata Blume | ✓ | ✓ |
| Rhizophora mucronata Lam. | ✓ | ✓ |
| Rhizophora stylosa Griff. | ✓ | ✓ |
| Sonneratia alba Sm. | ✓ | ✓ |
| Xylocarpus granatum J. Koenig. | ✓ |
The diversity index was impressive given that Manamoc is a small island and very isolated from possible sources of mangrove species. In the country, Palawan is among the provinces with the largest remaining primary mangrove forest (Becira, 2005). In 1981 under the presidential Proclamation No. 2152, the entire province of Palawan was declared as mangrove reserve along with other areas in the country (Melana et al., 2005), 2017). This in particular has contributed to the preservation of mangroves in the entire province including its island municipalities thus maintaining its diversity.
The mangroves in Manamoc Island were of secondary growth as indicated by the dbh and height distribution (Figures 4 and 5). This is primarily because of anthropogenic activities. Geographically, Manamoc and its neighboring islands are isolated from the mainland of Palawan therefore, basic needs in particular fuel energy are harvested from the island. Mangroves were used as fuel, charcoal, and for house construction. Prior to the proclamation of the Province of Palawan as a mangrove reserve, cutting of mangroves was rampant. Furthermore, during the 80’s and 90’s, salt-making was among the major sources of income on the island. Areas of mangroves were cut and replaced with salt ponds. Later, seaweed farming was also introduced to the island. Mangroves were cut to use as posts for the mainline of seaweed farm. Around that time, fishpond was also considered as an alternative source of livelihood for the residents of Manamoc. Approximately 2,500 sq. m of mangrove area was cleared. Unfortunately, the plans did not materialize, and no efforts were made to restore area. Conversion of mangroves to fishponds was the major cause of mangrove degradation in the country (Melana, Melana, & Mapalo, 2005). All of these have contributed to the degradation of mangrove forest on the island and resulting to low dbh and height. Because of the human activities some species may have become locally extinct. Currently, illegal cutting of mangrove is still prevalent in the island.
Mangrove zonation as affected by the different environmental factors including coastal processes
The clustering pattern of mangrove species in Manamoc Island was highly affected by the island’s physical characteristics such as but not limited to edaphic, climatic, and topographic features. CCA showed how edaphic characteristics have affected the distribution of mangroves. Some species preferred clay soil such as the R. mucronata while some preferred sandy soil such as L. racemosa and X. granatum. In Panay Island, Philippines, both R. mucronata and L. racemosa grow in sandy and muddy substrate as reported by Primavera (2009). In Puerto Princesa, Palawan, R. apiculata and R. stylosa were found on a muddy substrate (Becira, 2005). Further, other mangrove species preferred basic soil while others tolerated acidic soil. According to Hossain and Nuruddin (2016), mangrove species had an optimum pH range except for A. marina. In this study, soil pH ranged from 6.4–7.6. Hossain & Nuruddin (2016) reported that mangrove soils may be either acidic or basic, ranging from 2.87–8.22 but typically acidic. Soil pH is among the environmental factors that regulate the growth of species and zonal distributions of mangroves (Wakushima, Kuraishi, & Sakurai, 1994). Some species were clustered with other species while others do not. Some species were in the seaward zone such as S. alba while others at the back or landwards such as Avicennia and Bruguiera species. Others were in the middle zone such as the Rhizophora species.
According to Hogarth (2015) species distribution and zonation pattern of mangroves are results of the interaction between competition and a physical gradient. Zonation of mangroves species reflects the ecophysiological response of the plants to one or a series of environmental gradients (Woodroffe, 1992). It is the combination of factors such as frequency and duration of inundation, waterlogging of substrate, pore water salinity and pore water potential, that determines which plants grow where (Woodroffe, 1992). These gradients respond directly or indirectly to the landform patterns and the physical processes (Woodroffe, 1992). This was evident on Manamoc Island as shown in Figures 6 and 12. There were 5 distinct clusters. Despite the small size of the island and very thin strip of mangroves, the zonation patterns on Manamoc still followed the usual mangrove zonation pattern. Clusters I and II were dominated by landward species: Avicennia and Bruguiera. A. marina however occupies a wide range of zones as it is known to be a seaward species too. It occurs in low to middle tidal level and from sandy, muddy or coralline substrate while B. sexangula is mostly found in high tidal level with substrate hard mud, sandy-muddy (Primavera, 2009). Clusters III and IV were composed of middleward to seaward species: R. apiculata and R. mucronata. These two species occur at low to mid intertidal marine and the substrate was muddy for R. apiculata and sandy to muddy for R. mucronata (Primavera, 2009). Cluster V was dominated by S. alba, a frontline species with high salinity tolerance and found mostly in the low to mid-intertidal in the seaward zone with coralline to muddy substrate (Primavera, 2009).
This zonation pattern was unexpected for a small island whose mangrove area was just a thin strip that was usually inundated by seawater since this zonation pattern is commonly observed in large mangrove forests where the zonation is very distinct. Though differing by location and forest type, this was similar to the altitudinal zonation pattern observed by Buot and Okitsu (1998). They observed that the zonation patterns of mountains in the Philippines were the same although they differed in terms of distances or coverage per zone.
Edaphic characteristics were not the only environmental factors that affected the zonation of mangroves, but the climatic and the physical processes did so as well. The climatic factors, temperature, and rainfall were among the limiting factors for the distribution of mangroves. Mangroves usually grow in a tropical environment and like most of the plants, need freshwater for their physiological processes. Thus, sufficient rainfall is needed. Also part of the climatic characteristics was the monsoon. The southwest monsoon brings rains to the island and thus replenish the freshwater supply. The northeast monsoon results to strong winds and waves, thus bringing sediments and nutrient from offshore and other neighboring islands. Waves and tides also play a role in the distribution of nutrients. The tide, as previously mentioned affects the underground freshwater supply for the mangroves during the dry season.
In addition, topographic features of the island played a role in the distribution of the mangroves. Noticeably, most of the mangroves grow in the embayment areas of the island the largest of these being the perimeter of the lagoon. The lagoon was protected from strong waves and winds, allowing the growth and reproduction of the mangroves. The eastern part of the island was also an embayment which was partly protected against strong waves and winds. The sediments and nutrients needed by the plants were trapped in the embayment and thus became suitable for mangrove colonization.
Mangroves as agents in mitigating coastal retreat
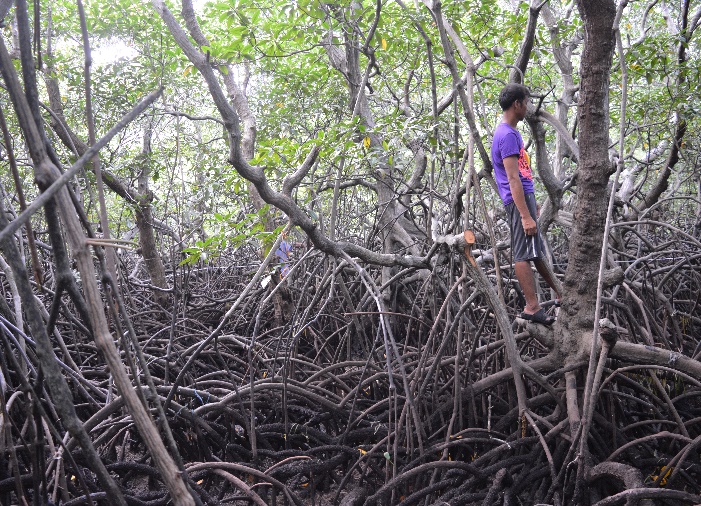
Data shows that mangroves mitigated coastal retreat of Manamoc Island specifically at the mouth of the lagoon. Studies of Horstman, et al. (2014) and Mazda et al. (1997) on mangroves have shown that they can mitigate coastal retreat. The complex root system of mangroves as well as the trunk reduced the impact of the waves. Moreover, the complex root system effectively trapped the sediments. This may be the case with Manamoc Island. The increased in sand cover may be due to the increased mangrove cover. However, the mangroves of Manamoc Island are very thin in terms of cover and they are mostly young trees as shown in Figures 4 and 5. According to Mazda et al., (1997), drag force in young mangrove was barely effective. Therefore, the density of mangroves as well as their height are critical factors for the effectivity of mangroves mitigating coastal retreat.
Conclusion
Mangroves as part of the coastal ecosystem are affected by the physical processes such as tides, winds, and rainfall are involved in shaping the coastline. Mangrove species orient across the environmental gradient suitable for their survival and reproduction as shown in the zonation of mangroves in Manamoc Island. Mangrove zonation is similar to other areas in the Philippines despite of the islands’ small area. In areas with less sediments and strong currents, mangroves cannot colonize. But data in this study showed that mangrove are effective agents in mitigating coastal retreat of Manamoc Island.
Acknowledgments
The authors are thankful for the assistance and support of the following: University of the Philippines Los Baños (UPLB) Graduate School; DOST-ASTHRDP; UPLB–School of Environmental Science and Management (SESAM); Plant Systematics Laboratory (Plant Biodiversity Laboratory), Institute of Biological Sciences, College of Arts and Sciences, University of the Philippines Los Baños; The Andres Soriano Foundation, Inc. (ASF); and Western Philippines University (WPU).
References
- Ahmad, M. H., & Pheng, C. S. (2013). A Laboratory Study on Wave Reduction by Mangrove Forests. Elsevier B.V. APCBEE Procedia, 27 – 32.
- Becira, E. (2005). State of mangrove in Tiniguiban Cove, Puerto Princesa City, Palawan. Science Diliman, 17:2, 46-51.
- Buot, I. J., & Okitsu, S. (1998). Vertica distribution and structure of the tree vegetation in themontane forest of Mt. Pulog, Cordillera mountain range, the highest mountain in Luzon Is., Philippines. Vegetation Science, 19-32.
- Capili, E., Ibay, A., & Villarin, J. (2005). Climate Change Impacts and Adaptation on Philippine Coasts. Proceedings of International Oceans(pp. 1-8). Washington D.C.
- Cinco, T. A., Guzman, R. d., Ortiz, A. M., Delfino, R. J., LAsco, R., Hilario, F., Ares, E. (2016). Observed trend and impacts of tropical cyclones in the Philippines. International Journal of Ecology.
- Cruz, E., Primavera, J., & Santos, J. C. (2011). Engineering Analysis for a mangrove planting site - towards a sustainable community-engaged coastal protection program in the Philippines. Retrieved from www.irbnet.de: www.irbnet.de/daten/iconda/CIB_DC26751.pdf Date accessed: August 2016
- Duke, N. C. (1992). Mangrove Floristics and Biogeography. In A. I. Robertson, & D. M. Alongi, Tropical Mangrove Ecosystems(pp. 63-100). Washington D.C.: American Geophysical Union.
- Galon, F., Dolorosa, R., Sespene, J., & Mendoza, N. (2016). Diversity and structural complexity of mangrove forests along PPC Bay, Palawan Island, Philippines. Journal of Marine Island and Cultures, 118-125.
- Hogarth, P. J. (2015). The Biology of Mangroves and Seagrasses.York: Oxford University Press.
- Horstman, E., Dohmen-Janssen, C., Narra, P., Berg, N. V., Siemerink, M., & Hulscher, S. (2014). Wave attenuation in mangroves: a quantitative approach to field observations. Coastal Engineering , 94 (2014) 47-62. www.elsevier.com/locate/coastaleng.
- Hossain, M., & Nuruddin, A. (2016). Soil and mangrove. Journal of Environmental Science and Technology, 198 - 207.
- Mazda, Y., Magi, M., Kogo, M., & Hong, P. N. (1997). Mangroves as a coastal protection from waves in the Tong King Delta, Vietnam. Mangroves and Salt Marshes, 127-135 .
- Melana, D., Melana, E., & Mapalo, A. (2005). Mangroves management and development in the Philippines. SEAFDEC, 39-47.
- Ohsawa, M. (1984). Differentaiton of vegetation zones and species strategies in the subalpine region of Mt. Fuji. Vegetation, 15-52.
- PAG-ASA. (2016, February 9). PAG-ASA. Retrieved from Philippine Atmospheric, Geophysical and Astronomical Services Administration: https://www1.pagasa.dost.gov.ph/index.php/27-climatology-and-agrometeorology
- Primavera, J. H. (2009). Field Guide to Philippine Mangroves.Ilo-ilo City: Philippine Tropical Forest Conservation Foundation, Inc. (PTFCF) and ZSL-Philippines and Foundation for Communication Initiatives (FOCI).
- Roebeling, P. C., Costa, L., Magalhães-Filho, L., & Tekken, V. (2013). Ecosystem service value losses from coastal erosion in Europe: historical trends and future projections. J Coast Conserv, 17:389–395 Springer Science+Business Media Dordrecht 2013.
- Sinfuego, K. S., & Buot, I. J. (2008). Floristic Compostion and Analysis of the True Mangrove Vegetation in the Philippines Islands. Journal of Nature Studies, 7(2): 83-90.
- Spellerberg, I. F., & Fedor, P. J. (2003). Blackwell Science, Ltd A tribute to Claude Shannon (1916–2001) and a plea for more rigorous use of species richness, species diversity, and the 'Shannon-Weiner' Index. Global Ecology & Biogeography, Vol. 12, 177–179.
- Tan, K. H. (2005). Soil sampling, preparation, and analysis 2nd edition.Florida, USA: Taylor and Francis Group.
- Thien, S. (1979). A flow diagram for teaching texture-by-feel analysis. Journal of Agroeconomic Education, 8:54-55.
- Tolentino, P. L., Poortinga, A., Kanamaru, H., Keesstra, S., Maroulis, J., David, C. P., & Ritsema, C. J. (2016). Projected Impact of Climate Change on Hydrological Regimes in the Philippines. PLoS ONE, 1-14.
- UP-MSI. (2002). Ecological Habitat Assessment in Northern Palawan. PATH Foundation Inc.
- Wakushima, S., Kuraishi, S., & Sakurai, N. (1994). Soil salinity and pH in Japanese mangrove forests and growth of cultivated mangrove plants in different soil conditions. Journal of Plant Research, 39 - 46.
- Winterwerp, J. C., Borst, W. G., & De Vries, M. B. (2005). Pilot study on the erosion and rehabilitation of a mangrove mud coast. Journal of Coastal Research, 21 (2), 223-230. West Palm Beach, Florida, ISSN 0749-0208.
- Woodroffe, C. (1992). Mangrove Sediments and Geomorphology. In A. Robertson, & D. Alongi,Coastal and Estuarine Studies: Tropical Mangrove Ecosystems(pp. 7-41 Vol. 41). Washington D.C., USA: American Geophysical Union.