Spatial analysis of human population distribution and growth in Marinduque Island, Philippines
Department of Community and Environmental Resource Planning, University of the Philippines Los Baños, College of Human Ecology, College 4031, Laguna, Philippines arsalvacion@up.edu.ph
Institute of Biological Sciences, College of Arts and Sciences, University of the Philippines Los Baños, College 4031, Laguna, Philippines
Abstract
This study assessed the spatial distribution of population growth of Marinduque, an island province in the heart of the Philippines. Based on the results, population of the province varies across time and space while densely populated areas are concentrated in coastal, flat and relatively flat regions. From 1990–2010, majority of the villages in the province experienced an increase in population. Global Moran’s I test on the change in population and population growth rate suggests there is spatial clustering of these two variables among villages. Local Moran’s I test validated such results and was able to detect several High–High and Low–High clusters of villages.
Keywords
Small island, Spatial analysis, Moran’s I, LISA, Population, Philippines
Introduction
Small islands are composed of small land masses surrounded by ocean and are commonly prone to either hydrological and geological disasters (Mimura et al., 2007; Polido et al., 2014). According several researchers (i.e. Nagarajan, 2006; Polido et al., 2014; Pungetti, 2012), small islands are living laboratories where people can see and experience impact of their actions to the environment and how it affects the entire island system.
Monitoring population growth in small islands is very important because of its limited natural and space resources. High population densities in small islands demand high resources and can also pose threats to the island’s unique biodiversity due to overexploitation and habitat degradation (Leunufna and Evans, 2014; Polido et al., 2014). In addition, growing population exacerbates land-use conflicts, regional/tribal warfare, environmental degradation, and competition for scarce resources (Chi and Ventura, 2011). On the other hand, small population in an island can result to limited pool of skills (Polido et al., 2014). On a larger context, population growth along with composition and distribution is closely linked with land use, land cover, and global climate change which in effect influence the need and demand for policy responses (CHDGC, 1994; Hunter et al., 2000; Salvati, 2012). Also, spatial distribution of populations in connection with settlements location is important for delivering healthcare, distribution of resources, and economic development (Linard et al., 2012).
According to Hachadoorian et al. (2011) population data are naturally spatial because human beings inhabit geographic space. Explicit Investigation of the geography of human population using geographic information system (GIS) complements different demographic methods used to characterize other population measures (Hachadoorian et al., 2011). Rapid advances in geospatial data, new technologies, methods of analysis, and computing power have fueled the increase of interest in adding spatial perspective in the study of human population (Almquist and Butts, 2012; Chi and Ventura, 2011; Matthews and Parker, 2013). Matthews and Parker (2013) reviewed and provided numerous examples of different demographic researches that incorporate spatial perspective.
Analysis of spatial autocorrelation helps to determine relationship among variables in space (Young and Jensen, 2012). To evaluate the degree of similarity of observation across space, global indices of spatial autocorrelation are commonly used (Jackson et al., 2010). Moran’s I is a global index of spatial autocorrelation widely used and tested for studying spatial autocorrelation over the past 50 years (Bae et al., 2008; Jackson et al., 2010; Young and Jensen, 2012; Zhang and Lin, 2007). On the other hand, while global indices like Moran’s I can measure spatial association of the entire data set, use of local indicators for association local spatial clusters (LISA, Anselin, 1995) is needed to identify clusters of high (hot) and low (col) spots across space (Bae et al., 2008; Rossen et al., 2014).
Using the published census data, this paper assessed population distribution and growth at the village level of Marinduque, an island province in the Philippines. The study also used the popular Moran’s I (Moran, 1948) and Local Moran’s I (Anselin, 1995) to evaluate spatial clusters of population growth among villages in the province.
Materials and methods
Study area
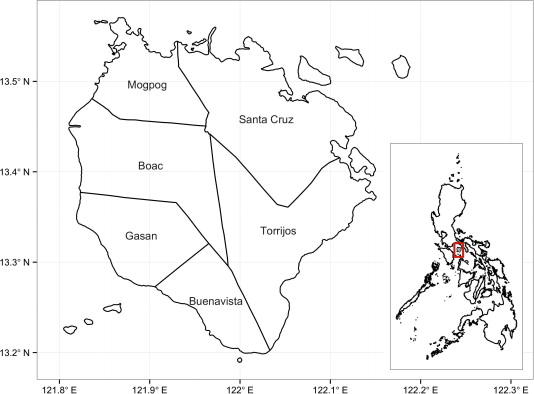
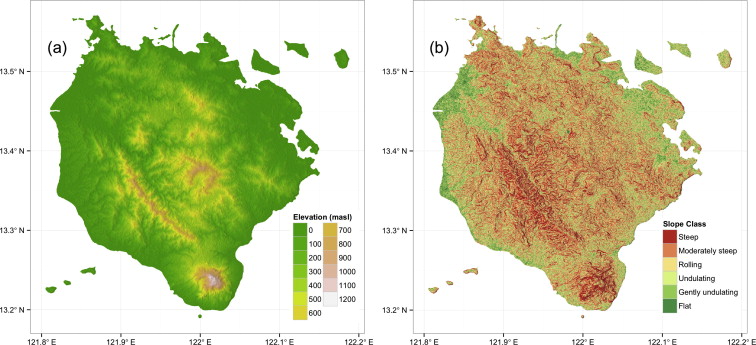
Marinduque is an island province situated around 200 km south of Manila (Fig. 1). The island province is considered the heart of the Philippine archipelago because of its location and geometric shape. Six (6) municipalities consists the province covering around 96 thousand hectares of land (Table 1). Generally, the province topography is hilly and mountainous with rolling and steep slopes (Fig. 2). Farming and fishing are the major source of income in the province. Based on the National Statistical Coordination Board (http://www.nscb.gov.ph), Marinduque is the lowest income province in the region and almost 24% of the province population is under poverty.
| Municipality | Income class | Area (ha) | Percentage of area |
|---|---|---|---|
| Boac | 1st | 21,265 | 22.17 |
| Buenavista | 4th | 7860 | 8.19 |
| Gasan | 3rd | 11,930 | 12.44 |
| Mogpog | 3rd | 8780 | 9.15 |
| Sta. Cruz | 1st | 24,660 | 25.71 |
| Torrijos | 3rd | 21,430 | 22.34 |
Data
Village level population data of Marinduque for the census periods of 1990, 1995, 2000, 2007 and 2010 was obtained from the National Statistics Office (NSO) (http://census.gov.ph) of the Philippine Statistics Authority (PSA) while village GIS boundary map of the province was downloaded from Global Administrative Areas website (http://www.gadm.org/).
Analysis and visualization
Data processing and analysis was carried under R software environment (R Core Team, 2014) using the different packages. Change in population and population growth rate was computed between census data for 1990 and 2010. Population change was calculated as the difference between population count for each village between 1990 and 2010 (Eq. (1)) while population growth rate was calculated as the difference between population count for 2010 and 1990 divided by the total population during 1990 multiplied by 100 (Eq. (2)). Average annual population growth rate from 1990 to 2010 was calculated by dividing the computed growth rate with the number of year difference between the two periods, which is 20 years. Spatial data such as administrative boundary, elevation, and slope were handled and process using maptool (Bivand and Lewin-Koh, 2014) and raster (Hijmans, 2014). Spatial analysis (i.e. global and local Moran’s I test) was carried using spdep (Bivand, 2015). Result from spatial analysis was managed and visualized using plyr (Wickham, 2011), ggplot2 (Wickham, 2009), RColorBrewer (Neuwirth, 2014), and gridExtra (Auguie, 2012) packages.
Results
Population, population density, population growth
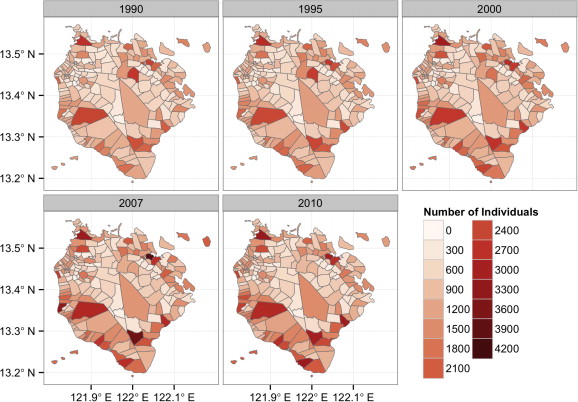
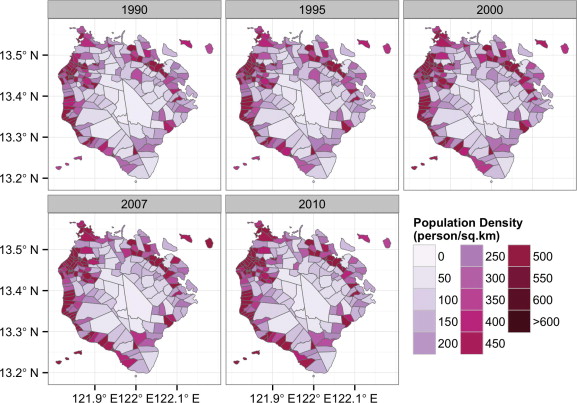
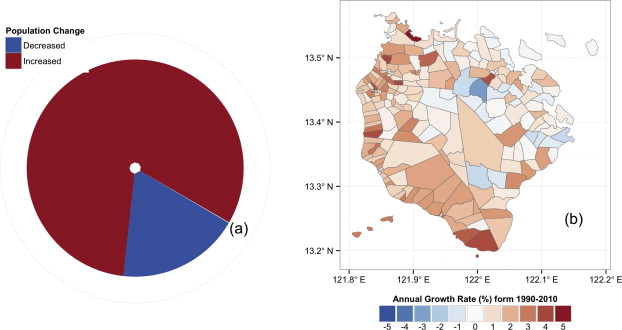
Maps of total population in the province for different census period were shown in Fig. 3. These maps showed no distinct pattern in terms of total population per village in the province. Population distribution of Marinduque is similar to other small islands where most of the population are concentrated in the coastal region (Mimura et al., 2007). Population density maps of the province (Fig. 4) showed that since 1990, densely populated villages were concentrated in either coastal or those relatively flat (i.e. flat to gently undulating) portions of the province. On the other hand, as of 2010, the village of Balanacan (Mogpog) has the highest population count (3216) while Tumapon (Boac) has the lowest (129). The village of Mercado (Boac) was the most densely populated village in the province with around 14 thousand persons/km2 while Tabionan (Gasan) ranks as the least densely populated village (37.6 persons/km2). In terms of population growth rate, majority (82%) of the villages showed positive increase in population (Fig. 5a) except those villages located in the east to northeastern portion of the province, which exhibit the opposite (Fig. 5b). The highest annual population growth rate (4.99) was observed for the village of Paye (Mogpog) while the lowest (−1.34) was observed for the village of Pakaskasan (Torrijos). On the average, the annual population growth rate of the villages in the province (1.57%) is still below the country’s 2.12% growth rate (NSO, 2015). According to Lee et al. (2009), although the Philippines has family planning program, the prevalence of modern contraceptive is moderate. Limited use of modern methods is due to religious opposition and not because of lack of consistent national and local government support for modern methods resulting to 5.9 fertility rate (Lee et al., 2009).
Clusters of population change
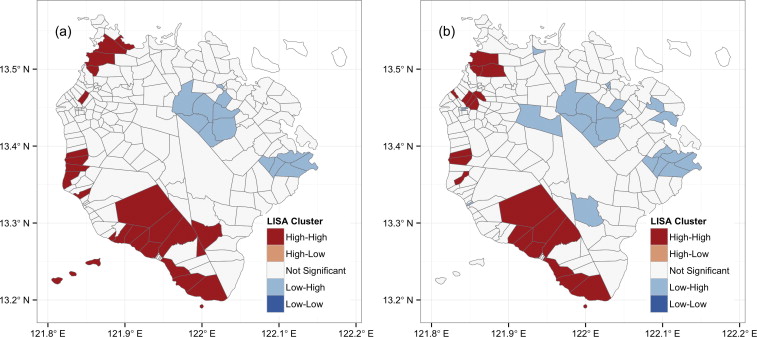
Global Moran’s I value for the change in population (0.30) and population growth rate (0.25) showed that there is significant (p-value < 0.01) moderate clustering among villages in terms of these variables. According to Small (2011) although there are several factors (i.e. cultural, socio-economic, and geophysical) that influence human population distribution, human population is strongly clustered in space. Results from Local Moran’s I test showed where these clusters are located in the province (Fig. 6). Almost similar pattern of clustering can be observed between change in population and population growth rate. For change in population, there were two (2) Low–High while four (4) of High–High clusters observed in the province. However, for population growth rate there were seven (7) Low–High and High–High clusters observed. Contrasting pattern can be observed between the northeastern and southwestern portion of the province. Low–High clusters were observed on the northeastern side of the province while High–High clusters were observed on the southwestern side. These mean that neighboring villages of these clusters also have high values for both change in population and population growth rate. The occurrence of High–High clusters for both change in population and population growth rate on the southwestern portion of the province can be attributed to the proportion and spatial distribution population increase in the province (Fig. 5). Meanwhile the presence of Low–High clusters on the northeastern portion of province can be due to the villages’ proximity to the abandoned mining site (see David, 2002) in the area. Further investigations are still needed to validate these hypotheses. Table 2 contains the list of villages included in both (i.e. Low–High and High–High) delineated LISA clusters.
| Change in Population | Population Growth Rate | ||
|---|---|---|---|
| High–High | Low–High | High–High | Low–High |
| Bunganay (Boac) | Banahaw Poblacion (Santa Cruz) | Anapog-Sibucao (Mogpog) | Mahinhin (Boac) |
| Cawit (Boac) | Devilla (Santa Cruz) | Bintakay (Mogpog) | Malusak (Boac) |
| Tanza (Boac) | Kaganhao (Santa Cruz) | Capayang (Mogpog) | Mataas Na Bayan (Boac) |
| Bagtingon (Buenavista) | Kilo-Kilo (Santa Cruz) | Ino (Mogpog) | San Miguel (Boac) |
| Caigangan (Buenavista) | Kinyaman (Santa Cruz) | Balogo (Boac) | Barangay II (Gasan) |
| Daykitin (Buenavista) | Labo (Santa Cruz) | Bantad (Boac) | Angas (Santa Cruz) |
| Libas (Buenavista) | Makulapnit (Santa Cruz) | Bunganay (Boac) | Bagong Silang Poblacion (Santa Cruz) |
| Malbog (Buenavista) | San Antonio (Santa Cruz) | Cawit (Boac) | Baguidbirin (Santa Cruz) |
| Sihi (Buenavista) | Bolo (Torrijos) | Daypay (Boac) | Devilla (Santa Cruz) |
| Tungib-Lipata (Buenavista) | Bonliw (Torrijos) | Tanza (Boac) | Kaganhao (Santa Cruz) |
| Yook (Buenavista) | Kay Duke (Torrijos) | Bagtingon (Buenavista) | Kilo-Kilo (Santa Cruz) |
| Antipolo (Gasan) | Malinao (Torrijos) | Barangay IV (Buenavista) | Labo (Santa Cruz) |
| Bahi (Gasan) | Pakaskasan (Torrijos) | Caigangan (Buenavista) | Maharlika Poblacion (Santa Cruz) |
| Banuyo (Gasan) | Daykitin (Buenavista) | Makulapnit (Santa Cruz) | |
| Masiga (Gasan) | Libas (Buenavista) | San Antonio (Santa Cruz) | |
| Pangi (Gasan) | Malbog (Buenavista) | San Isidro (Santa Cruz) | |
| Pingan (Gasan) | Tungib-Lipata (Buenavista) | Tamayo (Santa Cruz) | |
| Tabionan (Gasan) | Yook (Buenavista) | Bolo (Torrijos) | |
| Paye (Mogpog) | Antipolo (Gasan) | Bonliw (Torrijos) | |
| Malibago (Torrijos) | Mangiliol (Gasan) | Kay Duke (Torrijos) | |
| Tabionan (Gasan) | Malinao (Torrijos) | ||
| Matuyatuya (Torrijos) | |||
| Pakaskasan (Torrijos) | |||
| Talawan (Torrijos) | |||
Discussion
Changes in population of an area is influenced by many factors (Chi and Marcouiller, 2011; Chi and Ventura, 2011). These factors can fall in broad categories such as demographic characteristics, socioeconomic conditions, transportation accessibility, natural amenities, and policies and biophysical conditions related to land use and development (Chi and Marcouiller, 2011; Chi and Ventura, 2011). Political, geographic, and cultural forces as well as temporal and spatial influences also affect population and drives population change (Chi and Ventura, 2011; Entwisle, 2007). According to Chi and Ventura (2011) there are four (4) elements to consider in studying population change. First, a wide range of factors affect and influence population change and none of these factors can individually determine the direction and magnitude of change. Second, the influences of different factors that affect population change vary across time with different population redistribution processes. Third, changes in population in one area can spill over to its neighboring areas (spill-over effect). Lastly, the effect of different factors varies with respect to areal characteristics (i.e. rural, suburban, and urban).
In the case of Marinduque, the above-mentioned factors can be further explored. However, the availability of data regarding those factors is a major limitation of this study. Different socio-economic data for the province are only available as provincial aggregates (e.g. mean or total value for the whole province) and not on a village level. In some cases, although the village level data is present, such dataset are not publicly available or are bounded by copyrights of other researchers or institutions.
Conclusion
Using spatial analysis techniques, this study has shown how population distribution in the province of Marinduque varies spatially across space and time. It also showed that majority of the villages exhibit an increase in population from 1990 to 2010 and that majority of the densely populated villages are located in the coastal, flat and relatively flat regions of the province. Global Moran’s I test suggests there is spatial clustering of population growth and further validated by the Local Moran’s I analysis. From Local Moran’s I analysis, contrasting trend and clustering of population growth were observed between the northeast and southwestern portions of the province.
The results from this study can help provincial officials and other stakeholders to determine appropriate actions to address population growth in those villages included in LISA clusters. In addition, this study can also serve as a preliminary step to examine how the human population dynamics of Marinduque shapes its socio-economic and environmental systems.
References
- Almquist and Butts, 2012 Z.W. Almquist, C.T. Butts Point process models for household distributions within small areal units. Demogr. Res., 26 (2012), pp. 593-632, 10.4054/DemRes.2012.26.22
- Anselin, 1995 L. Anselin Local indicators of spatial association – LISA. Geogr. Anal., 27 (1995), pp. 93-115, 10.1111/j.1538-4632.1995.tb00338.x
- Auguie, 2012 Auguie, B., 2012. gridExtra: functions in Grid graphics. R package version 0.9.1. http://CRAN.R-project.org/package=gridExtra.
- Bae et al., 2008 Y. Bae, M. Yoon, E. Kim Spatial patterns of population growth and social indicators’ change in Korea: an exploratory spatial data analysis. Int. J. Urban Sci., 12 (2008), pp. 61-72, 10.1080/12265934.2008.9693631
- Bivand, 2015 Bivand, R.S., 2015. spdep: Spatial Dependence: Weighting Schemes, Statistics and Models. R package version 0.5–82.
- Bivand and Lewin-Koh, 2014 Bivand, R., Lewin-Koh, N., 2014. maptools: Tools for reading and handling spatial objects.
- CHDGC, 1994 Committee on the Human Dimensions of Global Change (CHDGC), National Research Council (NRC). Science Priorities for the Human Dimensions of Global Change, National Academic Press (1994). (p. 44. http://www.nap.edu/catalog/9175/science-priorities-for-the-human-dimensions-of-global-change)
- Chi and Marcouiller, 2011 G. Chi, D.W. Marcouiller Isolating the effect of natural amenities on population change at the local level. Reg. Stud., 45 (2011), pp. 491-505, 10.1080/00343400903496394
- Chi and Ventura, 2011 G. Chi, S.J. Ventura Population change and its driving factors in rural, suburban, and urban areas of Wisconsin, USA, 1970–2000. Int. J. Popul. Res., 2011 (2011), pp. 1-14, 10.1155/2011/856534
- David, 2002 C. David Heavy metal concentrations in marine sediments impacted by a mine-tailings spill, Marinduque Island, Philippines. Environ. Geol., 42 (2002), pp. 955-965, 10.1007/s00254-002-0601-4
- Entwisle, 2007 B. Entwisle Putting people into place. Demography, 44 (2007), pp. 687-703, 10.1353/dem.2007.0045
- Hachadoorian et al., 2011 L. Hachadoorian, S. Gaffin, R. Engelman Projecting a gridded population of the world using ratio methods of trend extrapolation. R.P. Cincotta, L.J. Gorenflo (Eds.), Human Population, Ecological Studies, Springer, Berlin Heidelberg (2011), pp. 13-25
- Hijmans, 2014 Hijmans, R.J., 2014. raster: Geographic data analysis and modeling. R package version 2.3–12.
- Hunter et al., 2000 L.M. Hunter, Labor and Population Program, Population Matters (Project). The Environmental Implications of Population Dynamics, Rand, Santa Monica, CA (2000)
- Jackson et al., 2010 M.C. Jackson, L. Huang, Q. Xie, R.C. Tiwari A modified version of Moran’s I. Int. J. Health Geogr., 9 (2010), p. 33, 10.1186/1476-072X-9-33
- Lee et al., 2009 R.B. Lee, L.P. Nacionales, L. Pedroso The influence of local policy on contraceptive provision and use in three locales in the Philippines. Reprod. Health Matters, 17 (2009), pp. 99-107, 10.1016/S0968-8080(09)34472-9
- Leunufna and Evans, 2014 S. Leunufna, M. Evans Ensuring food security in the small islands of Maluku: a community genebank approach. J. Mar. Isl. Cult., 3 (2) (2014), pp. 125-133, 10.1016/j.imic.2014.11.001
- Linard et al., 2012 C. Linard, M. Gilbert, R.W. Snow, A.M. Noor, A.J. Tatem Population distribution, settlement patterns and accessibility across Africa in 2010. PLoS ONE, 7 (2012), p. e31743, 10.1371/journal.pone.0031743
- Matthews and Parker, 2013 S.A. Matthews, D.M. Parker Progress in spatial demography. Demogr. Res., 28 (2013), pp. 271-312, 10.4054/DemRes.2013.28.10
- Mimura et al., 2007 Mimura, N., Nurse, L., McLean, R., Agard, J., Briguglio, L., Lefale, P., Payet, R., Sem, G., 2007. Small islands, In: Climate Change 2007: Impacts, Adaptation and Vulnerability. Contribution of Working Group II to the Fourth Assessment Report of the Intergovernmental Panel on Climate Change. Cambridge University Press, Cambridge, UK, pp. 687–716.
- Moran, 1948 P. Moran The interpretation of statistical maps. J. R. Stat. Soc. Ser. B, 10 (1948), pp. 243-251
- Nagarajan, 2006 P. Nagarajan Collapse of Easter Island: lessons for sustainability of small islands. J. Dev. Soc., 22 (2006), pp. 287-301, 10.1177/0169796X06068032
- Neuwirth, 2014 Neuwirth, E., 2014. RColorBrewer: ColorBrewer Palettes. R package version 1.1–2.
- National Statistical Coordination Board (NSCB), 2015 National Statistical Coordination Board (NSCB), 2015. Philippine Standard Geographic Code. Accessed January 24, 2015. http://nap.psa.gov.ph/activestats/psgc/province.asp?provcode=174000000®Code=17®Name=REGION+IV-B+%28MIMAROPA%29.
- NSO, 2015 National Statistical Office (NSO), 2015. 2010 Census and Housing Population. Accessed January 24, 2015. http://web0.psa.gov.ph/old/data/pressrelease/2012/PHILS_summary_pop_n_PGR_1990to2010.pdf.
- Polido et al., 2014 A. Polido, E. João, T.B. Ramos Sustainability approaches and strategic environmental assessment in small islands: an integrative review. Ocean Coast. Manag., 96 (2014), pp. 138-148, 10.1016/j.ocecoaman.2014.05.005
- Pungetti, 2012 G. Pungetti Islands, culture, landscape and seascape. J. Mar. Isl. Cult., 1 (2012), pp. 51-54, 10.1016/j.imic.2012.11.007
- R Core Team, 2014 R Core Team, 2014. R: A Language and Environment for Statistical Computing.
- Rossen et al., 2014 L.M. Rossen, D. Khan, M. Warner Hot spots in mortality from drug poisoning in the United States, 2007–2009. Health Place, 26 (2014), pp. 14-20, 10.1016/j.healthplace.2013.11.005
- Salvati, 2012 L. Salvati The spatial nexus between population growth and land degradation in a dry Mediterranean region: a rapidly changing pattern?. Int. J. Sustain. Dev. World Ecol., 19 (2012), pp. 81-88, 10.1080/13504509.2011.593007
- Small, 2011 C. Small The Human Habitat. R.P. Cincotta, L.J. Gorenflo (Eds.), Human Population, Ecological Studies, Springer, Berlin Heidelberg (2011), pp. 27-46
- Wickham, 2009 H. Wickham Ggplot2. Springer New York, New York, NY (2009)
- Wickham, 2011 H. Wickham The split-apply-combine strategy for data analysis. J. Stat. Softw., 40 (2011), pp. 1-29
- Young and Jensen, 2012 S.G. Young, R.R. Jensen Statistical and visual analysis of human West Nile virus infection in the United States, 1999–2008. Appl. Geogr., 34 (2012), pp. 425-431, 10.1016/j.apgeog.2012.01.008
- Zhang and Lin, 2007 T. Zhang, G. Lin A decomposition of Moran’s I for clustering detection. Comput. Stat. Data Anal., 51 (2007), pp. 6123-6137, 10.1016/j.csda.2006.12.032