Tracing socio-economic impact of ferry provision in Zadar island archipelago
Anglia Ruskin University, United Kingdom zrinka.mendas@anglia.ac.uk
Abstract
This paper explores a socio-economic impact of ferry provision in Zadar island archipelago in Croatia. Poor frequency, accessibility, and unaffordable ferry prices to smaller islands have had a detrimental impact on island communities’ sustainability. This prompts for asking what constitutes the socio-economic impact of ferry provision on remote and rural islands’ sustainability. The paper analyses on one hand, regional traces of demographics of population, migration, employment and education; and on the other local traces of emerging island communities’ activities. Adverse impact from the financial resource scarcity and centralisation remain unavoidable, e.g., litoralisation, social exclusion, lack of trade inflows and outflows, entrepreneurship, and lack of employment opportunities for young generations. Island communities are aware of the need for alternative sustainable ways of managing their local economies and this study captures this through communal entrepreneurial and cultural activities. Political actors also must align with their needs in order to provide a long-term sustainable but limited support. Heterogeneity of space and data provides an opportunity for adopting pluralistic and interpretivistic insight and align more closely academic research with evidence-based policy related to rural planning for island archipelagos.
Keywords
Socio-economic impact, Rural–urban dynamics, Ferry services, Island archipelago, Community, Sustainability, Croatia
Introduction: Problems facing rural and island communities
This paper signifies a further development from the author’s preliminary study (Mendas, 2014) into rural and remote communities in Zadar island archipelago. The study provided an insight into the problems island communities face with a complex communal relationship playing an important influence in preserving their way of living. The study later evolved to consider broader regional socio-economic concerns in rural–urban planning of island archipelagos. This paper aims to draw attention to a specific rural–urban linkage of a ferry provision between the island archipelago and port city Zadar in order to better understand its part in a wider socio-economic impact that current policies have on the rural sustainable development in the Zadar coastal region. The theme of the study and this paper is encapsulated in the following story:
Story 1: Storm
“As usually, I texted my mother living on the island Rivanj mid-December to see how she is doing. She (her mother) replied: “I am fine but the weather is bad, with the stormy winds and high seas, ferries were not able to dock for the last 5 days. Because of the frequent electricity blackouts during the day, this is not good for the meat in the freezer. Old people need to buy food and medicine in Zadar. I hope the storm will not last long…”
From the author’s own quotations and from the islanders’ viewpoint, the story represents a typical response from the islanders during the winter period in remote and rural island archipelago. Wind and sea storms bring disruption to delivery of basic goods and services to and from island communities. Without stable food supply, elderly islanders depend on the help from other residents. Without electricity, other able islanders cannot keep their own supply of fish, a staple food, for a long time. Without ferries being able to dock, no goods or services can be delivered to the island, trade inflows and outflows cannot take place, as well as labour mobility. Ferries, thus, represent a lifeline public transport routes, as this is in numerous cases the only way to reach the islands apart from the emergency care and fire services helicopters. This may also be questionable as no every island has the infrastructure to allow them to land – docks have to be wide enough for them as well for the vehicles. This, in turn, highlight the issue of investment into transport infrastructure for islands which begun happening in 2011 following the new legislation for island development (The Island Act) and reliable provision of subsidised ferry services (Ministry of Regional Development and EU Funds, 2013). In many instances, and depending on the state of the public finance, the subsidised ferry services offer only lifeline routes to the islands and the rest is procured to private companies following the tendering and procurement process. They tend to cover the areas that state owned Jadrolinija does not due to the cost of fuel and ageing fleet that is too big to dock onto the small ports. Moreover, and this is something that islanders are becoming increasingly aware of; a current level of subsides may be unattainable in the future since it does not deliver a value for money to many neglected islands, for whom ferry represents “a bridge”.
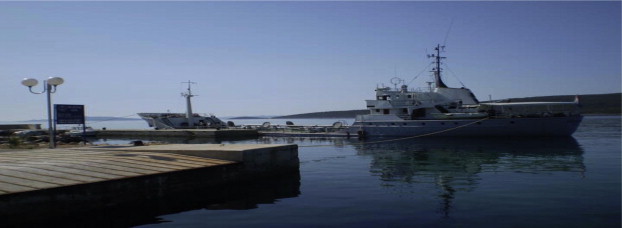
This micro story echoes economic and social hardship that communities in this island and coastal regions face on the everyday basis because of the remote islands’ geographical location (Fig. 1). Island communities’ economic and social welfare depends on reliable and frequent ferry services. Despite islands’ contribution through tourism poor frequency, unaffordable prices and accessibility to islands have had a detrimental impact on the island communities’ sustainability.
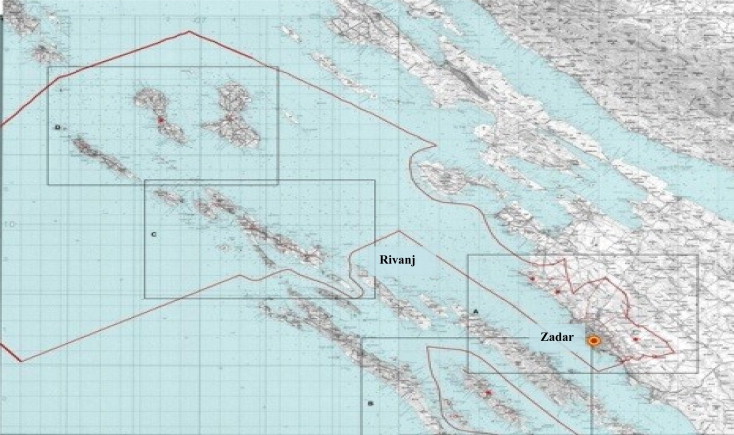
An initial motivation for studying this context is twofold. Island population is dispersed geographically and spatially across the archipelago. Author’s family resides on one of the islands in Zadar island archipelago, Island Rivanj. Rivanj, where she is a frequent visitor. Rivanj as one of smaller islands in this archipelago, shares historical and cultural heritage with the other islands, making his a representative in the study. A brief introduction to Rivanj is provided below (see Fig. 2).
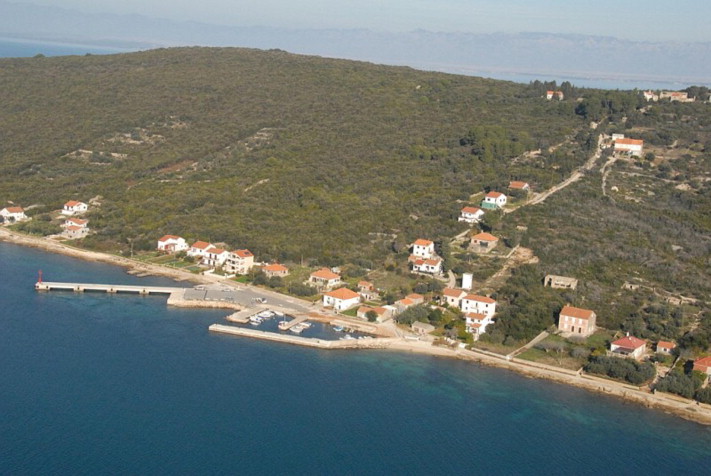
Rivanj is an Adriatic Sea island situated in Zadar Archipelago, between the islands of Šestrunj and Ugljan, with an area of 4.4 square kilometres and width up to 1.4 km. Like other islands in the archipelago, Rivanj is inhabited by the families of anglers who have lived here for centuries. Population currently stands at 31 people excluding the members of the families that arrive in the evening and depart in the morning as well as weekends. Rivanj has daily ferry connections with the mainland and neighbouring islands (Ist, Molat, Zverinac and Šestrunj) and is within 30 min reach of Zadar by catamaran. Economic activities include agriculture, fisheries and tourism. Traces of habitation date from prehistoric times and Rivanj is for the first time recorded in written sources the mid XIV century and then again in the XV century, in Zadar Cadastre as Rivanj and in the other sources as Ripanium. In the middle Ages, the island was part of the commune of Zadar and in 1640, Zadar family Lantana bought it. At the end of XIX and early twentieth century, much of the population emigrated to the United States and after the Second World War most of the population settled in Zadar (Miroslav Krleža Institute of Lexicography, N.D.). In terms of regional economic impact, sea and windstorms frequently have a domino effect of power outage throughout the region. Windstorms could create a massive energy disruption by reducing a power capacity as it cuts off energy supply and resulting in severely limited transmission capabilities because it topples high-tension transmission lines and high-voltage transmission pylons. Sea storm can damage underwater cables that might be difficult to repair due to the location and frequently lead to insurance losses: causing flooding and damage to the buildings and public road infrastructure in the areas close to the sea, including old buildings in port towns that lie few metres from the sea.
In a preliminary study, the author stayed for 5 month on Rivanj and whilst travelling within the island archipelago, she was able to observe the everyday problems associated with the island life. Islanders complain about the poor ferry service provision and transportation costs not only between islands and port city Zadar but also between other islands in the archipelago and in this way, supporting the argument for inter-island connectedness (Radulić, 2013b). In further study, the author begun connecting these local issues to broader regional socio-economic issues facing the remote and rural island communities in the coastal region of Zadar. Emergence of new forms of spatial economy that has brought a new wave of the immigration towards the coastal areas (Fredotović and Šimunović, 2006). Active island population has no choice but to move to the urban centre for work and is unable to commute daily due to high ferry prices and infrequent travel timetables. Yet, as author witnessed, people remain attached to their islands during the holidays and weekends while others try to stay on permanent basis but at the cost of financial security. Ongoing litoralisation has contributed to a pressure on city housing and led to a shortage of affordable housing and consequently an increase in the value of space in the port city Zadar. While port city Zadar benefits from incoming labour mobility, proximity to natural island resources and port infrastructure, the needs of population of the remote rural islands remain neglected. This undesirable emigration of islanders has left current population fearing a disappearance of the island’s identity and a creation of ghost villages. The paper explores these issues using island Rivanj as a representative.
In concluding, this section reminds of the challenges island archipelago and policy makers: (i) remote islands are separated by the coast by the natural barriers, hence spatial feature; (ii) government cannot provide for everything due to scarcity of financial resources; and (i) and (ii) prompt for thinking differently about islands’ sustainability. This signifies the importance of exploring the socio-economic impact of current ferry provision and forms the basis for discussion in this paper. With this in mind, the rest of the paper is organised as follows. The second section discusses notion of rural–urban. Third section introduces the idea of economic space in study of islands. Fourth section examines regional and local trends. The paper concludes by reflecting on the theme and findings and provide recommendations and future direction.
Defining rural–urban in Zadar region
Remote regions like island archipelagos are separated by the natural barriers from the coastal port cities, giving it a spatial feature (see Fig. 1) as well as distance (or proximity) between these two. Islands are predominantly connected with ferry services represent the most affordable transport mode due to the remoteness. Orkney and Shetland Islands in Scotland and Åland Islands in Finland provide interesting example. Due to remoteness, the islands have developed their own local economies; including local entrepreneurship, island tourism, fisheries and agricultural and other local economic activities. We, thus, touch upon this question: What constitutes a socio-economic impact of ferries provision on islands’ sustainability? Before we proceed with the analysis of the specific urban–rural linkage, one needs to clarify the definition of ‘urban’ and ‘rural’.
In defining rural–urban, OECD (Brezzi et al., 2011) provides an extended regional typology of what is meant by rural and urban, e.g., a predominantly rural area is defined by the population share in local rural area being greater than 50%, while predominantly urban area represents 15% of the population share in local rural areas. The Table 1 shows that 48% of population lives in rural areas, including 81.885 residents scattered spatially over 3.380 km2. The population share of the local rural areas in Zadar municipality region indicates a predominantly rural area.
| Classification | OECD criteria | |||||
|---|---|---|---|---|---|---|
| km2 | % | Number of cities | % | Number of residents | % | |
| Rural areas | 3.380 | 92,8 | 210 | 92 | 81 | 48 |
| Urban areas | 262 | 7,2 | 19 | 8 | 88 | 52 |
| Total | 3.643 | 100 | 229 | 100 | 170 | |
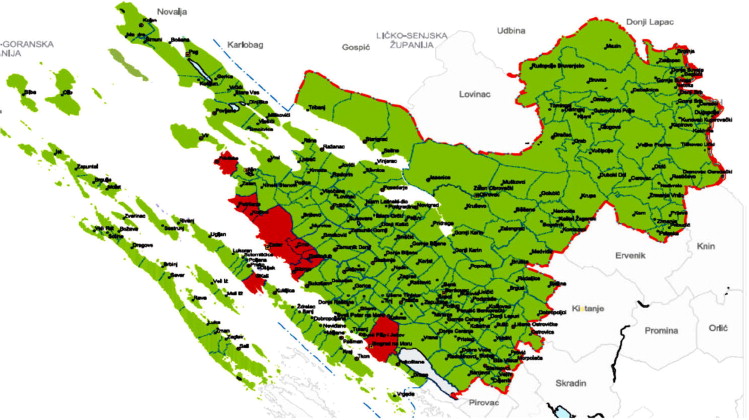
In terms of density of population, most concentrated are (52%) is around the port city Zadar and other coastal cities (red area) while the rest of population is located in rural areas (48%) (green area) in (Fig. 3), including island archipelago, coastal and mountain regions.
Island population is scattered across the large spatial area of island archipelago (see Fig. 4).
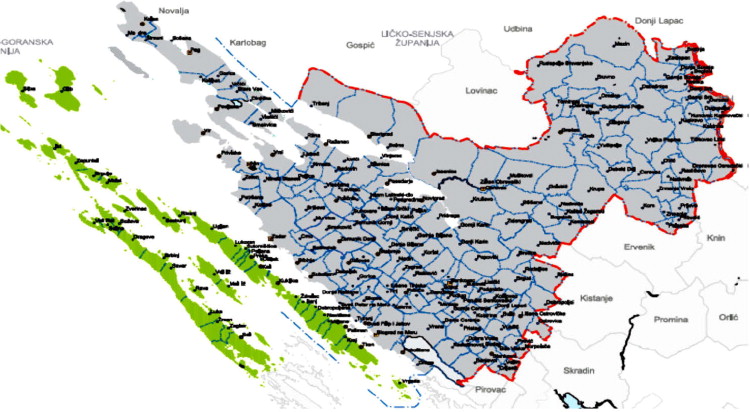
This further supports the rural status of the Zadar County and well as that, from the regional perspective, government investment into urban areas will precede rural mainly because of data availability and proximity of the urban centres. This, in turn, raises the issue of transport and its costs and labour movement from rural to urban area and vice versa. Data availability associated with urbanisation and ruralisation and relevance of this data to policy decision makers remains problematic to find due to heterogeneity. This suggests why larger urban areas will be favoured in contrast with much neglected rural areas. Other major issue is a spatial configuration of the archipelago (Figs. 3 and 4) that influences development of the rural regions and which can be seen as an economic space.
Island archipelago as economic space
A notion of space is important for two reasons. First, it relates to the spatial nature of a rural–urban linkage in island archipelago (see Fig. 1). Second, it is useful for economic analysis as it invites reader to consider this space as an economic space. As Higgins and Savoie (2009) points, regional development and its analysis, which deals with the events or problems of a spatial nature, in other words, heterogeneity of space. The term heterogeneity is generally associated with the quality of being dissimilar; including multifarious composition (OED Online). Higgins and Savoie (2009, p. 176) argues that “the presence of the heterogeneity requires one to, instead, consider space with the spatial multiplier, space and time, the relationship of space to the diffusion of knowledge and information, indivisibilities and externalisation, polarisation and cumulative causation; and the overlap between spatial heterogeneity, occupational structures, socio cultural disparities, and political action and expression identified with defined spaces which actors represent”. This makes it difficult to approach the space from the viewpoint of transport costs, resource endowment, and class structure independently but rather as interdependent. It is this notion of interdependence, in Perroux’s (1950) sense that makes spatial economic analysis more difficult to carry out. This paper attempts to address this difficulty by introducing a context of remote and rural islands and their communities as an active unit of the economic analysis.
From the theoretical perspective, the economy in space within which the active units act is understood as a field of forces, made up of centres from which centrifugal forces issue outwards and towards which centripetal forces are directed inwards. The active units are made of the active economic agents, who are not all equal and who possess unequal abilities to modify or influence their environment (Perroux, 1988, p.49). Perroux (1950) in his synopsis suggests a distinction between Geonomic (banal) space and Economic spaces, which Perroux discriminates between space defined: by a plan; as a field of forces, and as a homogeneous aggregate. In a theoretical sense, these categories are judged by their reference to the firm as a fundamental unit of production that is subject to power and economic activity, including machines, material, workers, and money. With a reference to a banal space, which is relatively small, but arguably as equally important to examine, this paper argues that before constructing the bigger picture of the regional analysis of the particular economic space, the economic space cannot exist without its banal space where it originates. When referring to a space as a field of forces around the centre, centrifugal and centripetal forces that cause the centre to attract and repulse within own field and the fields of others, this space allows the firm to draw its banal space, made of workers, machines, material and money used in production. This leads to a basic economic activity of local supply and demand. It is worth noting here that while the focus remains on the firms (small and medium size enterprises) in the economic space, and the same could be applied to a context of rural and remote island communities’ economic activities in this study.
In practical terms, one could island community as a collective (business unit) engaged in elementary production of goods and services which are then circulated within the economic space now extended to within the island and between other islands and urban coast areas. Goods exchange exists in the local products, e.g., for local produces (olive oil, vegetables, poultry, and timber) and services (housing short-let, marine and boat rent and repair and other local business services) within the island space and between the port city Zadar. Island archipelago has since ancient times preserved farming practices for agricultural production as a part of Mediterranean staple food such as olives, olive oil, fishing, and other products, so agriculture remains one of the major activities necessary for preserving island life, e.g., islanders produce potato, salad, fruits etc. A basic economic exchange exists within the communities; islanders (small anglers with fishing licence and farmers at the same time) sell their products to tourists and other community members during the year. Wood from the local forests is collected during the autumn, used through the winter as a main natural resource, and sold amongst the members of the community.
Grydehøj and Hayward (2014) provides an invaluable literature connected to the island space, stressing the important role of the islands by producing the diverse stratum of the issues. These range from the island effect (Leimgruber, 2013); relationship between island communities and the outside world (Eriksen, 1993); island communities characteristics being shaped by their spatial distinctiveness and boundedness (Biagini and Hoyle, 1999); archipelagos being dominated by one of their constituent islands (Baldacchino and Ferreira, 2013) to a influence of spatial factors in island and coastal urbanisation (Pons and Rullan, 2013). These studies link, in many ways, the issue of remoteness and solitarily to an undesirable and unavoidable effect of social exclusion that this study signifies. Nevertheless, Perroux (1950) framework provides a starting point for the economic analysis of a study urban–rural linkage in the case of island archipelago and port city Zadar. How to represent the specific urban–rural linkage is a subject matter of the next section.
Tracing the impact
The paper traces the impact of rural–urban linkage such as ferry provision between island archipelagos and port city Zadar. Derrida (1978, p.394) refers to a trace as a nonlinear or chronological…modified present”…and…“a contingent strategy” that involves interweaving the text to arrive at a modified present. This interweaving, this textile is the text produced only in the transformation of another text” (Derrida, 1981, pp. 387–388). A notion of tracing, in this sense, has a useful purpose. The same could be said for the stories that emerge from this study; the researcher tries to reconstruct the reality – a socio-economic impact of current ferry services using the micro stories that represent the fabric of community life. Stories play an important part in reconstructing events as they happened and the author uses ethnographic storytelling (Mendas, 2014) that consists of pictures that are deconstructed with micro stories in an attempt to explore in more depth a socio-economic impact from ferry provision from the local perspective of islanders, in addition to trends. The paper pursues idea that the pictures represent a snapshot of the situation in which islanders find themselves. Study itself is rooted in ethnographic field approach, of which traces and storytelling are essential part.
This paper discusses two strata used to explore rural–urban dynamics: regional trends and local experiences. In the absence of simple indicators, measurement should be seen as “a synthetic criterion, summarising the spatial dimension of the thematic domains covered by other criteria” (De Boe et al., 1999, p. 44) and including “a willingness to cooperate” that relies on “a state of mind” and on organisational patterns that do not necessarily imply easily measurable phenomena (De Boe et al., 1999, p.19). Parr (2005, pp. 557–559) proposes examining the flow of interaction within city-region, e.g., inflows and outflows; trade; labour market; capital movements and capital inflow and outflow; and government transfer flow with significant public-finance responsibilities. Acknowledging this heterogeneity of space and data, the paper examines both; regional rural–urban quantitative indicators (e.g., demographics) and local neglected qualitative issues (e.g., transport, interregional and residential migration flows and barriers to trade flows).
Deconstructing the regional trends
Croatia’s reforms for development and growth; including reform of state subsidising for development of the rural infrastructure, remains a challenge, given the state’s history and population perceptions towards state subsidies. Croatian’s state finance situation is plagued by the financial legacy of the civil war (1991–1998) and recent global economic crisis. Following the accession in July 2013 some progress is evident in the latest figures paint optimistic picture for Adriatic region as a whole, thanks to the EU funding in flows (Table 2). (Note: (1 HRK = 0.105243 GBP on 16/08/2014).
| 2013 | 2014 | Index 2013/2014 | 2015 | 2016 |
|---|---|---|---|---|
| 920.037 | 1.475.546 | 160,38 | 4.423.493 | 91.500 |
The investment begun in 2013 prior to Croatia’s accession to the EU and is gradually reaching peak in 2015. This coincides with the reform of the Croatia’s legislation for investment into island development (Ministry of Regional Development and EU Funds, 2013). This piece of legislation has had an important impact on the Gross Domestic Product per Capital for Adriatic region (Fig. 5).
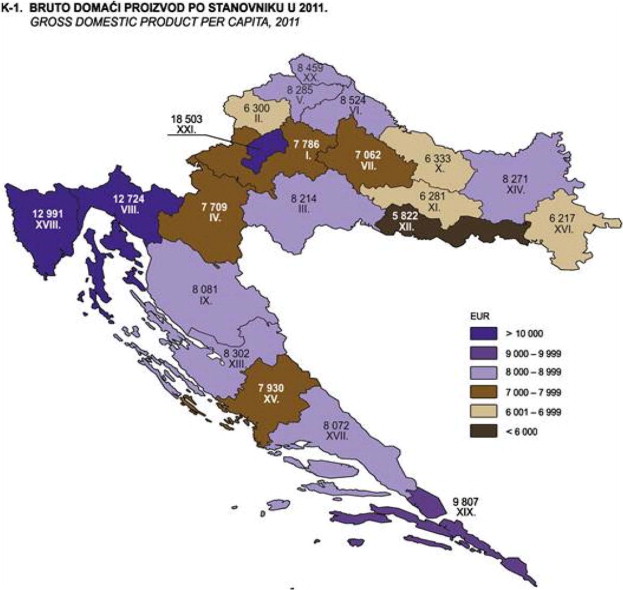
As Fig. 5 indicates, more needs to be done to match inland parts of the country and maximise touristic potential. Despite Zadar region being classified as predominantly rural (see pp. 4–5), a focus on growth is centred around the port city Zadar suggests reserving over 40% more of financial allocation than for the islands (ZADRA, d.o.o., 2013b) despite a gradual increase in financial resources allocated for island development (Table 3).
| 2013 | 2014 | Index 2013/2014 | 2015 | 2016 |
|---|---|---|---|---|
| 1,314.000 | 2,085.000 | 158,68 | 1,400.000 | 1,300.000 |
The total funding for Croatian island development that started in 2011 was secured through grant scheme from numerous government departments and public sector institutions; of which Ministry for Regional Development and European Union funds and the Ministry of Maritime Affairs, Transport and Infrastructure and the Croatian Bank for Reconstruction and Development were the biggest contributors (Table 4).
| Year 2011 | Value (in kunas) |
|---|---|
| Ministry for Regional Development and European Union funds | 132 m |
| Ministry of Maritime Affairs, Transport and Infrastructure | 392 m |
| Croatian Bank for Reconstruction and Development (HBOR) | 369 m |
Investment into transport infrastructure was also a key objective. Period 2004–2011 experienced a significant planning and investment into project related to building new ports and improving ferry routes. In total, 333.645 kunas (Ministry of Regional Development and EU Funds, 2013, p. 29) was invested on these projects, including some of these in Zadar region, e.g., ferry port Preko, port Plin, Rava, Poljana on Ugljan, etc. Island Rivanj also benefited from new ferry dock, which is seen as the most common project for most of the islands (Table 5). Like island Rivanj, many of those ports have been historically neglected and many needed to be capable to accept car ferries as without this capacity, the island tourism misses out the opportunities, e.g., tourism, employment, trading, etc.
| Name | Area | Period |
|---|---|---|
| Upgrade port Zverinac | Zverinac, borough Sali – island Zverinac | 2006–2007 |
| Upgrade port Mala Rava | Mala Rava, city Zadar - island Rava | 2006–2007 |
| Upgrade pier for receiving fishing boats in the harbor Kukljica | Port Kukljica, borough Kukljica – island Ugljan | 2007 |
| Upgrade port Vela Rava | Port Vela Rava – island Rava | 2007–2008 |
| Reconstruction port Poljana | Port Poljana, borough Preko – island Ugljan | 2007–2009 |
| Reconstruction and upgrade port Starigrad | Port Starigrad – borough Starigrad | 2007–2008 |
| Reconstruction port Ždrelac – island Pašman | Port Ždrelac – island Pašman | 2007–2008 |
| Upgrade ferry dock Rivanj, island Rivanj, borough Preko | Port Rivanj, borough Preko – island Rivanj | 2008–2010 |
| Upgrade ferry dock Port Preko, borough Preko – island Ugljan | Port Preko, borough Preko – island Ugljan | 2008–2010 |
As the Table 5 indicates, there has been a revival in island development and over the period of 2006–2009 the local government has invested in numerous projects across the island archipelago. One could draw two assumption from this: island infrastructure has historically been neglected and crucial for the future sustainable island development; and Croatia’s accession to the European Union. Government recognises that current problems are still unresolved, e.g., ageing of the fleet participating in scheduled passenger transport, a high proportion of motor fuel in the total costs of transport, as well as significant seasonal variations, the most significant challenges faced by shippers in maritime transport (Croatian Government, 2013). This, however, remains a work in progress.
Supporting SMEs in Zadar island archipelago is another hotly debated issue. Island based SME face numerous obstacles, e.g., poor access and infrequent ferry routes and high transport costs. This inevitably has resulted in higher cost of living on the islands (50%); decrease in protected space on islands from 30% to 6% and islanders denied a participation on consulting in ferry transport pricing (Luić, 2013). As a part of broader strategy of island repopulation government provides financial assistance to SME based on islands in order to increase employment amongst the island population, e.g., for each employed island resident SME receives a subsidy that can be used to easy the cost of the trade on islands, especially transport costs between islands and Zadar. Table 6 indicates the level of financial assistance within Zadar County.
| Borough | Sector for islands | Total | |||||
|---|---|---|---|---|---|---|---|
| HRK (kunas) | |||||||
| 2006 | 2007 | 2008 | 2009 | 2010 | 2011 | 2006–2011 | |
| Zadar County | 954.915 | 1, 380.023 | 1,225.648 | 1,101.573 | 993.153,08 | 1.234.336,16 | 6.8893650,88 |
It could be seen from the table that financial support has continually increased over the period of 5 years. In comparison with other counties, however, the fair allocation of these resources this remains questionable, given the facts that it has the biggest number of rural and remote islands.
Despite island underdevelopment, Croatia remains a favourite touristic destination for Europeans. Table 7 provides an overview of transport statistics for the year 2013–2014 (high season). These figures include domestic and international travellers.
| LINE | Passenger ‘10 | Passenger ‘11 | Index 11/10 | Vehicle ‘10 | Vehicle ‘11 | Index 11/10 |
|---|---|---|---|---|---|---|
| 401/Zadar-Premuda-M.Lošinj | 23.359 | 24.707 | 105,8 | 5.711 | 6.130 | 107,3 |
| 431/Zadar-Preko | 1.657.065 | 1.617.167 | 97,6 | 246.537 | 247.624 | 100,4 |
| 432/Biograd-Tkon | 456.103 | 448.198 | 98,3 | 108.281 | 102.848 | 95,8 |
| 433/Zadar-Sestrunj-Žverinac-Molat-Ist | 16.369 | 17.497 | 106,9 | 4.351 | 5.116 | 117,6 |
| 434/Brbinj-Zadar | 141.325 | 141.480 | 100,1 | 47.772 | 47.709 | 99,9 |
| 405/435/Zadar-Bršanj-Rava+9404/A Zadar-Iž-Rava | 89.265 | 105.380 | 118,0 | 8.568 | 8.249 | 96,3 |
| 405a/Zadar-Sali-Zaglav+9406/Zadar-Sali-Zaglav | 110.237 | 115.672 | 104,9 | |||
| 9403/Ist-Molat-Zadar | 46.700 | 46.614 | 99,8 | |||
| 9401/Premuda-Silba-Olib-Zadar | 63.490 | 67.256 | 105,9 | |||
| 9404/Božava-Žverinac-Sestrunj-Rivanj-Zadar | 29.772 | 33.024 | 110,9 | |||
| 415/RPZ VRGADA Vrgada-Pakoštane-Biograd | 41.431 | 43.043 | 103,8 | |||
| M.S.“SEABOURN SPIRIT & ODYSSEY” CRUISER-port SALI | 2.059 | 10.022 | 486,7 | |||
| TOTAL | 2.677.175 | 2.670.060 | 99,7 | 421.220 | 417.676 | 99,1 |
One difficulty with interpreting the data is that it is difficult to distinguish between local residents and occasional travellers. Many retired residents (e.g., author’s parents) own the house on the island. Although spending most of their year on the islands, they are not registered as islands residents.
Subsides remain an important element of funding and supporting the public sector funding, especially island development although the data for are difficult to find. Subsidies in form of the concessions for ferry service providers are provided in the line with EU policy OJ L 7, 11.1.2012 (European Commission, 2012) that stipulates subsidies to be used for creating the which enable them to fulfil their goals, and therefore, it may be necessary for the financial State aid, which would cover part or all of the specific costs resulting from the obligation to provide public services (European Commission, 2007). Table 8 shows a total allocation of subsides for city Zadar.
| 2013 | 2014 | Index 2013/2014 |
|---|---|---|
| 10,640.000 | 12,800.000 | 120,30 |
Subsidies, in the form of travel concessions, e.g., “vinjete” (50% of concession fares) remain an important element of financing the ferry service provision in order to provide concessions for the specify groups of island residents (e.g., retired, school age children and civil servants) community regularly between islands and Zadar.
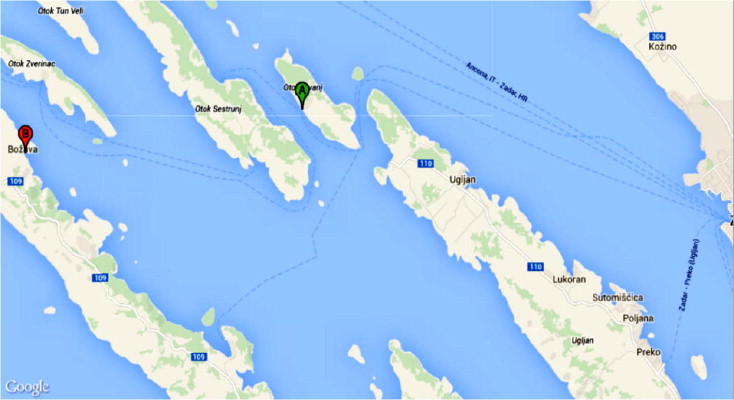
Despite “vinjetes”, ferry prices remain the biggest obstacles for both island and urban based communities, especially SMEs. The pricing method suggests a significant differences in prices between seasonal and non-seasonal periods. Non-seasonal holiday period runs from 29.09–31.12 and 01.01–29.05. Seasonal holiday period runs from 30.05–28.09. During the non-seasonal period, the frequency becomes limited to 2 days a week for larger ferries carrying vehicles. Consider the example of state run catamaran line No. 9404: Zverinac-Božava-Sestrunj-Rivanj-Zadar (Fig. 6).
Distance between Zadar and furthest island, Zverinac, covered by the route, amounts to increase in journey tariff up to 63% during non-seasonal period while trips made to islands closer to Zadar are 67% higher on route Zadar-Rivanj/Šestrunj (30 min journey). In terms of inter-island connectedness, e.g., between Zverinac-Božava (15 min journey) indicates 75% higher tariff during non-seasonal period. This is illogical given the distance and transport costs covered for this shorter route and the fact that these routes are outsourced to a private contractor who gets a subsidy. Besides, these routes only cover passenger transport and excluding cars. One also has to bear in mind that catamarans only offer a return trip once a day during seasons and non-seasonal period. Car ferries tariffs remain the same for most of the routes. For Zverinac-Božava route, tariffs, e.g., for vans up to 6 tones the tariff is 380 kunas return (£48). This route is served only twice a week, Mondays and Wednesdays during non-seasonal period (winter). Overall, winter-island routes tariffs remain 50% higher than routes closer to port city, which is illogical, given their proximity to each other.
Generally, higher costs of living on the islands have led over the decades to litoralisation; a process of increase in movement of the population and human activities of island or coastal areas to inland due to the revolution in transportation and globalisation of the economy. This process has historically affected island population in the Zadar archipelago (Table 9).
| Spatially developed unit | Population size | Area (km2) | Density 2001 | Density 2011 |
|---|---|---|---|---|
| Coastal area | 72.887 | 67,18 | 1053,2 | 1085,0 |
| Zadar | 71.471 | 46,82 | 1485,6 | 1526,5 |
| Kožino | 815 | 9,9 | 58,9 | 82,3 |
| Petrčane | 601 | 10,46 | 59,0 | 57,5 |
| Coastal area | 568 | 12,96 | 33,0 | 43,8 |
| Babindub | 31 | 4,25 | 1,9 | 7,3 |
| Crno | 537 | 8,71 | 48,2 | 61,7 |
| ISLANDS | 1607 | 112,56 | 13,6 | 14,3 |
| Brgulje | 48 | 5,75 | 9,2 | 8,3 |
| Ist | 182 | 14,96 | 13,5 | 12,2 |
| Mali Iž | 215 | 7,3 | 20,1 | 29,5 |
| Molat | 107 | 9,82 | 9,8 | 10,9 |
| Olib | 140 | 27,38 | 5,4 | 5,1 |
| Premuda | 64 | 8,31 | 7,0 | 7,7 |
| Rava | 117 | 3,61 | 27,1 | 32,4 |
| Silba | 292 | 14,98 | 17,7 | 19,5 |
| Veli Iž | 400 | 10,3 | 39,8 | 38,8 |
| Zapuntel | 42 | 10,15 | 5,7 | 4,1 |
| TOTAL | 75.062 | 191,71 | 379,3 | 391,5 |
According to this table, the population of islands archipelago belonging to the Zadar area (e.g., Olib, Silba, Premuda, Škarda, Ist, Molat, Iž and Rava, and village Brgulje, Ist, Mali Iz, Molat, Olib, Premuda, Rava, Silba, Veli Iz and Zapuntel) as Census 2011 indicates, totalled to 1607 residents, only 2% higher than the total population of the city of Zadar, which stood at 75,062. Arguably, the share of Zadar islands in total area of the city Zadar was 59%, indicating a low population density, but also the great development potential for the city (ZADRA, d.o.o., 2013a). Yet, this strategy seems to ignore islands development. In addition to this, Tables 3 and 10 provide an outline of the area and number of residents in island archipelago of Zadar and city Biograd, including other islands Ugljan, Pašman, Vrgada, Dugi Otok and smaller islands. Island Rivanj also belongs to this group (Table 10).
| Area in km2 | Number of residents 2001 | Number of residents 2011 |
|---|---|---|
| 374,35 | 10.827 | 10.258 (−) |
Table 10 indicates, when comparing the last decade (2001–2011), around 10,258 residents live on islands covering 374,35 km2, and this number is declining by 569 residents. This supports litoralisation as an ongoing process. It also raises the number of issues, including; lack of interest in repopulating the island; lack of provision of adequate support in order to achieve above and lack of regular all year long ferry services at affordable prices.
Ageing population is particularly evident in island and coastal areas. In the study, the age demographics (Fig. 11) cover four areas: Zadar, islands, hinterland, and coast.
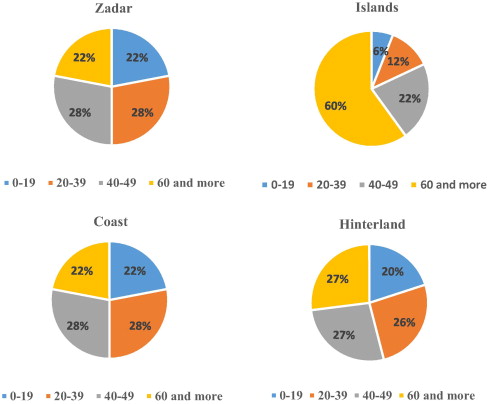
As Fig. 11 indicates, island population has the highest percentage (60%) over 60 years old, and this presumably include retired anglers, sailors and elderly in families. While in the coastal parts this figure stands at 22%. Consequently, the age group 0–19 (including primary and secondary education level) occupies on average 22% in Zadar and coastal areas, while on the islands, it stands at 6%. This is not surprising, since most of island schools have closed down due to insufficient number of students, which in turn, is an undesirable impact of island emigration to Zadar for working class families. Active population, including rage range between 20–39 and 40–49, is equally mostly concentrated around Zadar and coastal areas (28) while island only include 12%. Again, a lack of the employment opportunities such as local trades and poor ferry access to islands, but who have close ties with their islands, have inevitable affected this group.
Information about all education levels is scarce and incomplete and only includes information for city Zadar (Table 11). For the purpose of the analysis only primary and secondary level is discussed as it is crucial to obtain for every child.
| City Zadar | Registered pupils | Pupils completed school | Teachers | Teacher (women) | Teachers in full time employment |
|---|---|---|---|---|---|
| 2010/2011 | 6730 | 1032 | 495 | 413 | 420 |
| 2009/2010 | 6858 | 922 | 523 | 442 | 444 |
| 2008/2009 | 7226 | 991 | 513 | 425 | 438 |
| 2007/2008 | 7228 | 946 | 476 | 395 | 414 |
The last census (2011) reports worrying trends despite growth in completion in primary education, e.g., out of 6730 subscribed pupils in primary schools only 1032 completed it. While, the number of students enrolled in secondary education in 2009/2010 totals to 7.769 pupils. As picture shows, 46% (3570) attended technical schools, 30% (2339) of student enrolled in gymnasium. Less pupils were enrolled in special schools, while schools specialising in trade and craft occupation was only 17% (1412) and art schools 5% (307), adult education 2% (122) and special schools 0.002 (19) pupils (Zadra, d.o.o., 2013, p. 84).
Considering the fact that Zadar region is predominantly classified as rural, there is a failure to promote education in local trade and also vocational qualifications that may enable mothers living on the islands who decided to stay at home carrying for children until the school age, to return to work. Poor frequency, lengthy travel and cost, regardless of subsided travel for pupils with residence on the islands, still makes it difficult to commute daily to school. This trend indicates inevitable difficulties that island communities face in order to secure the future employment.
On the national level, Zadar remains in 5th place in relation to its size on the national level. Considering that the identical structure of population, 43% (31,627) of Zadar’s population is active (Table 12) in comparison with the national level (44%).
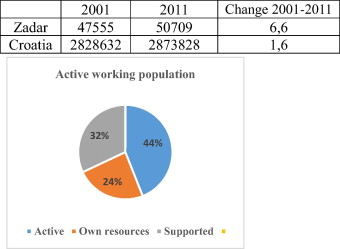 |
The figures in Table 12 suggest a relative increase in the number of active population but excludes information about the island population that commute daily or refers to local SMEs who conduct business on the islands either island SMEs. Information about these aspects in important but difficult to obtain and requires more resources, hence presenting the avenue for future research.
This paper lends support to other studies in island development that focus on the issue of island development, most notably, depopulation facing Scottish remote islands, e.g., Fetlar and how island communities try to deal with their vulnerability and reverse the negative impact such as depopulation and calling for a more participatory role of the local political actors and “sensitive investment” (Grydehøj, 2008, p.56). Baldacchino and Pleijel (2010) emphasises overreliance on financial assistance and transport subsides for the island Kökar in Åland Islands archipelago and which remains free for residents but at the cost of desired frequency and speed, as well as and creating employment that is relevant to maintaining the local community.
Analysis of the regional indicators in the case of island archipelago also highlight the problem of spatial configuration of island population e.g., Scottish islands and Âlan islands, where the population may be dispersed across the large geographical area unequally but can still generate the economic growth. This poses difficulties for theories of location (e.g., Gravity theory) that take into the account spatial configuration. Because population and economic activity is uneven distributed in space; nature determines endowments, location advantages, and human actions create a circular causation process that may produce convergence or divergence in terms of per capita income distribution in space. These factors inevitably affect the degree of urban–rural linkage. To understand better how these issues affect the islands on the local level, the next step is to support these objective trends with subjective experiences of the islanders.
Deconstructing the local experiences
This section discusses local qualitative trends that are difficult to map quantitatively for a various reasons; they are subjective experiences captured by author’s fieldwork and based on discussion with the locals and observations of the environment. The author recorded these events as faithfully as possible by first deconstructing them and then reconstructing them to arrive at the stories. The events could be classified as qualitative socio-economic and environmental processes affecting island development. Social processes include social exclusion, poverty, lack of access, low level of education, rising unemployment and neglected environment, and emigration. Economic processes include a lack of entrepreneurship and trading activities need for regular employment. Environmental processes include frequent electricity blackout, inadequate rubbish collection, non-existing sewage system and water supply, inadequate road infrastructure and strong de-cultivation processes. Island bushfires (e.g., in 2009) are a constant treat to livelihood and properties on the islands and have may have a devastating impact on the lives or land. Inevitably, these processes have long-term adverse effects on the overall development islands, as well as the appearance of the island. While this paper itself cannot do justice to all those issues that the author believes should be addressed, a number of the most frequent will be discussed.
Story 2. Water
The theme of this story is water. During the exceptionally hot summer (June–August) water is delivered by tanker according to the booking arrangements between the islanders. The author captures the event as a communal meeting that she attended and remembered during a stay on the island. Fig. 7 provides an interlude to the story.
The story is narrated as follows:
The Chief’s house was second on the right. When I entered it, suddenly there was silence. There were five men there, turning their heads towards me and at the Chief. I greeted everyone. The Chief showed me the chair and spoke in a calm and soft voice: “Now, brandy for you, isn’t it?”. I replied: “Yes. Thank you.” The conversation resumed. I sat patiently; listening to the discussion. The Chief was leading the discussion, giving advice to the others. Everybody respected him, after all they were all members of the communal group, some were family, some were newcomers, like my stepfather. And while the Chief was distributing drinks around the table, everybody returned to the main purpose of the meeting: to discuss the problem of the water supply. The islanders were discussing the date and people availability on the island at the time as they needed to be organised to help with the delivery of the water to each house through the heavy water pipes that are linked to the water tanks situated under the houses. The discussion started to escalate into a scene from a western movie, the noise was deafening, the atmosphere electric. Shouting is, as I came to learn, the norm in these meetings. Simultaneously, some islanders agreed while others were complaining. I was sitting and listening quietly to their conversation about the hot summer, the suffering olive trees and a shortage of water supply. I knew that the island has no mains water supply; each house has its own water tank situated below the house in which the rain water collects from the roof. The meeting lasted an hour and eventually an agreement was reached. A member of the group will draw a list of houses requesting the water and the list will be given to a supplier, a water tanker. At the end, everyone started to leave to do their odd weekend jobs. Some of them work on the mainland during the week but come after work, during the weekend or summer holidays on to the island.
The story highlights a scarcity of natural resource – water. Current state of water supply is plagued with the lack of actual data on how far has this project reached the islands, how much water is lost, what is the consumption and whether and to what extent there exits illegal connections. Table 13 provides latest summarised figures from the commissioned report into investigating these issues.
| 2011 | 2012 | 2013 | |
|---|---|---|---|
| SILBA | 8,893 | 9,143 | 4,493 |
| MOLAT | 6,020 | 4,655 | 2,575 |
| BRGULJE | 4,530 | 2,700 | 1,650 |
| ZAPUNTEL | 2,550 | 1,490 | 945 |
| VELI IŽ | 10,670 | 8,950 | 7,800 |
| MALI IŽ | 4,420 | 4,340 | 1,620 |
| POROVAC | 2,095 | 2,905 | 1,760 |
| OLIB | 160 | 490 | 0 |
| PREMUDA | 2,820 | 2,740 | 1,780 |
| IST | 5,160 | 5,360 | 2,625 |
| VELA RAVA | 3,260 | 2,240 | 1,565 |
| MALA RAVA | 630 | 885 | 855 |
For simplicity purpose, the table excludes figures for number of residents the largest amount is associated with the island with population up to 200 residents. It also ignores breakdown by month as it varies from year to year, with the biggest demand for water exits during the summer months June–August. Other islands are generally used water tank and water supply takes place by means of water carrier. In many cases the problem lies in the location of the reservoirs since the greater part of the islands has a limited number of height levels, the ground may be inaccessible because of poor road infrastructure so it would be difficult to lay pipeline route (Jurjević, 2013) and is particularly relevant to health and safety of drinking water.
Story 4. Island entrepreneurship
Every year, the anglers must pull their boats out of the sea in order to strip off the old paint and algae and repaint them. Fishing boats can range in size from a small vessel to much larger boats that can weigh up to 1.5 tonnes, in which case one needs to find 10–15 people. The locals pull the boat out and move it to the designated area so the renovation work on the boat’s hull could be carried out (see Fig. 8).
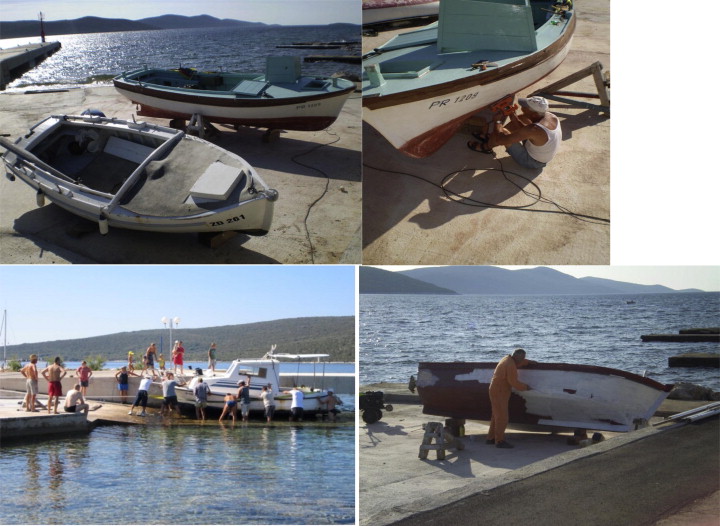
The author captured the task of pulling her father’s fishing boat out of the water for repair. Below is the narrated dialogue):
It was Saturday morning around 7 am when at breakfast my stepfather announced that pulling the boat out of the sea must take place today at 10 am. We would have to pull the boat out of the water so the old blue antirust paint could be stripped off and then the algae deposits on the hull could be removed. After this, the boat is left to dry overnight before it is repainted on Sunday. At 9.45 am sharp, I was sitting on the ferry dock while my stepfather was preparing the boat and tools for towing. I waited and looked at my watch. It was 9.50 am. But there is no one on the horizon. I turned to my stepfather and said ‘are you sure that they are coming?’ He replied: ‘Yes, do not worry. They will be here’. Five minutes passed, still no one had approached the dock. I turned to my stepfather again, saying ‘No one is coming, it is 10 am now’ of that I am sure! He replied again ‘Wait until 10.05 am’. I began thinking why are they not coming. They must come because my stepfather had helped them before. It would be very foolish of them not to come. Suddenly, I saw a line of people approaching, slowly, one by one. I turned to my stepfather, saying ‘So, here they are! Honestly, I really thought that no one would come’. He replied ‘I told you so, have patience!’ We both started laughing. The crowd got bigger and bigger. Around 20 people gathered out of nowhere. The job of pulling the boat out of the water could finally start. It was getting hotter, around 39 °C. Most of the men wore swimwear and some jumped into the sea straight away to cool off. Some waited for instructions. My stepfather started assembling them. First, the boat had to be tied to a rope connected to machines that would slowly pull the boat out of the sea. Five people went to one side of the boat and another five to the other. Together they held the boat across the thick wooden boards that lie in front of the boat. The idea is to hold the boat from both sides, making sure that it remains straight while being pulled out. With a lot of effort, plenty of shouting and frantic movements on the way at each step of towing, it took 20 min to pull the boat out. The first part of the mission was completed. The next stage involves stripping off the old paint, letting it dry and then repainting. The next day, they will have to put the boat back into the sea. On Sunday, at 5 pm, the men gathered again and towed the boat back into the sea. The mission for this year was accomplished.
The act began with a dialogue between the researcher and her stepfather. Through the conversation, there is a period of silence between these two: Will anyone come? There is a feeling of uncertainty in the air and the possibility that no one would come, and a stubborn confidence of believing that someone would come; these are two traits well known to man; a worry on the part of the person who does not know the islanders well (a researcher) and the confidence of the person (the researcher’s stepfather and an adopted local) who had been accepted by the islanders and who knew them well. Then the tempo of the process intensifies, the arrival of the islanders happens; the gathering is taking place. The act ends with a happy outcome: the boat was pulled out without any damage. What follows is a celebration of the success; the researcher’s stepfather summons everyone to his house for a glass of wine to thank them for coming.
In ethnological terms, the presented stories echoes the customs in rural communities that existed in continental Croatia, and which as this story shows, remain persistent in rural parts of the countries, e.g., islands. One such example is moba – a mutual aid between individuals or certain family. Moba means help that is returned. In many rural field activities that needed to be done on a specific time during the year, neighbours offer a voluntary help to each other, e.g., olives harvest in October, help with boat repair, etc. One striking feature of moba is that individuals do not expect to be paid in monetary value but receive a bottle of olive oil or wine once it is pressed. Moba, in this sense, is one of the usual forms of communication between the islanders that keeps the community spirit alive.
Story 5. Schools on islands
The last few decades with the drastic reduction of the insular population, negative birth rate and emigration of young people from the island, goes out and elementary schools on the islands, which leads to the current dire state when on the islands only three schools, with two primary schools on the island of Ugljan and long Island - “Valentin Klarin” in Prek and “Petar Lorini” in Sali (see Fig. 9).
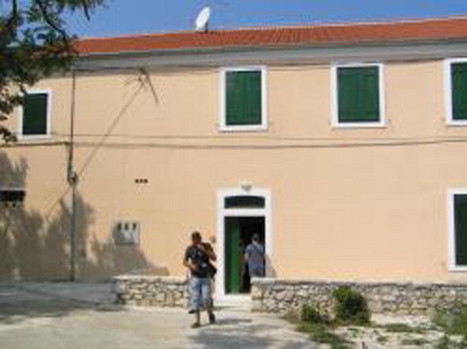
It is difficult to paint the picture of island education. Today on the islands in three schools only eighteen students. Last year the primary school on island Veli Iž attended only 13 students; on island.
Olib two students; on island Silba three students. The schools in island Molat and Premuda were closed. Increasing number of children are forced to attend schools in Zadar. (Radulić, 2013a). The island’s schools “Zadarski otoci” (except Ugljan and Dugi Otok, which do not fall into this group of islands) has more teachers than students. One teacher covers Olib, Silba, Molat and Premuda. Teachers live mostly in Zadar, working part time and teaching in several island schools, e.g., English teacher working on Iž and Olib travels weekly travel on both islands so must stay overnight and state covers her salary and travelling allowance. However, not all is bad. A small number of students means a better quality because teachers approach each child individually and with him doing more than when in class more than twenty students. The problem children on the islands face is a lack of socialisation because they are forced to live without peers and communicate mostly with the elderly (Radulić-Toman, 2008). This story provides a missing link that trends data about number of students’ attending the schools in Zadar cannot account for.
There are also other issues facing islands such as waste disposal as shown in Fig. 10. Once a year, island residents can dispose of waste which will be then towed away with the boat and paid by the local council.
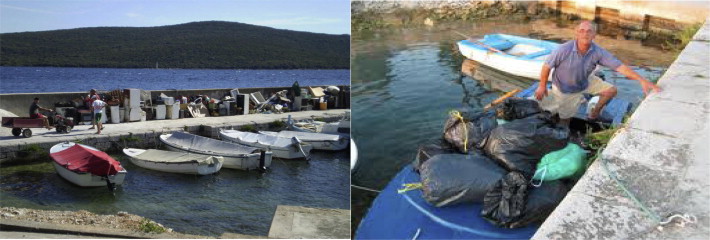
Weekly rubbish collection remains a responsibility of the retired member of local community, who tows it by his boat to the nearby island, Ugljan, where it is then collected by the council dustbin lorry. He is given the monthly allowance for this work as well as selling the ferry tickets from the island to Zadar.
Reconstructing the bigger picture
The regional and local trends paint the difficulties that remote and rural islands face and collectively represent a socio-economic impact of, e.g., ongoing litoralisation; emigration; a fear of losing the identity and a creation of the ghost villages. Islanders have developed special bonds within their island and with other islands and this is reflected in their immediate economic and social needs. This is evident in local stories presented in this paper.
In the absence of quality ferry provision there is a need to recognise more explicitly the role of the islands and inter-island connectedness as means of achieving greater self-sustainability and, thus, considering the economically viable inter-island ferry routes between the islands (Radulić, 2013b). Generally speaking, to consider building a bridge; two principal rules must be met; first is the location that most supports transport demand and how well served that location is by rail and road links; and second is the shortest distance across the sea. Government is currently considering building a tunnel between the port city Zadar (Gaženica) to island Ugljan worth €184 m (Zadarska županija, N.D.). However, this will not resolve the issue of inter-island connectedness. This requires the islands to be viewed as a network with islands well connected and this provides an avenue for further research.
Further support for Radulić (2013b) inter-island connectedness can be seen in growing initiative for “Promoting employability of young people on geographically isolated islands” (DEŠA, 2014). Young generations faces ongoing struggle due to remoteness, poor ferry access and high ferry prices, and lack of the facilities for education, e.g., lifelong learning and other basic services, e.g., local shops, post office. This suppress any willingness for entrepreneurism. Islanders complain of being treated a second class citizens and are excluded from the active participation in consultation process related to rural planning management and the use of funds. It is unclear who is involved in the strategic consultations. There is also a question of lifelong education and innovative forms of education that could be delivered and focused around educating for sustainable energy and establishing the networks with other island communities within the Europe and sharing best practices (DEŠA, 2014).
Arguably, political actors need to be more sensitive to the needs of island communities. Islanders play a big part in the local economy and a continuous problem of revitalising the island life needs addressing, e.g., introducing stimulating measures such as investment into infrastructure, e.g., eco-friendly and sustainable water supply, better transport links, broadband connectedness, healthcare and exploration of the natural resources and other socio-economic possibilities of the island. Current city planning focuses on metropolitan development and this reflects a lack of interest in connecting the city with periphery. With its seasonal rich economic activities, tourism and local trade, islands residents and SMEs are in a unique position to benefit from more frequent inter-island ferry routes. Yet, there is an unclear vision of a wider picture of the role of islands in regional development affects, e.g., trading opportunities for island SME, island entrepreneurship, technological innovations and labour migration from urban cities to rural islands.
Conclusion
The issue of island development with or without tourism is a much-neglected area of regional rural planning. In analysing the socio-economic impact of current ferry service provision, regional trends indicate ongoing litoralisation, ageing population, lack of educational opportunities and limited job opportunities for island population. This affects the revenue stream from the island tourism that depends on island accessibility by ferry. On local level, there is a fear of losing identity amongst the islanders. Environmental concerns remain ignored due to existing perceptions of the quality of environment and general waste management within the towns; thus contributing to the pollution and poor health of island population. A lack of basic visitor infrastructure, e.g., quality accommodation, cafes, food shops; impedes local and touristic activities. However, not all is lost. Islanders’ survival spirit remains high and in an attempt to adapt to economic uncertainty, island communities try to identify new ways of managing local economies. This paper provides such insight with the local stories of communal activities. Regardless of distance, the communities are able to survive by developing a different kind of jobs specialisations suited to local needs. As the distance is too great so does is transport cost, this calls for thinking differently about promoting the economic growth in rural regions. Perceptions of remoteness by the local government also affects the inward investment inflows, e.g., the level of the subsidies, and this needs to rectified. Governments are currently rethinking the investment into rural regions, e.g., investment into broadband connectedness. This indicates a paradigm shift in understanding the relationship between distance, transportation costs, and growth in rural regions. As the study focusses on the smaller geographical area of Zadar’s archipelago, further research and considering larger geographical coverage e.g., competiveness and sea transport beyond Zadar region would be desirable. Pressure to link research methods to evidence-based policy context indicates that research in space economics would benefit from having an interpretivistic insight and pluralistic quality. As this paper shows, both can seamlessly co-exist so to maximise the academic and practical impact.
References
- Baldacchino and Pleijel, 2010 G. Baldacchino, C. Pleijel European islands, development and the cohesion policy: a case study of Kökar, Åland Islands. Isl. Stud. J., 5 (1) (2010), pp. 89-110
- Baldacchino and Ferreira, 2013 G. Baldacchino, E.C.D. Ferreira Competing notions of diversity in archipelago tourism: transport logistics, official rhetoric and inter-island rivalry in the Azores. Isl. Stud. J., 8 (1) (2013), pp. 84-104
- Biagini et al., 1999 E. Biagini, B. Hoyle Insularity and development on an oceanic planet. E. Biagini, B. Hoyle (Eds.), Insularity and Development: International Perspectives on Islands, Pinter, London & New York (1999), pp. 1-16
- Brezzi et al., 2011 Brezzi, M., Dijkstra, L., Ruiz, V., 2011. "OECD Extended Regional Typology: The Economic Performance of Remote Rural Regions", OECD Regional Development Working Papers, No. 2011/06, OECD Publishing.
- Croatian Bureau of Statistics, 2013 Croatian Bureau of Statistics, 2013. GDP for Republic of Croatia, NUTS 2 level and Counties, 2011. NUMBER: 12.1.2. Retrieved from: <http://www.dzs.hr/Hrv_Eng/publication/2013/12-01-02_01_2013.htm>.
- Croatian Government, 2013 Croatian Government, 2013. Maritime Strategy Development and Integrated Maritime Policy of Croatia for the period from 2014–2020, Narodne novine, broj 181/04, 76/07, 146/08, 61/11 i 56/13.
- De Boe et al., 1999 De Boe, Ph., Grasland, C., Healy, A., 1999. Spatial integration. Paper presented by the co-ordinating workgroup 1.4. Study Programme on European Spatial Planning.
- Derrida, 1978 J. Derrida Writing and Difference. Routledge, London & New York (1978). Trans. by Alan Bass
- Derrida, 1981 J. Derrida Positions. University of Chicago Press, Chicago & London (1981). Trans. by Alan Bass
- DEŠA, 2014 DEŠA, 2014. Retrieved from: <http://desa-dubrovnik.hr/aktivnosti/okrugli-stol-kvaliteta-zivota-i-zaposljivost-mladih-osoba-na-udaljenim-otocima/>.
- Eriksen, 1993 T.H. Eriksen In which sense do cultural islands exist?. Soc. Anthropol., 1 (1b) (1993), pp. 133-147
- European Commission, 2007 European Commission, 2007. State aid for horizontal objectives of common interest: state aid for horizontal objectives and sectoral aid as% of total aid. Retrieved from: <http://ec.europa.eu/competition/state_aid/studies_reports/stat_tables.html#3_1> (accessed 20 October 2014).
- European Commission, 2012 European Commission, 2012. ‘European Union framework for State aid in the form of public service compensation (2011) (2012/C 8/03)’. Official Journal of the European Union. Retrieved from: <http://eur-lex.europa.eu/legal-content/EN/TXT/PDF/?uri=CELEX:52012XC0111(03)&from=EN>.
- Fredotović and Šimunović, 2006 Fredotović, M., Šimunović, I., 2006. New forms of littoralization in the Croatian Coastal Area: retrospect-prospect. Paper presented at Littoral 2006: Coastal Innovations and Initiatives, 18–20, September, Poland: Gdansk.
- Glasnik Grada Zadra, N.D Glasnik Grada Zadra, 4-04 i 3-08,4-08, 10-08. PROSTORNI PLAN UREĐENJA GRADA ZADRA. <http://www.grad-zadar.hr/plan/prostorni-plan-uredenja-grada-zadra-5.html>.
- Grydehøj, 2008 A. Grydehøj Nothing but a shepherd and his dog: social and economic effects of depopulation in Fetlar, Shetland. Shima, 2 (2) (2008), pp. 56-72. 20
- Grydehøj and Hayward, 2014 A. Grydehøj, P. Hayward Social and economic effects of spatial distribution in island communities: comparing the Isles of Scilly and Isle of Wight, UK. J. Mar. Isl. Cult., 3 (1) (2014), pp. 9-19, 10.1016/j.imic.2014.03.002
- Hidroproject-ing d.o.o., 2014 Hidroproject-ing d.o.o., 2014. Retrieved from: http://www.hp-ing.hr/.
- Higgins and Savoie, 2009 B. Higgins, D. Savoie Regional Development Theories and Their Application. Transaction Publishers, New Jersey; New Brunswick (2009)
- Jurjević, 2013 Jurjević, Lj., 2013. Vodoopskrba zadarskih otoka pokusat ce se rijesiti-europskim-novcem. Zadarski List. Retrieved from: <http://www.zadarskilist.hr/clanci/22112013/vodoopskrba-zadarskih-otoka-pokusat-ce-se-rijesiti-europskim-novcem>.
- Leimgruber, 2013 Leimgruber, W., 2013. Islands as marginal regions, marginal regions as islands?. In: Proceedings of the International Conference on Island Development, Penghu, Taiwan, 1–5 October 2013, P3-1–P3-14.
- Luić, 2013 Luić, A., 2013. Život na otocima nije romantičan. Zadarski List. Retrieved from: <http://www.zadarskilist.hr/clanci/26062013/zivot-na-otocima-nije-romantican>.
- Ministry of Regional Development, 2013 Ministry of Regional Development and EU Funds, 2013. Report on the effects of implementation of Islands Act in 2011. Retrieved from: https://razvoj.gov.hr/UserDocsImages//O%20ministarstvu/Regionalni%20razvoj/Otoci%20i%20priobalje//Izvje%C5%A1%C4%87e%20o%20u%C4%8Dincima%20provedbe%20Zakona%20o%20otocima%20u%202013.pdf.
- Mendas, 2014 Z. Mendas Experiencing Derrida through a communal friendship. Tamara J. Crit. Organ. Inq., 12 (4) (2014), pp. 17-31. (special issue: remembering derrida: a language of friendship and general issue articles)
- Miroslav Krleža Institute of Lexicography, N.D. Miroslav Krleža Institute of Lexicography, N.D. Retrieved from: <http://www.enciklopedija .hr/Natuknica.aspx?ID=53012>.
- Parr, 2005 J.B. Parr Perspectives on the city-region. Reg. Stud., 39 (5) (2005), pp. 555-566
- Perroux, 1950 F. Perroux Economic space: theory and applications. Q. J. Econ., 64 (1) (1950), pp. 89-104
- Perroux, 1988 F. Perroux The pole of development’s new place in a general theory of economic activity. B. Higgins, D. Savoie (Eds.), Regional Economic Development: Essays in Honour of Francois Perroux, Unwin Hyman, Boston (1988)
- Pons and Rullan, 2013 Pons, A., Rullan, O., 2013. Artificialization and islandness in coastal areas of Western Mediterranean Europe: with special attention to the Spanish tourist coast. In: Proceedings of the International Conference on Island Development, Penghu, Taiwan, 1–5 October 2013, P7-1–P7-12.
- Port Authority Zadar, N.D. Pons, A., Rullan, O., 2013. Artificialization and islandness in coastal areas of Western Mediterranean Europe: with special attention to the Spanish tourist coast. In: Proceedings of the International Conference on Island Development, Penghu, Taiwan, 1–5 October 2013, P7-1–P7-12. Port Authority Zadar, N.D. Transport statistics. Retrieved from: <http://www.cpa-zadar.hr/projekti> (accessed 20 October 2014).
- Radulić, 2013a Radulić, H., 2013a. “Danas u tri škole osamnaest učenika”, Zadar: Zadarski List. Retrieved from: <http://www.zadarskilist.hr/clanci/02102013/danas-u-tri-skole-osamnaest-ucenika>. Some arrangement have been made.
- Radulić, 2013b Radulić, R., 2013b. ‘Inter-island connectedness’, 4th July, Zadar: Town library. Retrieved from: <www.patriciamcconnell.com/theotherendoftheleash/the-concept-formerly-described-as-dominance#sthash.UN2Hr3qx.dpuf>.
- Radulić-Toman, 2008 Radulić-Toman, E., 2008. “Na četiri otoka šest učenika”, Zadar: Zadarski List. Retrieved from: <http://www.zadarskilist.hr/clanci/26082008/na-cetiri-otoka-sest-ucenika>.
- Zadarska županija, N.D. Zadarska županija, N.D. Program ruralnog razvoja Zadarske Županije 2012–2014. Zadar: ZADRA d.o.o. Retrieved from: <http://www.zadra.hr/wp-content/uploads/2013/05/razvojna_agencija_a4_final_sime.pdf>.
- ZADRA d.o.o., 2013a ZADRA, d.o.o.,2013a. Development strategy of the city of Zadar 2013–2020: The framework for the strategic development of Zadar to 2020. Retrieved from: <http://www.grad-zadar.hr/repos/doc/Strategija%20razvoja%20grada%20Zadra.pdf>.
- ZADRA d.o.o., 2013b ZADRA, d.o.o., 2013b. Republic of Croatia Zadar County Budget for city Zadar for 2014 and projections for 2015–2016. Retrieved from: <http://www.grad-zadar.hr/proracun-grada-zadra-za-2014-godinu-737/>.