Quality of Happiness from Small Fishermen on Sebatik Island: Legitimacy after Sand Mining Exploitation and Coastal Tourism
Abstract
Happiness is a current topic being exposed by emerging markets. In a constructive analogy, happiness is not only discussing the distribution of wealth, but also the revitalization of the environment that allows people to enjoy productive, long and healthy lives. Apart from generating profits, one of the company's dedications is distributing CSR. Companies that have capabilities must also be sensitive to WLB, especially to residents who live near the operating area. This study elaborates on the link between CSR and happiness through WLB. Of the 273 sample quotas, 214 of them agreed to be interviewed. Respondents who were invited were small fishermen from East Sebatik Island who received CSR financing from active companies engaged in coastal tourism and sand mining. With the CFA method, the following conclusions are found: (1) allocation from CSR strengthens WLB; (2) WLB plays a direct role in meaning of life and satisfactions, but not in feelings; (3) through WLB, CSR supports the meaning of life and satisfactions positively; (4) CSR actually does not affect the feelings mediated by WLB. For the case on East Sebatik, CSR practices in distributing grants to small fishermen are short-term in nature. In the principle of a sustainable environment, CSR transfer must contain things that are more comprehensive. The motivation for this research is to contribute to the practical interests of stakeholder actors, especially the government, by paying more attention to long-term policies in the fisheries sector. In addition, theoretical development is aimed at improving methodology in assessing fishermen's happiness to be more current, relevant, and specific by considering aspects beyond social and economic.
Keywords
Small fishermen, coorporate social responsibility, work-life balance, meaning of life, feelings, satisfactions
Introduction
Today, signals of a nation's prosperity are not only depicted by Gross Domestic Product (GDP) and GDP per capita in aggregate or the accumulation on the Human Development Index (HDI), but also by visualizing happiness. Developed countries are pioneering a new approach called the “Human Happiness Index”. HHI implies a holistic discipline rather than previous styles that present contradictions (Kapoor & Debroy, 2019; Osberg & Sharpe, 2002; Purnamasari et al., 2016). HHI is a more rational, broad and complex paradigm that is not only centered on the economy, but also shows the balance of the natural, housing and social environment that can affect human productivity (Ahtesham, 2020; Alsaadi & Miniaoui, 2018; Isa et al., 2019; Musikanski et al., 2017; Tofallis, 2020). From HHI, it can be seen how far individual happiness is to make life healthier. While money can bring pleasure, it does not describe complete joy. Rathschlag & Memmert (2013) and Tamminen & Dunn (2022) suggest that feelings of happiness will create competitive performance.
Sebatik Island is an area located between 2 countries (Indonesia-Malaysia). Administratively, this area is controlled by Malaysia and Indonesia. In the history of its formation, South Sebatik was controlled by the Republic of Indonesia and North Sebatik became a territory of the Kingdom of Malaysia (Briandana, 2019; Husain et al., 2021). Since the London Convention agreement in 1891, where half of the Sebatik area under Dutch auspices was taken by Indonesia, and half of Sebatik Island which was colonized by the British was given to Malaysia. From then on, the Sebatik region of Malaysia was a zone of East Tawau City (Sabah State) and Indonesia's Sebatik became the territory of Nunukan Regency (North Kalimantan Province).
Geographically, Sebatik Island under the Nunukan government has abundant natural potential (Brata et al., 2020; Sari & Sujarwoto, 2019). The most valuable asset and one that is often used by islanders is the sea (Raharjo & Anuar, 2022). The welfare of the islanders is highly dependent on natural products. After the investment permits were legalized by the local government, it became easier for foreign companies to enter Sebatik. The majority are engaged in mining exploitation and some of them focus on managing the destination. Under the pretext of improving the social situation and guaranteeing the economy of the local population, it actually disrupts the routine of the residents. Gradually, barriers can be reduced by involving community leaders in protecting environmental damage through contemporary partnership schemes.
Recently, new issues have emerged regarding new business fields that will be expanded to the sea area such as: exploitation of petroleum and liquefied natural gas. At the same time, overlapping and fighting over land between the islanders and the company sparked a dispute that led to a long debate. The intensity of sea sand excavation also threatens the ecosystem around the Sebatik Strait. At another moment, the government's initiative to bring in and collaborate with companies trying to advance Sebatik tourism is increasingly worrying. On the one hand, it appears to synergize with local wisdom. But, the profit motive is behind the company not to involve many islanders in growing tourism. Automatically, this causes a new burden for Sebatik, where the most obvious risk is that islanders who work as fishermen must survive in making a living. Although many experience symptoms of stress, some tend to adapt to the evidence. Apart from that, the fishermen took the initiative to be independent. What is quite heartbreaking is the challenge in catching fish. With boat/ship engines, knowledge, equipment and fishing methods that are still conventional, traditional fishermen from Sebatik Island are increasingly struggling to find fish in deeper seas and relatively far from the coastline, thus endangering the safety of lives. The origin of this setback has had a manipulative effect since the government entered into long-term investment contracts with several business networks for coastal destinations (Marina Beach, Indah Beach, Setabu Mangrove Park, and Batu Lamampu Beach) and several companies that are actively operating sea sand mining through land reclamation.
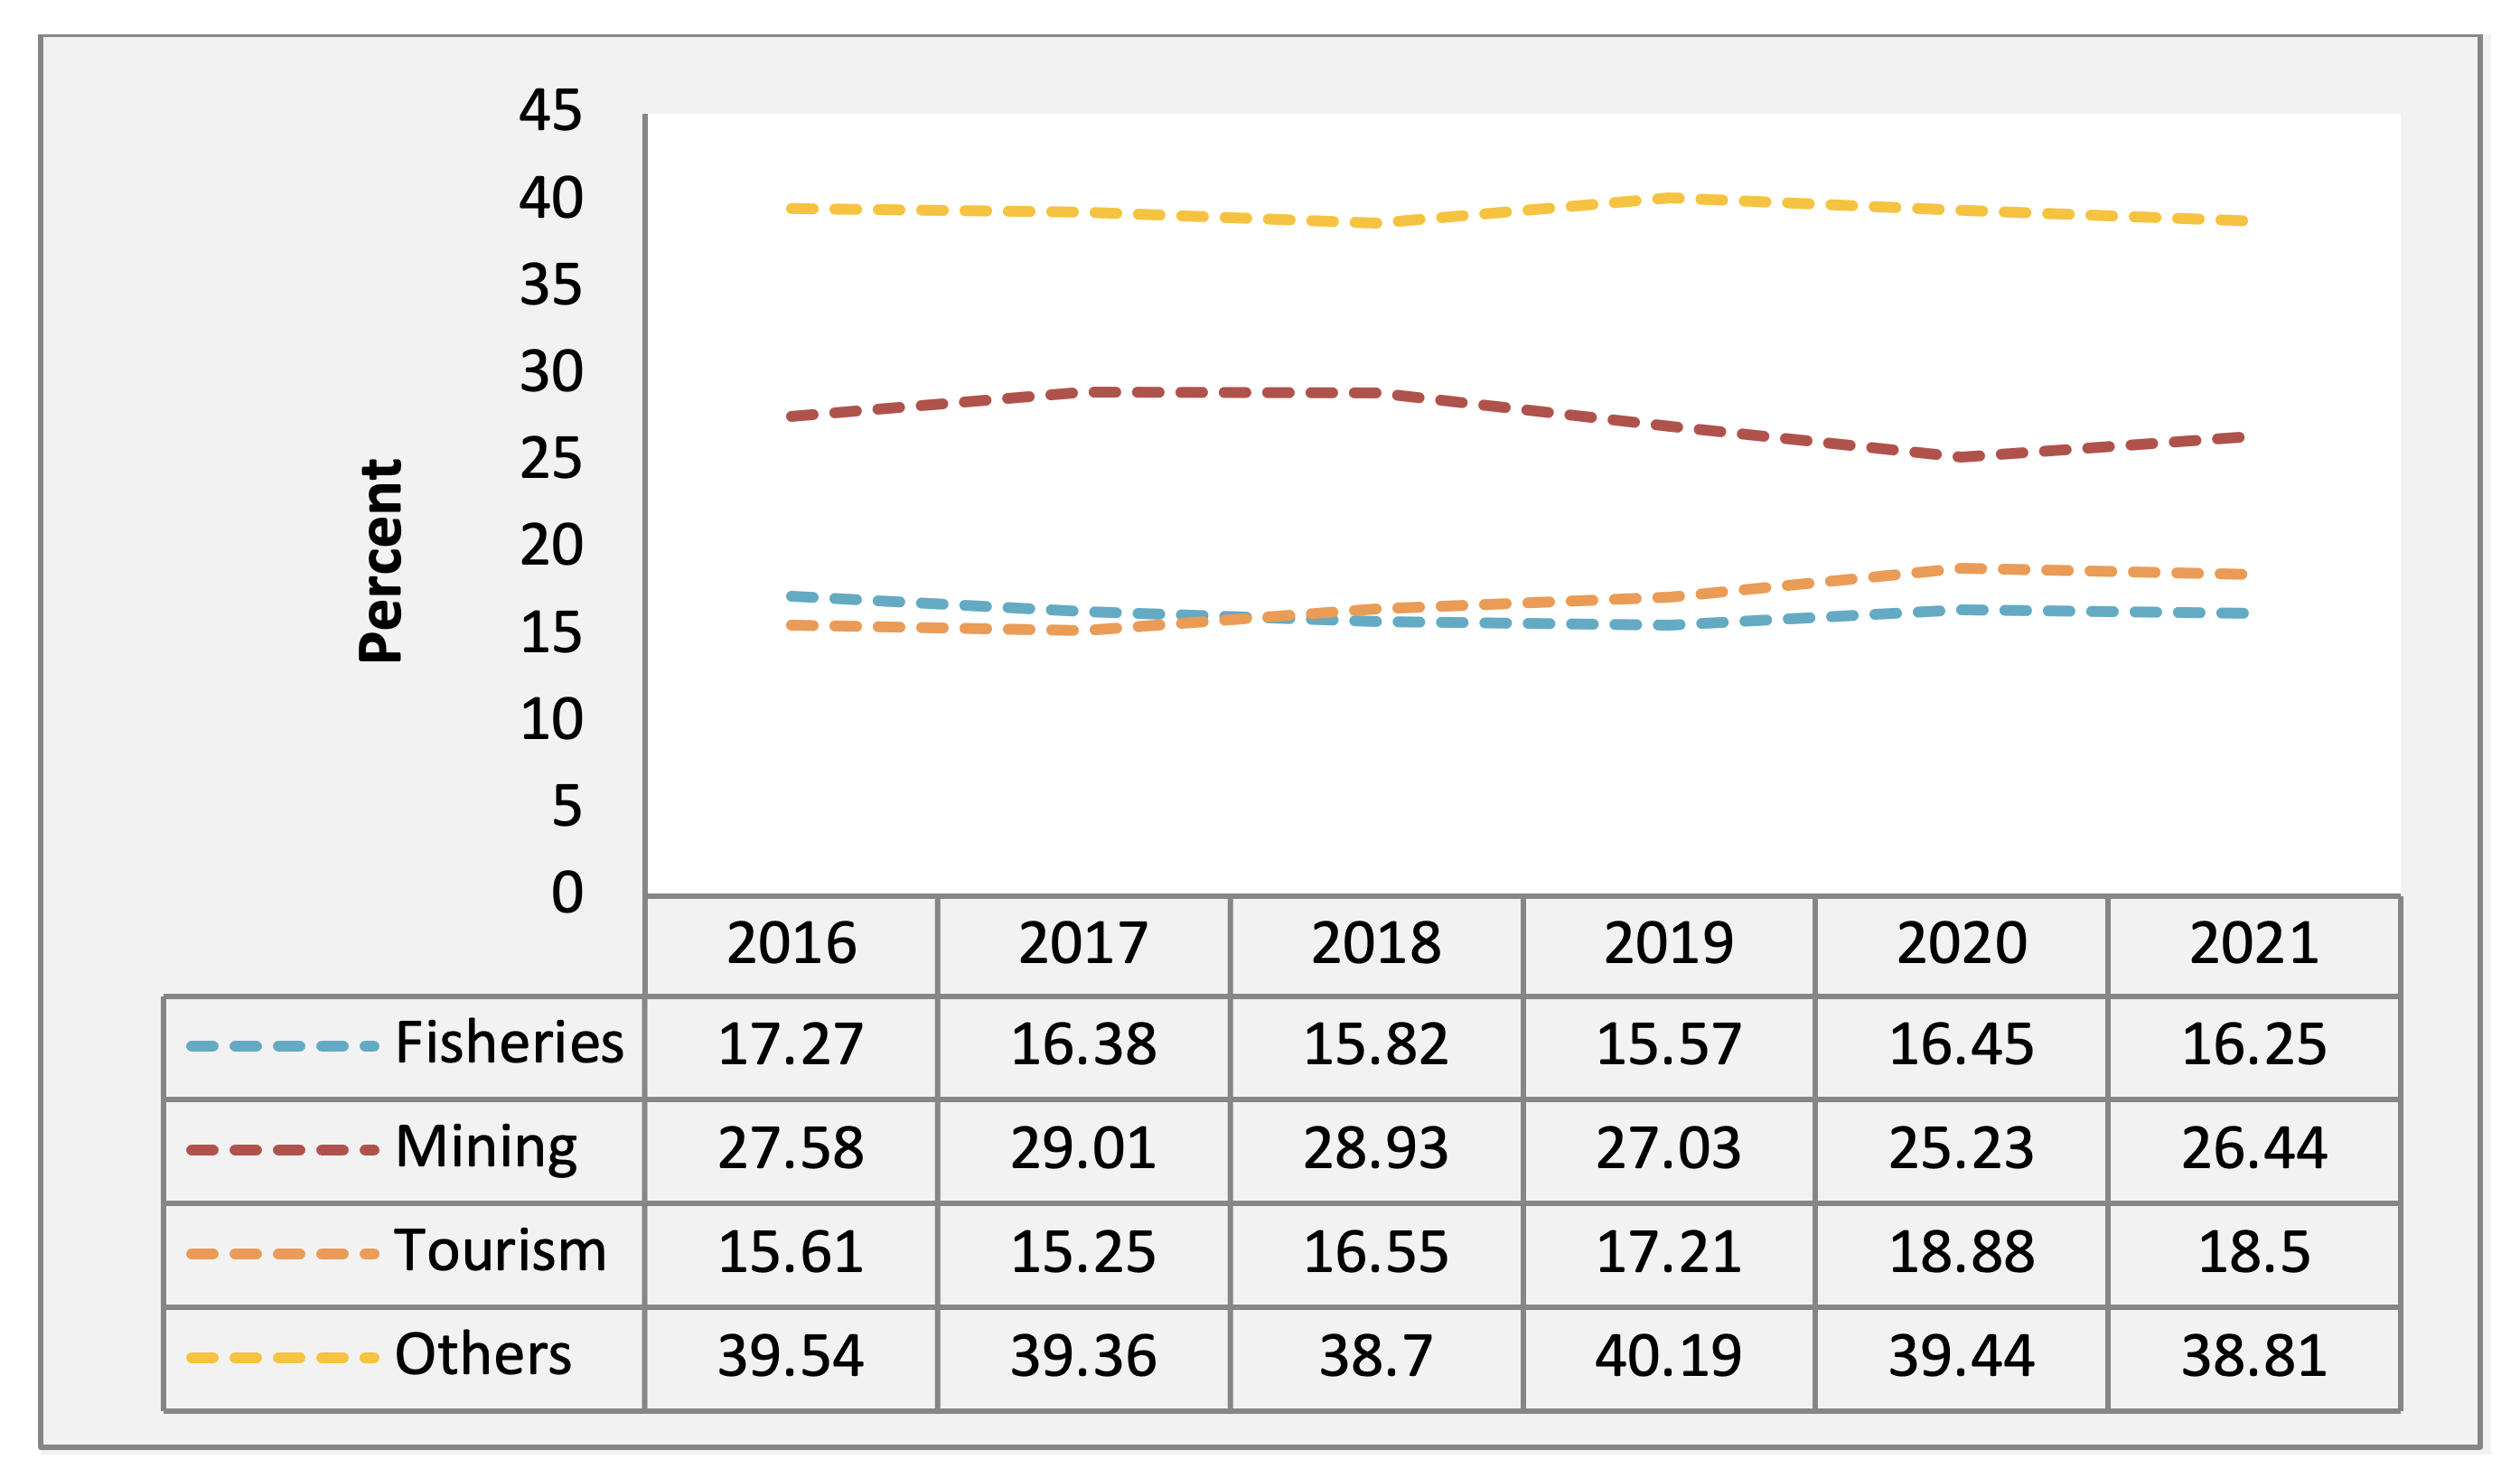
Over the past few decades, marine resources have become a leading sector. Now, there is a shift in the trend going forward from fisheries to coastal tourism and sand mining (see Figure 1). Both are priority sectors that have the opportunity to support the economy of Sebatik Island. During 2016-2021, the Gross Regional Domestic Product (GRDP) for the fisheries sector grew to 16.29%. The majority of the population of Sebatik Island depend on this sector. Fishermen are the main livelihood to generate income. However, the opportunity to get economic value is getting thinner due to intervention from the mining sector and the tourism sector. From a macroeconomic point of view, both contributed to Sebatik Island's GRDP with an average growth of 27.37% and 17%. Nearly half of Sebatik Island's economy is driven by the mining sector and the tourism sector up to 44.37%. From period to period (p-o-p), if we observe the third development, the fisheries sector has experienced a decline in economic growth in 2016-2019. After that it grew positively (16.45%), but again experienced a decrease of 0.20 points in 2020 (16.25%). The fisheries sector has experienced a crisis since the arrival of companies with large capital that acquired coastal tourism and sand mining. In fact, on 2017, the growth of the mining sector reached 29.01% and the most striking growth in tourism in 2020 was 18.88%. In general, the achievements of the two sectors in Sebatik Island's economic development have absorbed little in the workforce. Other sectors outside of fisheries, mining and tourism, such as: clean water and electricity, services, manufacturing, trade, construction, insurance and finance, real estate, information and communication, education, health and social, or warehousing and transportation contribute around on the economic growth of Sebatik Island.
The ideal solution to prevent conflict with the people of Sebatik Island while minimizing environmental impact is Corporate Social Responsibility (CSR). CSR as empathy, appreciation, and obligations of all companies that own shares and are protected by law. Mechanisms in distributing CSR include: incentive support, use of renewable energy sources, provision of clean water facilities, environmentally sound waste control, volunteers for humanitarian or other philanthropic communities, and natural rehabilitation. As an illustration, referring to the Regional Regulation of East Kalimantan Province Number: 3 of 2013 (Article 23, Paragraph 1) concerning "Social and Environmental Responsibility" or TJSL for Limited Liability Companies (PT) and the partnership and community development program explains that the financing for the implementation of TJSL allocates at least 3% of the company's net profit annually. Speaking of incentive assistance, TJSL from companies according to regulations does not specify the minimum amount of funds that must be donated to TJSL. Yet, in Law Number: 40 of 2007 (Article 74, Paragraph 2) it is only stated that TJSL is a company obligation that is budgeted for and calculated as operational costs by taking into account propriety and fairness. In practice, several regions have regulated the minimum size of the TJSL budget in Regional Regulations (Wijaya et al., 2019).
For the residents of Sebatik Island, one of the vital problems (such as welfare) can be overcome by CSR. In interdisciplinary developments, CSR segmentation is to create inclusive human capital. Business industry reform that prioritizes CSR in serving, requires building good relations, and reducing business risk, as an idea to improve the company's image and reputation in the public eye. If thought critically, the position of CSR cannot ensure the continued survival of the islanders.
According to Sánchez-Hernández et al. (2019) and Soneye et al. (2023), many advanced companies implementing Work-Life Balance (WLB) for their employees. A mode for balancing life in the office and outside the office which makes employees happier (Elnanto & Suharti, 2021; Gragnano et al., 2020; Ötken & Erben, 2013; Rao & Indla, 2010). The hope is to shape employee professionalism towards a competitive organization without reducing talent. Strategic to improve WLB through alignment in innovation, instilling creativity, maintaining mental and physical health, optimizing loyalty, and reducing burnout. Not only is the concern internal to the organization, the nuances of WLB can also be transmitted outside the company. As a preference, the company's commitment to providing CSR to the surrounding community, including work practice programs/apprenticeships. In its implication, the population of productive age or the younger generation is fostered, educated and taught about soft skills and hard skills according to their interests. Before entering the world of work, they are trained by the CSR division to develop leadership. Basically, the concept of CSR does not have a direct impact on WLB residents, but job satisfaction will increase if the welfare polemic is reduced. Completely, personal behavior that can determine whether the WLB is successful or not.
The relationship between CSR and WLB, especially those aimed at external companies, has not been highlighted much. In this modern era, companies do not only think about the careers of their employees, but also in sync with the environment and social surroundings. CSR is required to upgrade in an integrated manner to stake holders. On Sebatik Island, CSR focuses on grants. Not much has led to training or seriousness on an ongoing basis. For the islanders, it is as if CSR is narrated as a formal government instruction. In fact, in a broad sense, CSR displays the good intentions of companies to give justice to local residents in an impressive manner. In an agreement that is repressive, of course it is not justified. Everything related to production inputs that have consequences for social problems in the surrounding environment, must be thoroughly evaluated. Therefore, the CSR package must exceed the target. The value of CSR can be accessed by all those affected as a return from the company for the effects it causes. Apart from happiness, WLB is also a symbol of prosperity for heads of families who work in the maritime field (Rahayu, 2020). With the existence of corporate subsidies, it is believed that WLB residents of the island can grow.
In the perspective of human happiness as reflected by HHI, there is a fundamental weakness and this lies in its mixed components. The method that combines qualitative and quantitative results in multiple understandings, narrow articulations, and is abstract in nature when it comes to the structure of individual and group household prosperity. Imperfections in the calculation patterns do not represent the majority of Indonesia's population, especially for those who live below decent wage standards, poverty, unemployed, low skills, and decreased productivity. As shown by Table 1, there are 3 dimensional indicators of human happiness, which include: the meaning of life, feelings, and satisfaction. Then, from satisfaction, it is divided into 2 sub-indicators: social life satisfaction and personal life satisfaction. The unit quantity based on indicators and sub-indicators is 19 units. We offer a rescaling of human happiness in a more specific context. The existing indices only conditionally photograph individual happiness or on endogenous aspects, but do not review exogenous aspects.
In detail, the inequality in the concept of HHI is also highlighted in the indicators. Imbalance in non-linear assessment. In fact, the criteria on the meaning of life and feelings are calculated according to individual assumptions which are poured into ordinal or interval. During the interview process, the surveyor also asked about satisfaction status through a list of questions compiled via nominal or ratio data. In this viewpoint, the characteristics of the various assessments actually trigger controversy. So far, another difficulty that stands out is the implementation which only focuses on what is channeled by the government, for example: regulation, outreach, law enforcement, and the provision of public facilities, but does not consider the elements or participation of the private sector which is closely related to development. Take for example is the company. The role of companies from many regions in Indonesia is so crucial. When a company invests and carries out economic activities around residential areas, it certainly has the capacity for social responsibility.
| Indicators | Sub-indicator | Dimensions | Item |
|---|---|---|---|
| Meaning of life | - | Independence, mastery of environment, self-development, positive relationships with others, purpose in life, and self-acceptance | 6 |
| Feelings | - | Feelings of joy, feelings of not being anxious, and feelings of not being depressed | 3 |
| Satisfactions | Social life satisfaction | Security conditions, environmental conditions, social relations, availability of free time, and household harmony | 5 |
| Personal life satisfaction | Education and skills, work/business/main activity, household income, health, and housing conditions and facilities | 5 | |
| Total | 19 | ||
Often, stakeholders claim that CSR has relatively no implications for the progress of the environment, economy, culture and other pillars in society. The essence of CSR is to support the improvement of the quality of life of communities affected by business. Apart from that, due to the fact that the budget realization was small and not commensurate with the government's development agenda, it gave rise to dualism. Also, the dynamics sometimes conflict with rural planning which requires the involvement of stakeholders. Finally, in accommodating and making decisions, the government does not invite companies. collaborate with companies. In fact, the government has the highest hierarchy of power. However, the company's presence in the community, including island residents, must remain oriented towards social care, protecting surrounding habitats, reducing environmental pollution, and facilitating the aspirations of various communities without neglecting CSR procedures. Thus, the mission of this research is to investigate the interrelationships in the internal factors that shape the happiness of small fishermen bridged by CSR. The motivation in this study is also concentrated on the urgency of WLB in playing its effect to stimulate fishermen's happiness.
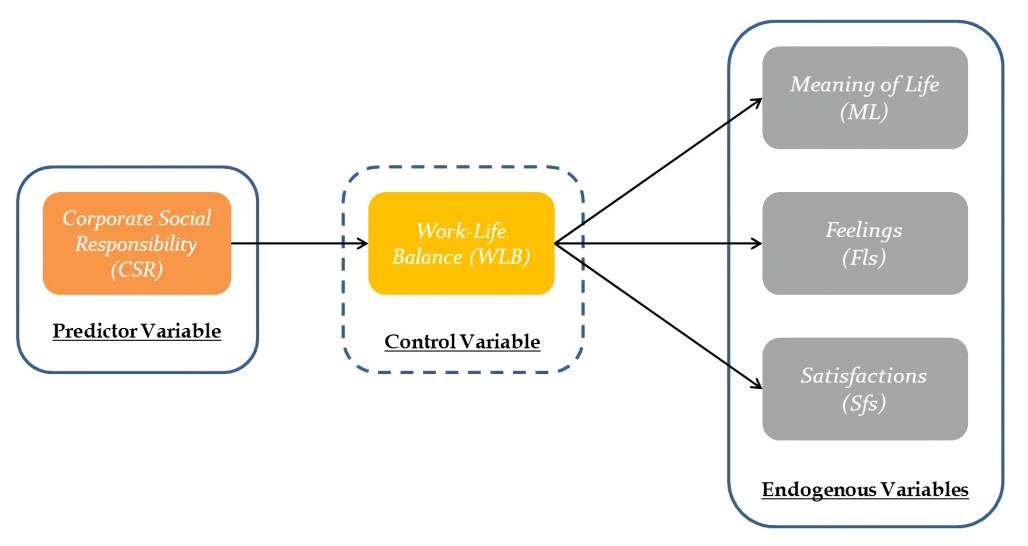
This study adopts the premise of HHI, but does not replicate the government's randomized survey form. The model framework was developed by including CSR as a predictor variable, while WLB was designed to be a control variable, and 3 indicators on happiness were integrated into endogenous variables. Operationally, Figure 2 simulates 5 variables to be diagnosed. Each variable has an implicit definition. Predictor variables are intended to predict or correlate with endogenous variables. Then, the endogenous variables are identical to the independent variables determined by the predictor variables. Control variables are variables that are kept constant in the interaction between predictor variables and endogenous variables so that they are not controlled by other entities outside the model and remove residues. The research questions are detailed below.
- Does CSR have an impact on the WLB of small fishermen?
- What is the causality between WLB and the happiness of small fishermen?
- Can WLB play a vital role in the relationship between CSR and the happiness of small fishermen?
Methodology
Respondents
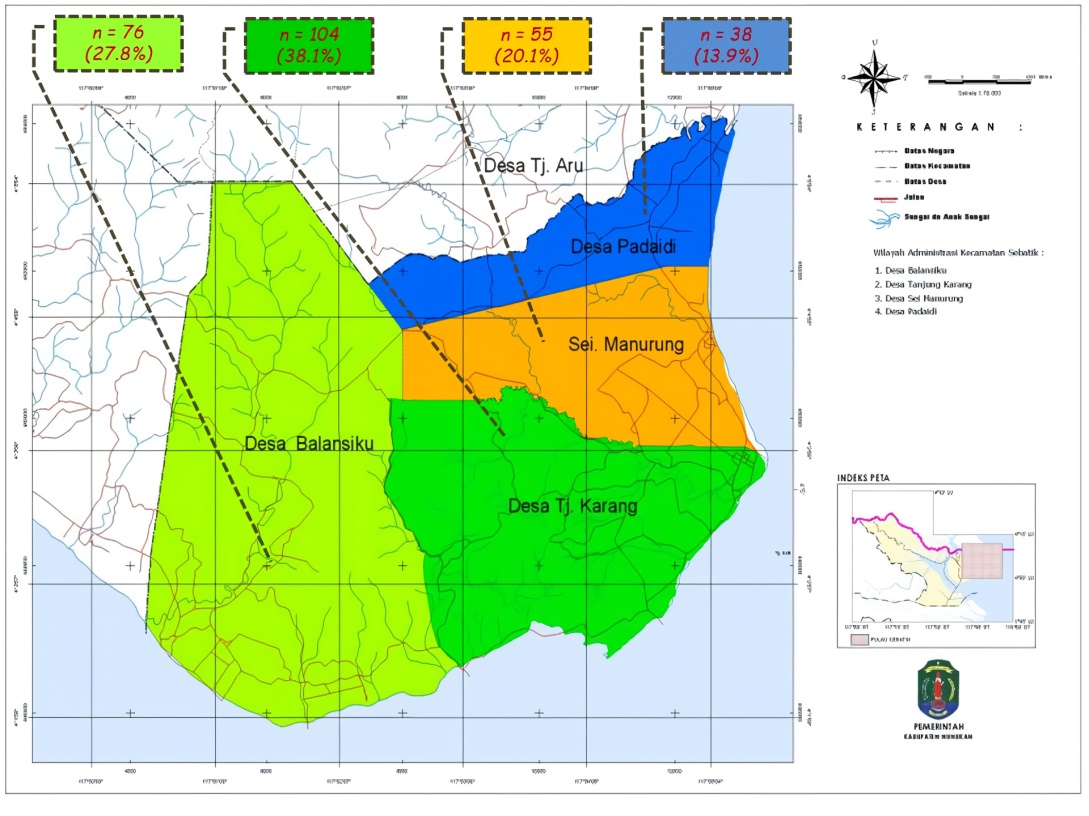
The sampling technique was identified via quota sampling. This method relies on non-probability manifold samples that are developed non-randomly. Its sample clusters enable accurate proportioning. The description of the respondents is obtained from the annual publication released by the BPS-Statistics of Nunukan Regency (2022). From the official document, it is known that the frequency is 273. Figure 3 maps the population of informants who live in 4 villages: Tanjung Karang (38.1%), Sei Manurung (20.1%), Padaidi (13.9%), and Balansiku (27.8%).
The sample is targeted at small-scale fishermen in East Sebatik who receive CSR in the form of financial grants. Too, they are fishermen who only rely on catching marine life as a primary profession or do not have a side job, have low incomes below the minimum wage for Nunukan Regency, recipients of CSR grants (non-government), non-cultivation fishermen, and are willing to spend time when being surveyed. The key informants according to the classification are 273 fishermen (see Table 2). Of that volume, the selected sample was 78.4%, while 21.6% were not followed up.
| Response | n | % |
|---|---|---|
| Not willing to be interviewed | 59 | 21.6 |
| Willing to be interviewed | 214 | 78.4 |
| Total | 273 | 100 |
Variables and Instrument
In line with Figure 1 above, there are recorded 5 variables being explored with a total of 28 attributes. CSR consists of 6 attributes, WLB consists of 3 attributes, Meaning of Life consists of 6 attributes, Feelings consists of 3 attributes, and Satisfaction consists of 10 attributes. Each variable has a different code. Technically, "CSR" is for the code from Corporate Social Responsibility, "WLB" is for the code from Work-Life-Balance, "ML" is for the code from Meaning of Life, "Fls" is for the code from Feelings, and "Sfs" is for the code from Satisfactions. Uniquely, the 2 sub-indicators (personal life satisfaction and social life satisfaction) of the HHI satisfaction indicator are described separately, but in this case study both are combined into 1 variable. Table 3 summarizes the scope of the variables studied.
| Variable Class and Name | Attributes (Labels) | Literature Sources | Projection |
|---|---|---|---|
| Predictor variable | |||
| CSR | Economy (CSR1); Social (CSR2); Environment (CSR3); Planet (CSR4); People (CSR); Profit (CSR6) | Abdelkarim & Mokhtari (2019); Chwiłkowska-Kubala et al. (2021); Gallego-Álvarez (2006); Giannarakis et al. (2009); Idowu & Kasum (2014); Wijonarko & Astuti (2022) | +/- |
| Control variable | |||
| WLB | Satisfaction balance (WLB1); Time balance (WLB2); Balance of engagement (WLB3) | Lestari et al. (2021); Rahman (2019); Živčicová et al. (2017) | +/- |
| Endogenous variable | |||
| - Meaning of Life | - Independence (ML1); Environmental mastery (ML2); Self-development (ML3); Positive relationships with others (ML4); Life goals (ML5); Self-acceptance (ML6) | Hadi et al. (2018); Hidayat et al. (2019); Sahlan (2020); ZA et al. (2021) | +/- |
| - Feelings | - Feelings of joy (Fls1); Feelings of not being anxious (Fls2); Feelings of not being depressed (Fls3) | +/- | |
| - Satisfactions | - Security conditions (Sfs1); Environment conditions (Sfs2); Social relations (Sfs3); Availability of free time (Sfs4); Household harmonization (Sfs5); Education and skills (Sfs6); Main job (Sfs7); Household income (Sfs8); Health (Sfs8); Household conditions and facilities (Sfs10) | +/- | |
| Option | Ratings |
|---|---|
| Very relevant | 5 |
| Relevant | 4 |
| Moderate | 3 |
| Inappropriate | 2 |
| Very inappropriate | 1 |
The logical reason for choosing East Sebatik as the foundation for data collection is because this region is known for its rich marine resources (Elyta et al., 2022; Salim et al., 2020). The field observation schedule was held from September 2022 to April 2023. Interview systematics are connected with variables. After the enumerators found respondents, interviews were immediately conducted. The answers of all informants were tabulated using a Likert score. The output is the latest research reviewing HHI in full. The reactions of the fishermen were verified in a questionnaire which was given 5 choices (see Table 4). Explicitly, the questionnaire was targeted at fishermen in East Sebatik with special qualifications related to CSR allocation to WLB and happiness. The questionnaire distribution scenario is very dependent on key informants' understanding of the problems of company activities that exploit coastal resources, such as sand mining and marine tourism development, which have the potential to harm fishermen's livelihoods. Besides that, CSR distribution is not yet fully optimal and professional for sustainable environmental management. The CSR assistance transferred to fishermen also does not represent proportional action as a follow-up to the company's concern for the existing situation.
Data Extraction
The data set that has been collected is created by adopting Confirmatory Factor Analysis (CFA). This tool is geared towards dissecting data constructs. In practice, material in statistical interpretation includes: questionnaire fit test and hypothesis testing. Testing the suitability of the questionnaire is displayed by validity, reliability and mean. Hypothesis testing emphasizes the significance value and t-student. Furthermore, data input is applied to the IBM-SPSS system. The basic equation on write validity is below.
$$r_{xy}=\frac{n\sum_{i=1}^{n}{x_iy_i}-\left[\sum_{i=1}^{n}x_i\sum_{i=1}^{n}y_i\right]}{\sqrt{\left\{n\sum_{i=1}^{n}x_i^2-\left[\sum_{i=1}^{n}x_i\right]^2\right\}\left\{n\sum_{i=1}^{n}{y_i^2-\left[\sum_{i=1}^{n}y_i\right]^2}\right\}}} $$
Where: \(r_{xy}\) = correlation between variables; \(x_i\) = data values for the X variable group; \(y_i\) = data values for the Y variable group; \(n\) = number of observations; \(i\) = item.
The sample standard applied is 214, so \(r_{xy}\) table = .506. The hypothesis on the validity of each item in the attribute variable is based on the following:
-
\(H_0\) = accepted, if the score on the attribute variable is positively correlated with the factor
\(H_0\) = rejected, if the variable attribute is not positively correlated with the factor
The reliability test detected through the Kaiser Meyer Olkin-Measure of Sampling Adequacy (KMO-MSA) is described as follows:
$$KMO-MSA=\frac{\begin{matrix}\mathrm{\Sigma}\\k\neq j\\\end{matrix}{{\ r}^2}_{jk}}{\begin{matrix}\mathrm{\Sigma}\\k\neq j\\\end{matrix}{{\ r}^2}_{jk}+\begin{matrix}\mathrm{\Sigma}\\k\neq j\\\end{matrix}{{\ a}^2}_{jk}},i=1,2,\ldots,p;j=1,2,\ldots,p$$
Where: \(r_{jk}\) = correlation between the variables in question and other variables; \(a_{jk}\) = partial correlation; \(p\) = variable pair.
The second formulation, estimated reliability using Bartlett's Test of Sphericity is as follows:
$$X_{obs}^2=-\left[\left(n-1\right)-\frac{\left(2p+5\right)}{6}\right]1n|R|$$
Where: \(obs\) = observation; \(n\) = number of samples; \(p\) = variable pair; \(|R|\) = determinants of the correlation matrix.
The decision for Bartlett's test is:
-
\(H_0\) = rejected, if \( X_{obs}^2 \geq X_{\sigma.p\ (p-1)/2}^2 \)
\(H_0\) = accepted, if \( X_{obs}^2 < X_{\sigma.p\ (p-1)/2}^2 \)
In econometrics, the mean value formula is described as follows:
$$\bar{x}={\bar{x}}_s+p\frac{\sum_{i=1}^{r}{f_ix_i}}{\sum_{i=1}^{r}f_i}$$
Where: \(\bar{x}\) = mean; \({\bar{x}}_s\) = estimated average; \(x_i\) = midpoint of the class interval; \(f_i\) = class frequency; \(Σ\) = sigma notation; \(k\) = interval length.
Finally, the specifications in the experiment linking WLB in the interaction between CSR and fishermen's happiness (meaning of life, feelings, and satisfactions) are varied as follows:
$${\hat{Y}}_i=\beta_0+\beta_1X_i+\beta_2M_i+\beta_3X_i{\ast M}_i$$
Where: \(\hat{Y}\) = endogenous; \(β_0\) = intercept; \(X\) = predictor; \(M\) = moderation; \(β_1\), \(β_2\), \(β_3\) = coefficient; \(i\) = slope.
Results
Profile of Respondent
Table 5 describes the identity of the respondents. Overall, half of the total respondents are aged 25-35 years. Respondents in the age group 36-46 years (26.6%), aged <25 years (14.5%), and aged >46 years (7.9%). Among the existing respondents, 68.2% of them are married, thus bearing the burden of the family and 31.8% are single or have no family dependents. The types of fishing vehicles were dominated by boats (79.4%) compared to machine ship (20.6%). In their profession as fishermen, it can be seen that the main catch types of the respondents are relatively varied, where 33.6% are expansive towards fishing, while other catch commodities are shrimp (29.4%), crabs (21.5%), squid (11.7%), and seashells (3.7%). During interviews, 41.6% of respondents admitted using fishing gear in the form of hook and line, seine net (36%), harpoon/trident/spearfishing (16.8%), and trawl (5.6%). With simple equipment, this indicates that fishery species in the Sebatik Sea are still sustainable, especially sea corals. For each month, the majority of the average catch reaches 100 kg-250 kg (61.2%). With marine biota fishing areas close to the shoreline, fishermen are more efficient at saving operational costs, time and energy. Yet, 23.4% are frustrated that the current situation is more difficult after the routine of tourism and sand mining, so that the average catch of marine products in a month is only around <100 kg. Even so, 15.4% of fishermen in East Sebatik are still able to get marine catches of up to >250 kg.
| Characteristics | Description | n | Percentage |
|---|---|---|---|
| Age (years) | <25 | 31 | 14.5 |
| 25–35 | 109 | 50.9 | |
| 36–46 | 57 | 26.6 | |
| >46 | 17 | 7.9 | |
| Supported family | There isn't any | 68 | 31.8 |
| Children and wife | 146 | 68.2 | |
| Fishing vehicle | Boat | 170 | 79.4 |
| Machine ship | 44 | 20.6 | |
| Type of marine catch (main) | Fish | 72 | 33.6 |
| Squid | 25 | 11.7 | |
| Shrimp | 63 | 29.4 | |
| Crab | 46 | 21.5 | |
| Seashell | 8 | 3.7 | |
| Fishing equipment | Hook and line | 89 | 41.6 |
| Harpoon/trident/spearfishing | 36 | 16.8 | |
| Seine net | 77 | 36 | |
| Trawl | 12 | 5.6 | |
| Catch volume (kg/month) | <100 kg | 50 | 23.4 |
| 100 kg–250 kg | 131 | 61.2 | |
| >250 kg | 33 | 15.4 | |
| Income (nominal/month) | <IDR 2,000,000 | 64 | 29.9 |
| IDR 2,000,000–2,500,000 | 38 | 17.8 | |
| IDR 2,600,000–3,000,000 | 112 | 52.3 | |
| Formal education certificate | Elementary school | 73 | 34.1 |
| Junior high school | 86 | 40.2 | |
| Senior high school | 55 | 25.7 | |
| CSR distribution company category | Sand mining | 145 | 67.8 |
| Coastal tourism | 69 | 32.2 | |
| Grants received (nominal) | IDR 700,000 | 71 | 33.2 |
| IDR 850,000 | 84 | 39.3 | |
| IDR 1,000,000 | 37 | 17.3 | |
| IDR 1,250,000 | 22 | 10.3 | |
| Duration | Per month | 19 | 8.9 |
| Per quarterly | 146 | 68.2 | |
| Per year | 49 | 22.9 |
In terms of average income per month converted into Indonesian Rupiah (IDR) based on the District Minimum Wage (UMK) of IDR 3,319,134, it was detected that more than half of fishermen or 52.3% of respondents whose income reached IDR 2,600,000- IDR 3,000,000. Meanwhile, 29.9% had income <IDR 2,000,000 and 17.8% had income IDR 2,000,000-IDR 2,500,000. This is caused by a low level of knowledge. The educational background of the respondents was dominated by junior high school graduates (40.2%), while graduates from elementary school (34.1%) and high school (25.7%). Surprisingly, none of the fishermen graduated from campus. Generally, their families, especially fishermen's children who have bachelor's certificates, do not continue this profession and prefer to migrate to cities to look for job vacancies or work in the service sector. In other words, there is no successor/regeneration in fighting for the life of fishermen's families.
Starting in 2018, 67.8% of respondents said that they had received CSR grants from sand mining companies and 32.2% were disbursed by companies that manage coastal tourism. If diversified into nominal, the value received reaches IDR 850,000 (39.3%), IDR 700,000 (33.2%), IDR 1,000,000 (17.3%), and IDR 1,250,000 (10.3%). The average nominal is an agreement made between the company and local fishermen bridged by the government. Through long consultations, the companies followed up by dividing the CSR funds into 3 schemes. CSR grants are addressed to small fishermen whose environment is affected by the company with 2 criteria: having a permanent resident card (domiciled on Sebatik Island) and those who have submitted/officially registered under the auspices of the fishing community. Based on survey data collection, CSR money is distributed to 68.2% (quarterly), 22.9% (per year), and 8.9% (per month). The difference in duration depends on the credibility of the grantee after the field inspection.
Questionnaire Matching Test
Table 6 recapitulates that out of a total of 28 attributes from 5 main variables, all indicators are in the "valid" category. All attribute variables are positively correlated with the construct, where the coefficient values meet the target (rxy > .506). When broken down by variable, the highest attribute is CSR2 (rxy = .907), while the smallest is CSR3 (rxy = .800). In WLB, the largest is WLB2 (rxy = .903) and the lowest is WLB1 (rxy = .855). Interestingly, for the meaning of life, the influential dimension is ML1 (rxy = .961), while the smallest coefficient is ML3 (rxy = .698). From the other corridors, the coefficient score on feelings is classified as “moderate”, where Fls3 is the lowest (rxy = .417) and the highest is Fls1 (rxy = .656). Partially, the correlation value on satisfactions is quite diverse. The most striking attribute is Sfs4 (rxy = .915) and the least is Sfs9 (rxy = .528).
| Variables and Questions | Correlation | KMO-MSA (Sig.) | Mean |
|---|---|---|---|
| CSR | .771* (.014) |
3.12 | |
| CSR1. I receive economic benefits from CSR products | .887 | 2.9 | |
| CSR2. I receive social benefits from CSR products | .907 | 3.42 | |
| CSR3. I receive environmental benefits from CSR products | .800 | 2.93 | |
| CSR4. CSR products are expected to save the planet | .822 | 3.12 | |
| CSR5. CSR products do not go astray in protecting people | .848 | 2.63 | |
| CSR6. CSR products are not just focused on profit | .882 | 3.72 | |
| WLB | .653** (.000) |
3.22 | |
| WLB1. I am satisfied with the current profession, so that it does not interfere with rest | .855 | 3.21 | |
| WLB2. I can manage my work time and don't overdo it | .903 | 3.15 | |
| WLB3. I don't want to bring the demands of work with personal matters at home | .875 | 3.3 | |
| Meaning of Life | .869** (.000) |
3.01 | |
| ML1. I am obsessed with living more independently | .961 | 3.51 | |
| ML2. I have experience with the environment | .867 | 2.96 | |
| ML3. Self-development is formed with a rational attitude | .698 | 2.45 | |
| ML4. I have positive relationships with neighbors and people around me | .732 | 3.33 | |
| ML5. I will sacrifice to get to the desired life goals | .769 | 3.03 | |
| ML6. Self-acceptance is the key to the future | .818 | 2.78 | |
| Feelings | .468 (.079) |
2.84 | |
| Fls1. I feel happy with the current state | .656 | 2.75 | |
| Fls2. Excessive anxiety will make my psychological worse | .620 | 3.46 | |
| Fls3. I'm not depressed | .417 | 2.31 | |
| Satisfactions | .600* (.033) |
3.31 | |
| Sfs1. The security conditions around me are conducive | .783 | 3.45 | |
| Sfs2. The existing environment makes me comfortable | .722 | 3.63 | |
| Sfs3. There is equality, empathy, and emotional openness in social relationships | .730 | 3.6 | |
| Sfs4. I have flexible free time | .915 | 3.06 | |
| Sfs5. I have time with my family, good communication when I get together, and family members who respect each other | .836 | 3.39 | |
| Sfs6. Educational infrastructure built at this time, improve skills | .708 | 3.45 | |
| Sfs7. I love the profession as a fisherman | .833 | 3.42 | |
| Sfs8. The current income situation is relatively stable | .655 | 3.34 | |
| Sfs9. I feel healthy spiritually, physically and mentally | .528 | 3.18 | |
| Sfs10. Recently, there has been a positive transformation in the state of well-being | .791 | 2.61 |
From the reliability testing of the KMO-MSA and Bartlett's versions, normally 2 choices are used. If the coefficient value is close to "1", then KMO-MSA indicates good data. In statistical interpretation, if it is close to "0", then the data in the factor analysis needs to be reconsidered. This anomaly is interpreted as a correlation between constructs that cannot be explained by other constructs. For Bartlett's test, significant ratios were applied with 2 degrees of probability (ρ <.01; ρ <.05). Based on the examination above, it was concluded that the questionnaire data on CSR (KMO-MSA = .771; ρ = .014), WLB (KMO-MSA = .653; ρ = .000), meaning of life (KMO-MSA = .869; ρ = .000), and satisfactions (KMO-MSA = .600; ρ = .033) are worth considering and "reliable". Among the models, only feelings (KMO-MSA = .468; ρ = .079) do not need to be reviewed and are "unreliable".
Table 6 also maps the mean score for each variable and its attributes. In the form of options, all alternative answers were developed into 5 ratings (very relevant = 5; relevant = 4; moderate = 3; inappropriate = 2; very inappropriate = 1). The mean of all variables is 3.01 "moderate". Even though the mean scores for the five variables varied, the intervals were not much different. The largest mean is satisfactions ( = 3.31) and the lowest is feelings (= 2.84). In particular, in the case of among variable attributes, the rating score is at intervals of “2-4” which means that the average scale is not appropriate, moderate, or relevant. For example, in CSR, where the highest attribute is CSR6 (= 3.72) and the lowest is CSR5 (= 2.63). In WLB, the largest attribute is WLB3 (= 3.3) and the smallest attribute is WLB2 (= 3.15). Other statistical outputs show that from the meaning of life, the most dominant attribute is ML1 (= 3.51) and the lowest is ML3 (= 2.45). On the other hand, for feelings and satisfactions, the highest average attribute values are Fls2 (= 3.46) and Sfs2 (= 3.63), while the lowest is Fls3 (= 2.31) and Sfs10 (= 2.61).
Hypothesis Testing
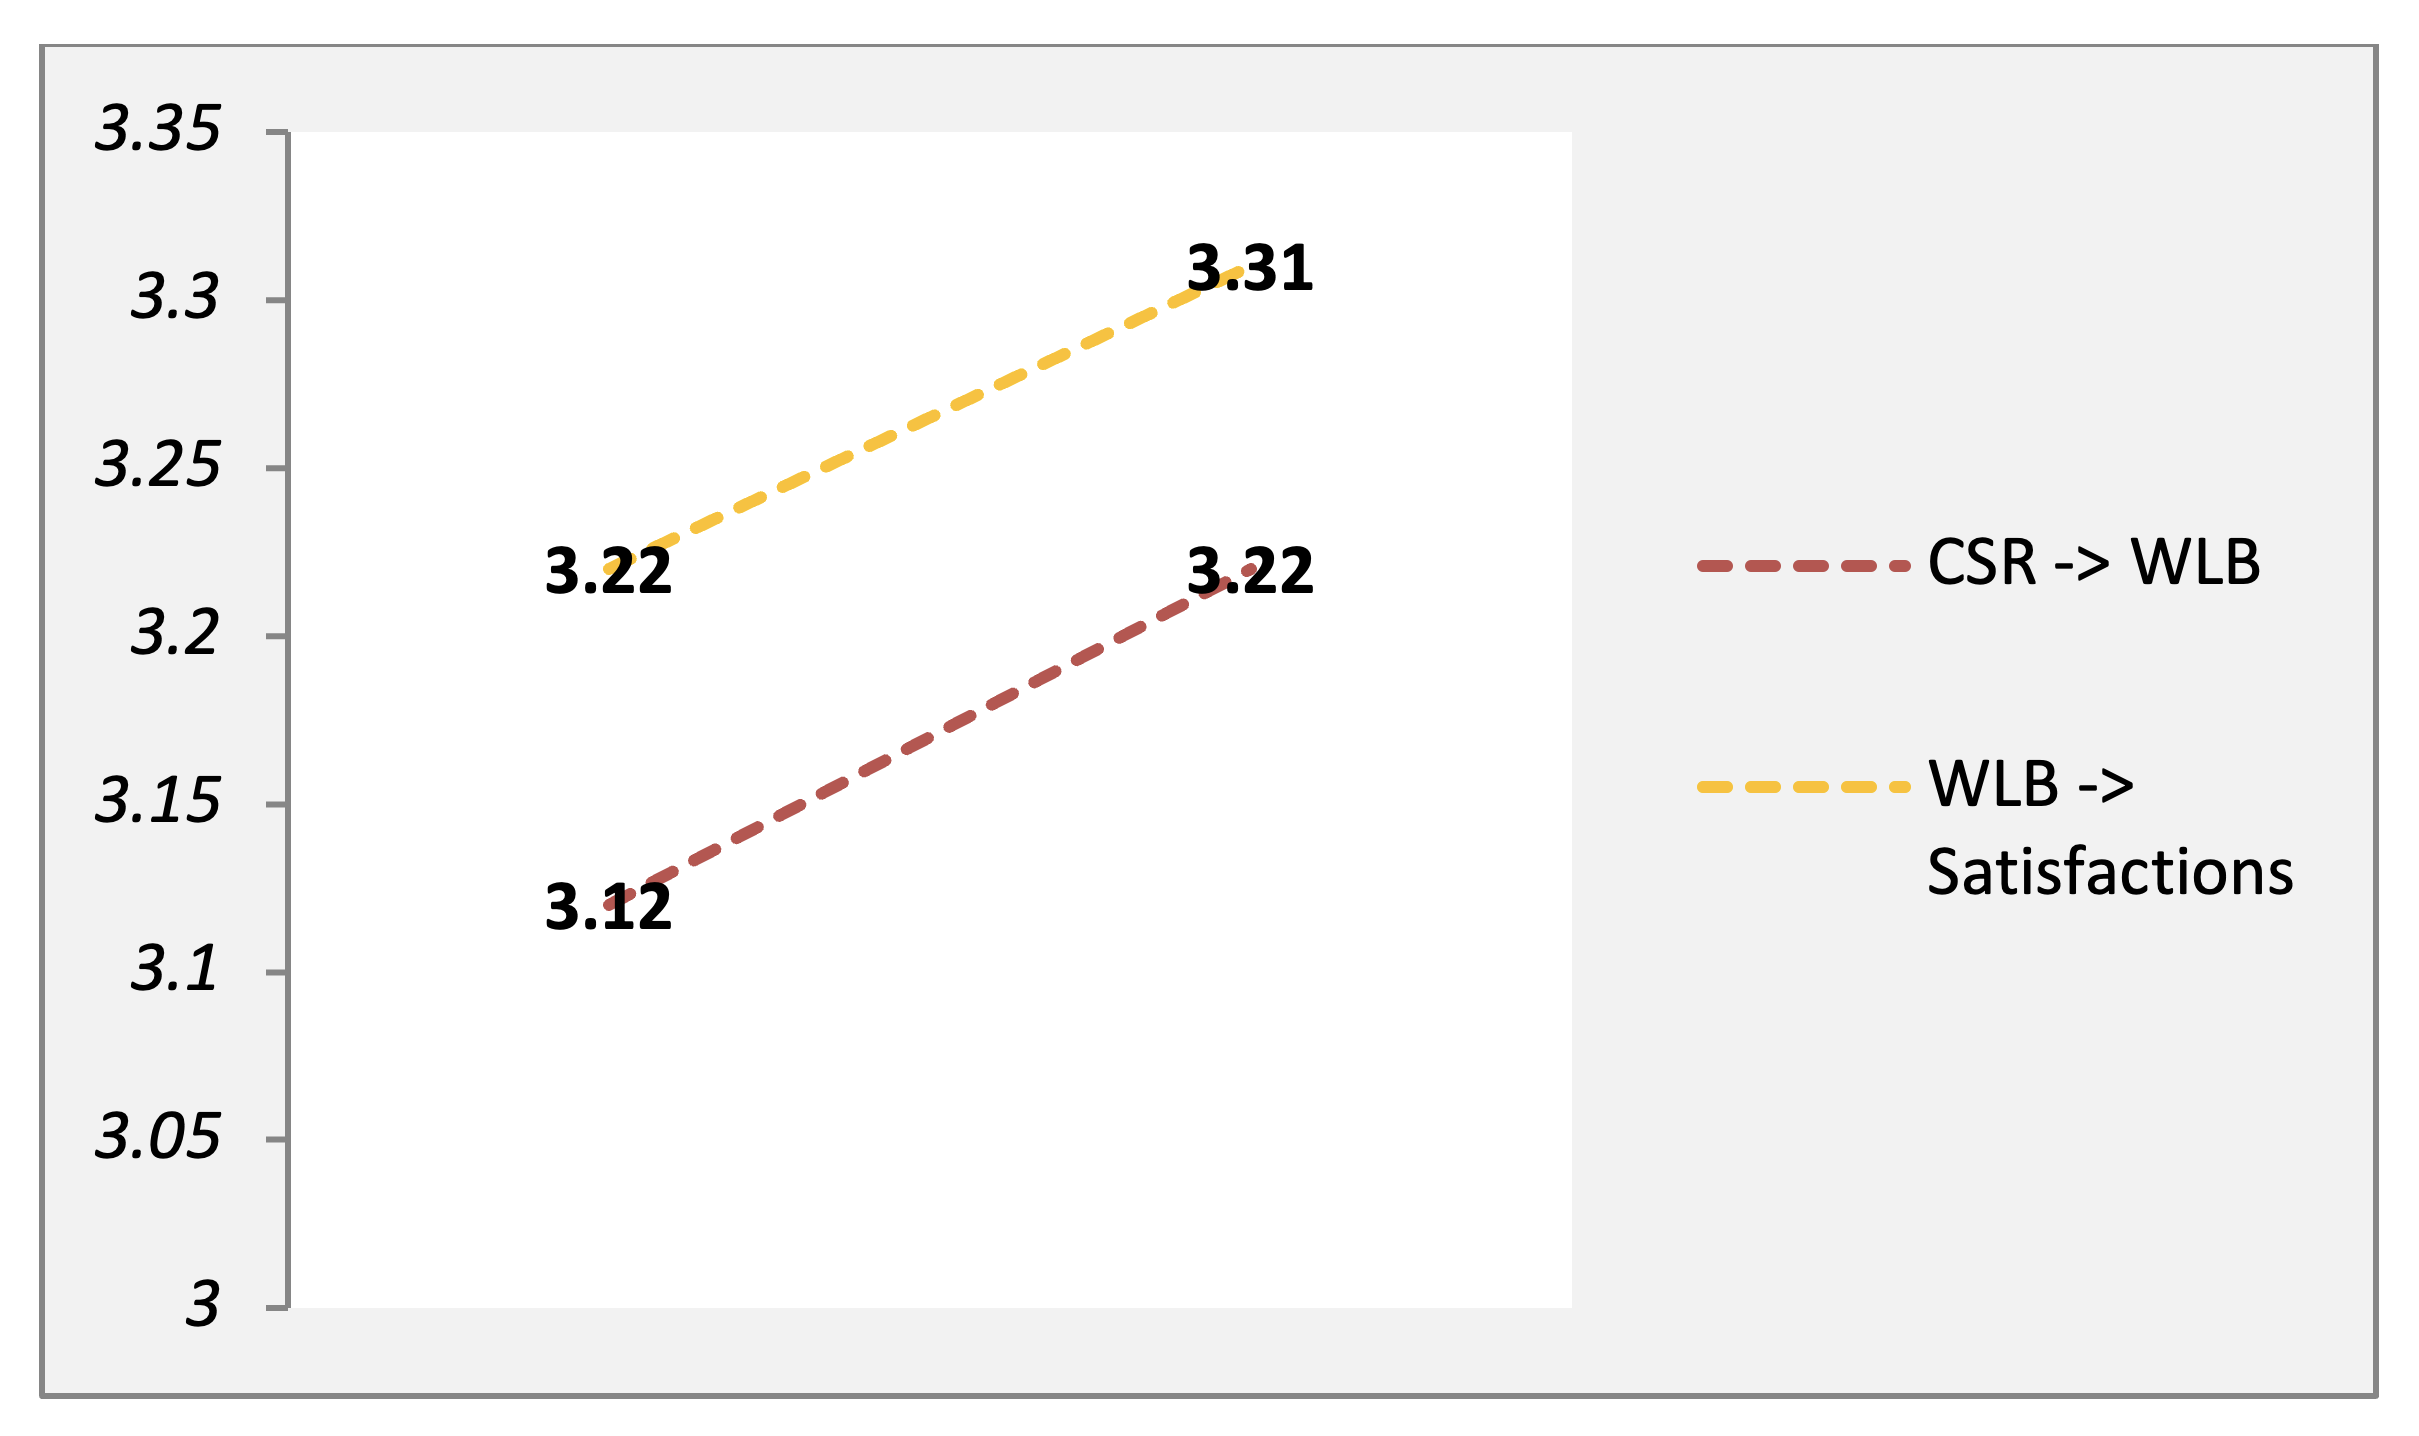
Table 7 clarifies the speculation hypotheses designed. Empirically, it was found that CSR (t-student = 7.894; ρ = .000) had a significant effect on WLB. When CSR flows to islanders, it increases WLB by 69.4%. In the first model, WLB is reflected by CSR reaching 74.3%. In the second model, an increase in WLB is able to encourage meaning of life, feelings, and satisfaction to reach 90.5%. Furthermore, WLB has a significant effect on meaning of life (t-student = 6.056; ρ = .000) and satisfactions (t-student = 2.562; ρ = .013), but not on feelings (t-student = -1.329; ρ = .188). In turn, when WLB is increased, it further encourages meaning of life (49.1%) and satisfactions (21.5%). Another phenomenon explains that an increase in WLB actually decreases feelings by 11.4%.
| Causality | T-Student | Coefficient | R2 | Sig. | Actions |
|---|---|---|---|---|---|
| CSR → WLB | 7.894 | .694 | .743 | .000** | Hypothesis accepted |
| WLB → Meaning of life | 6.056 | .491 | .905 | .000** | Hypothesis accepted |
| WLB → Feelings | -1.329 | -.114 | .188 | Hypothesis rejected | |
| WLB → Satisfactions | 2.562 | .215 | .013* | Hypothesis accepted | |
| CSR → WLB → Meaning of life | 5.438 | .341 | .816 | .009* | Hypothesis accepted |
| CSR → WLB → Feelings | -1.526 | -.079 | .132 | Hypothesis rejected | |
| CSR → WLB → Satisfactions | 6.032 | .149 | .000** | Hypothesis accepted |
In indirect causality, there is a significant two-way effect between CSR on meaning of life (t-student = 5.438; ρ = .009) and satisfactions (t-student = 6.032; ρ = .000) moderated by WLB. But, the WLB control had no effect on the relationship between CSR and feelings (t-student = -1.526; ρ = .132). In this context, WLB inspires the relationship between CSR on the meaning of life (34.1%) and satisfactions (14.9%). From this manuscript, another reality is that CSR, which includes WLB, actually reduces feelings by up to 7.9%. In the third model, it was concluded that the WLB approach to bridging causality between CSR and the three endogenous variables proved successful with a determination of 81.6%.
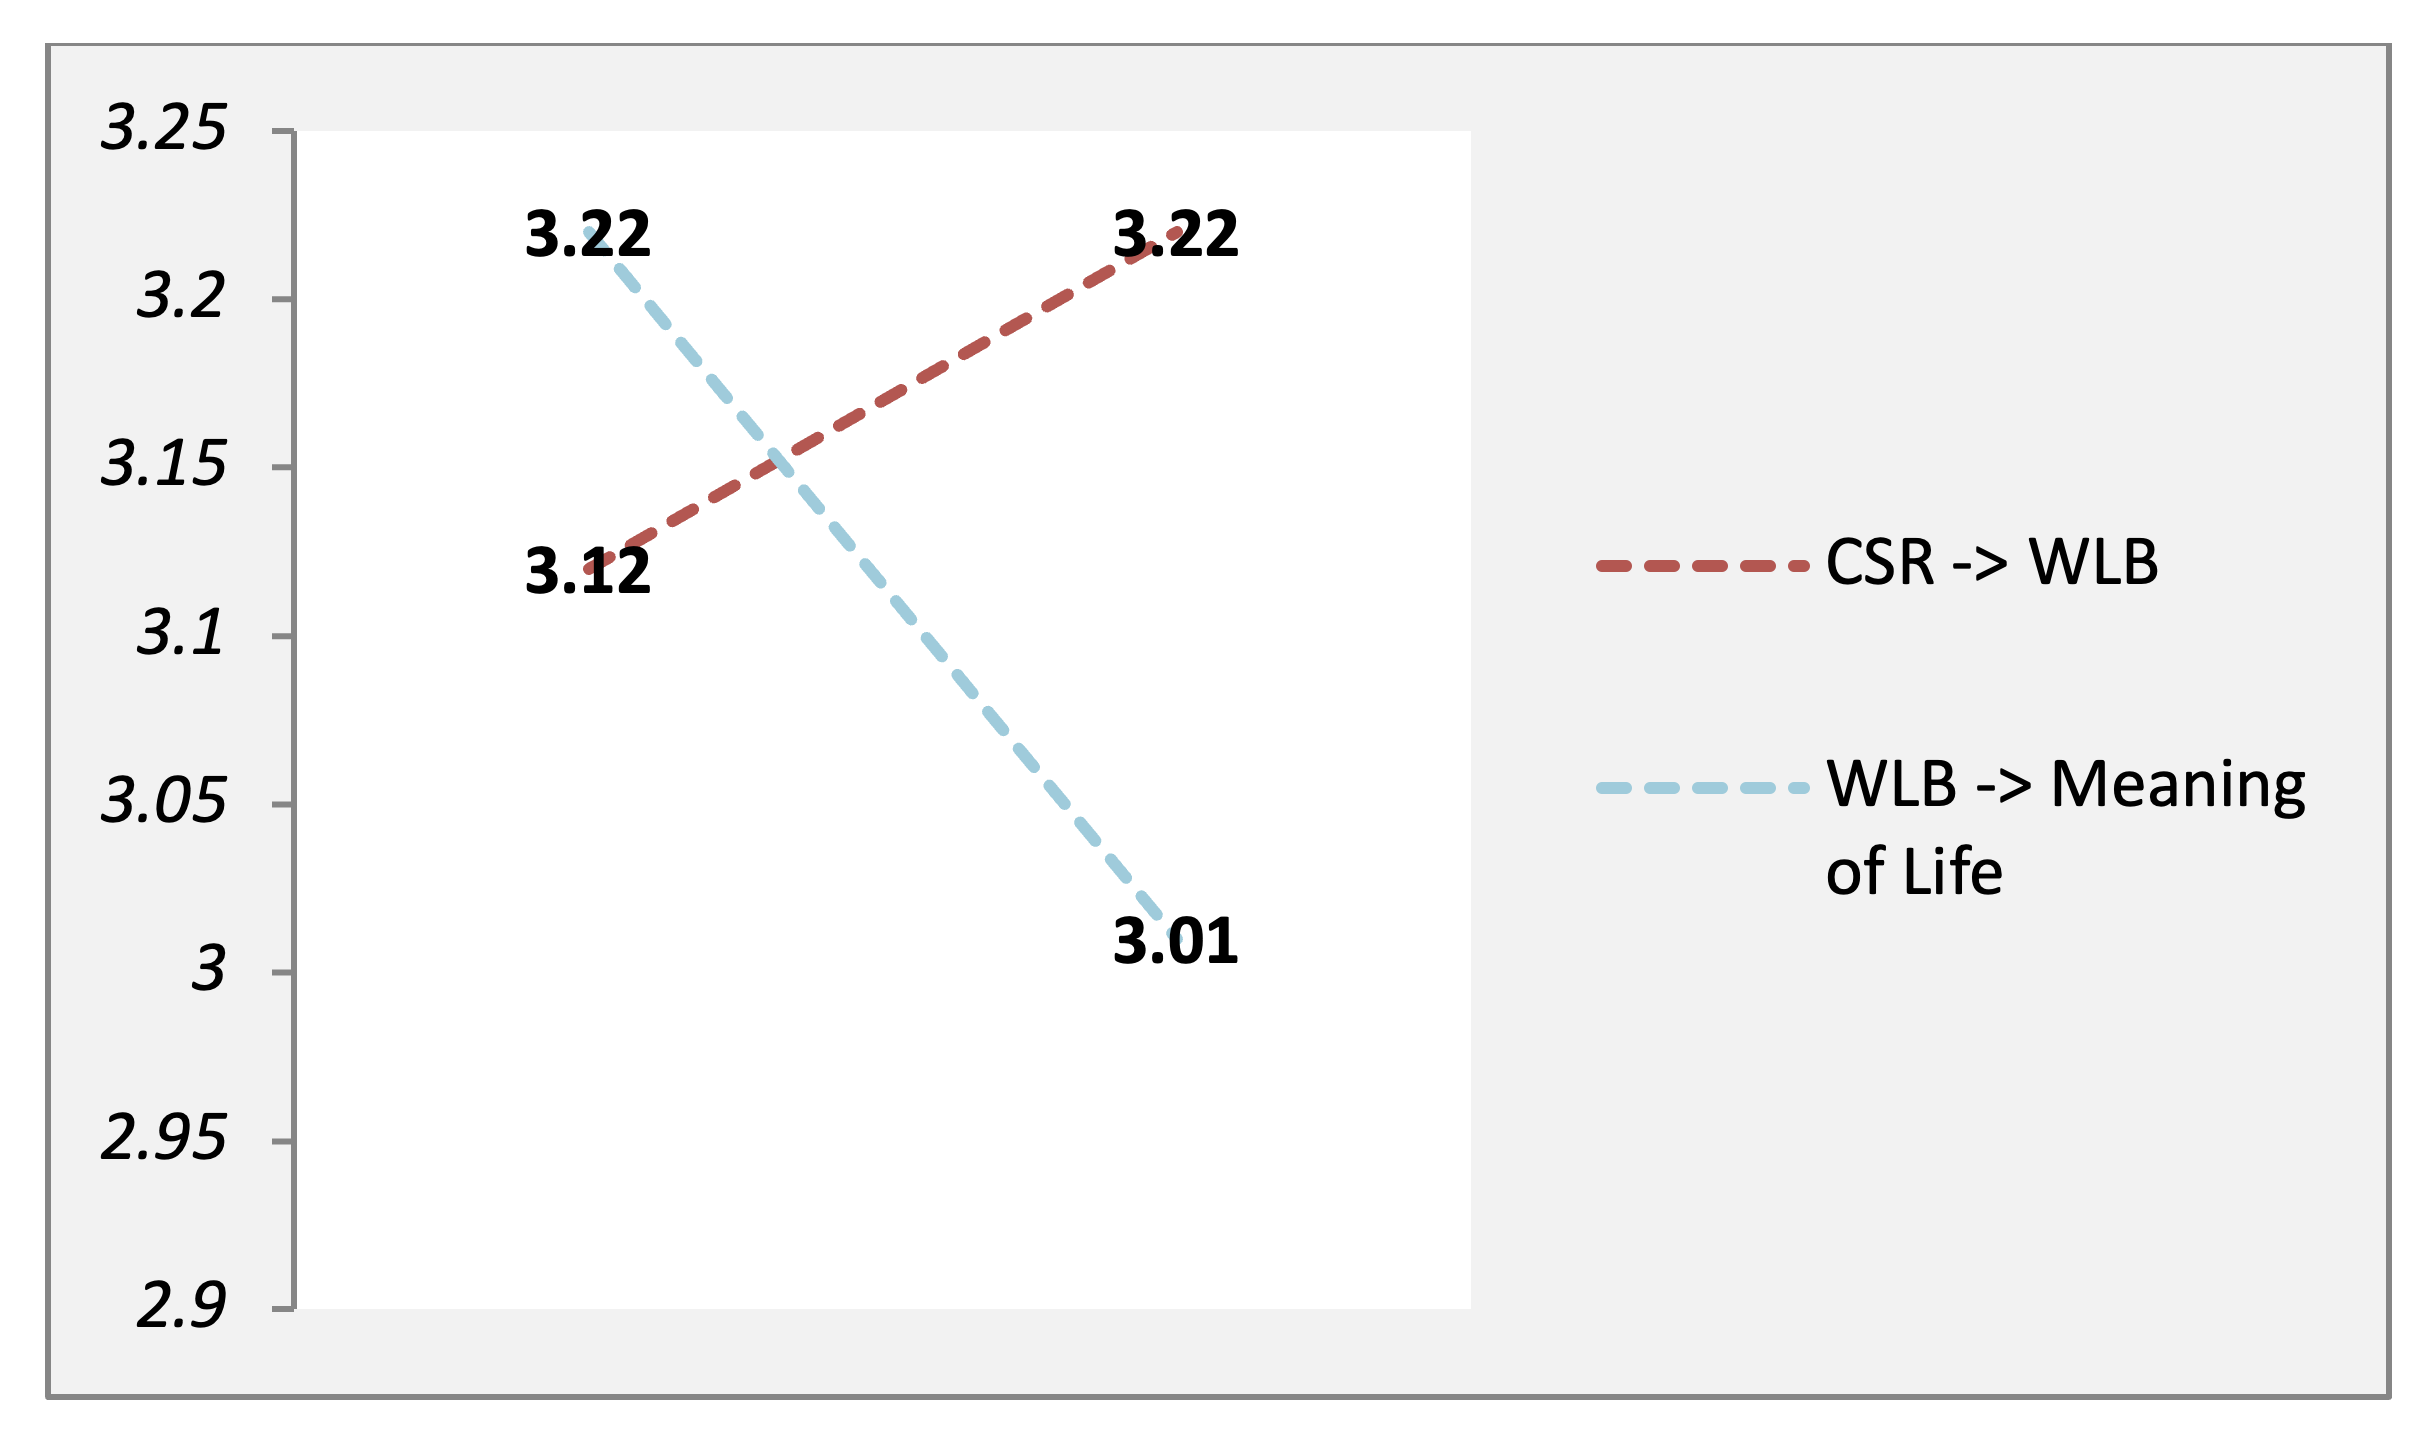
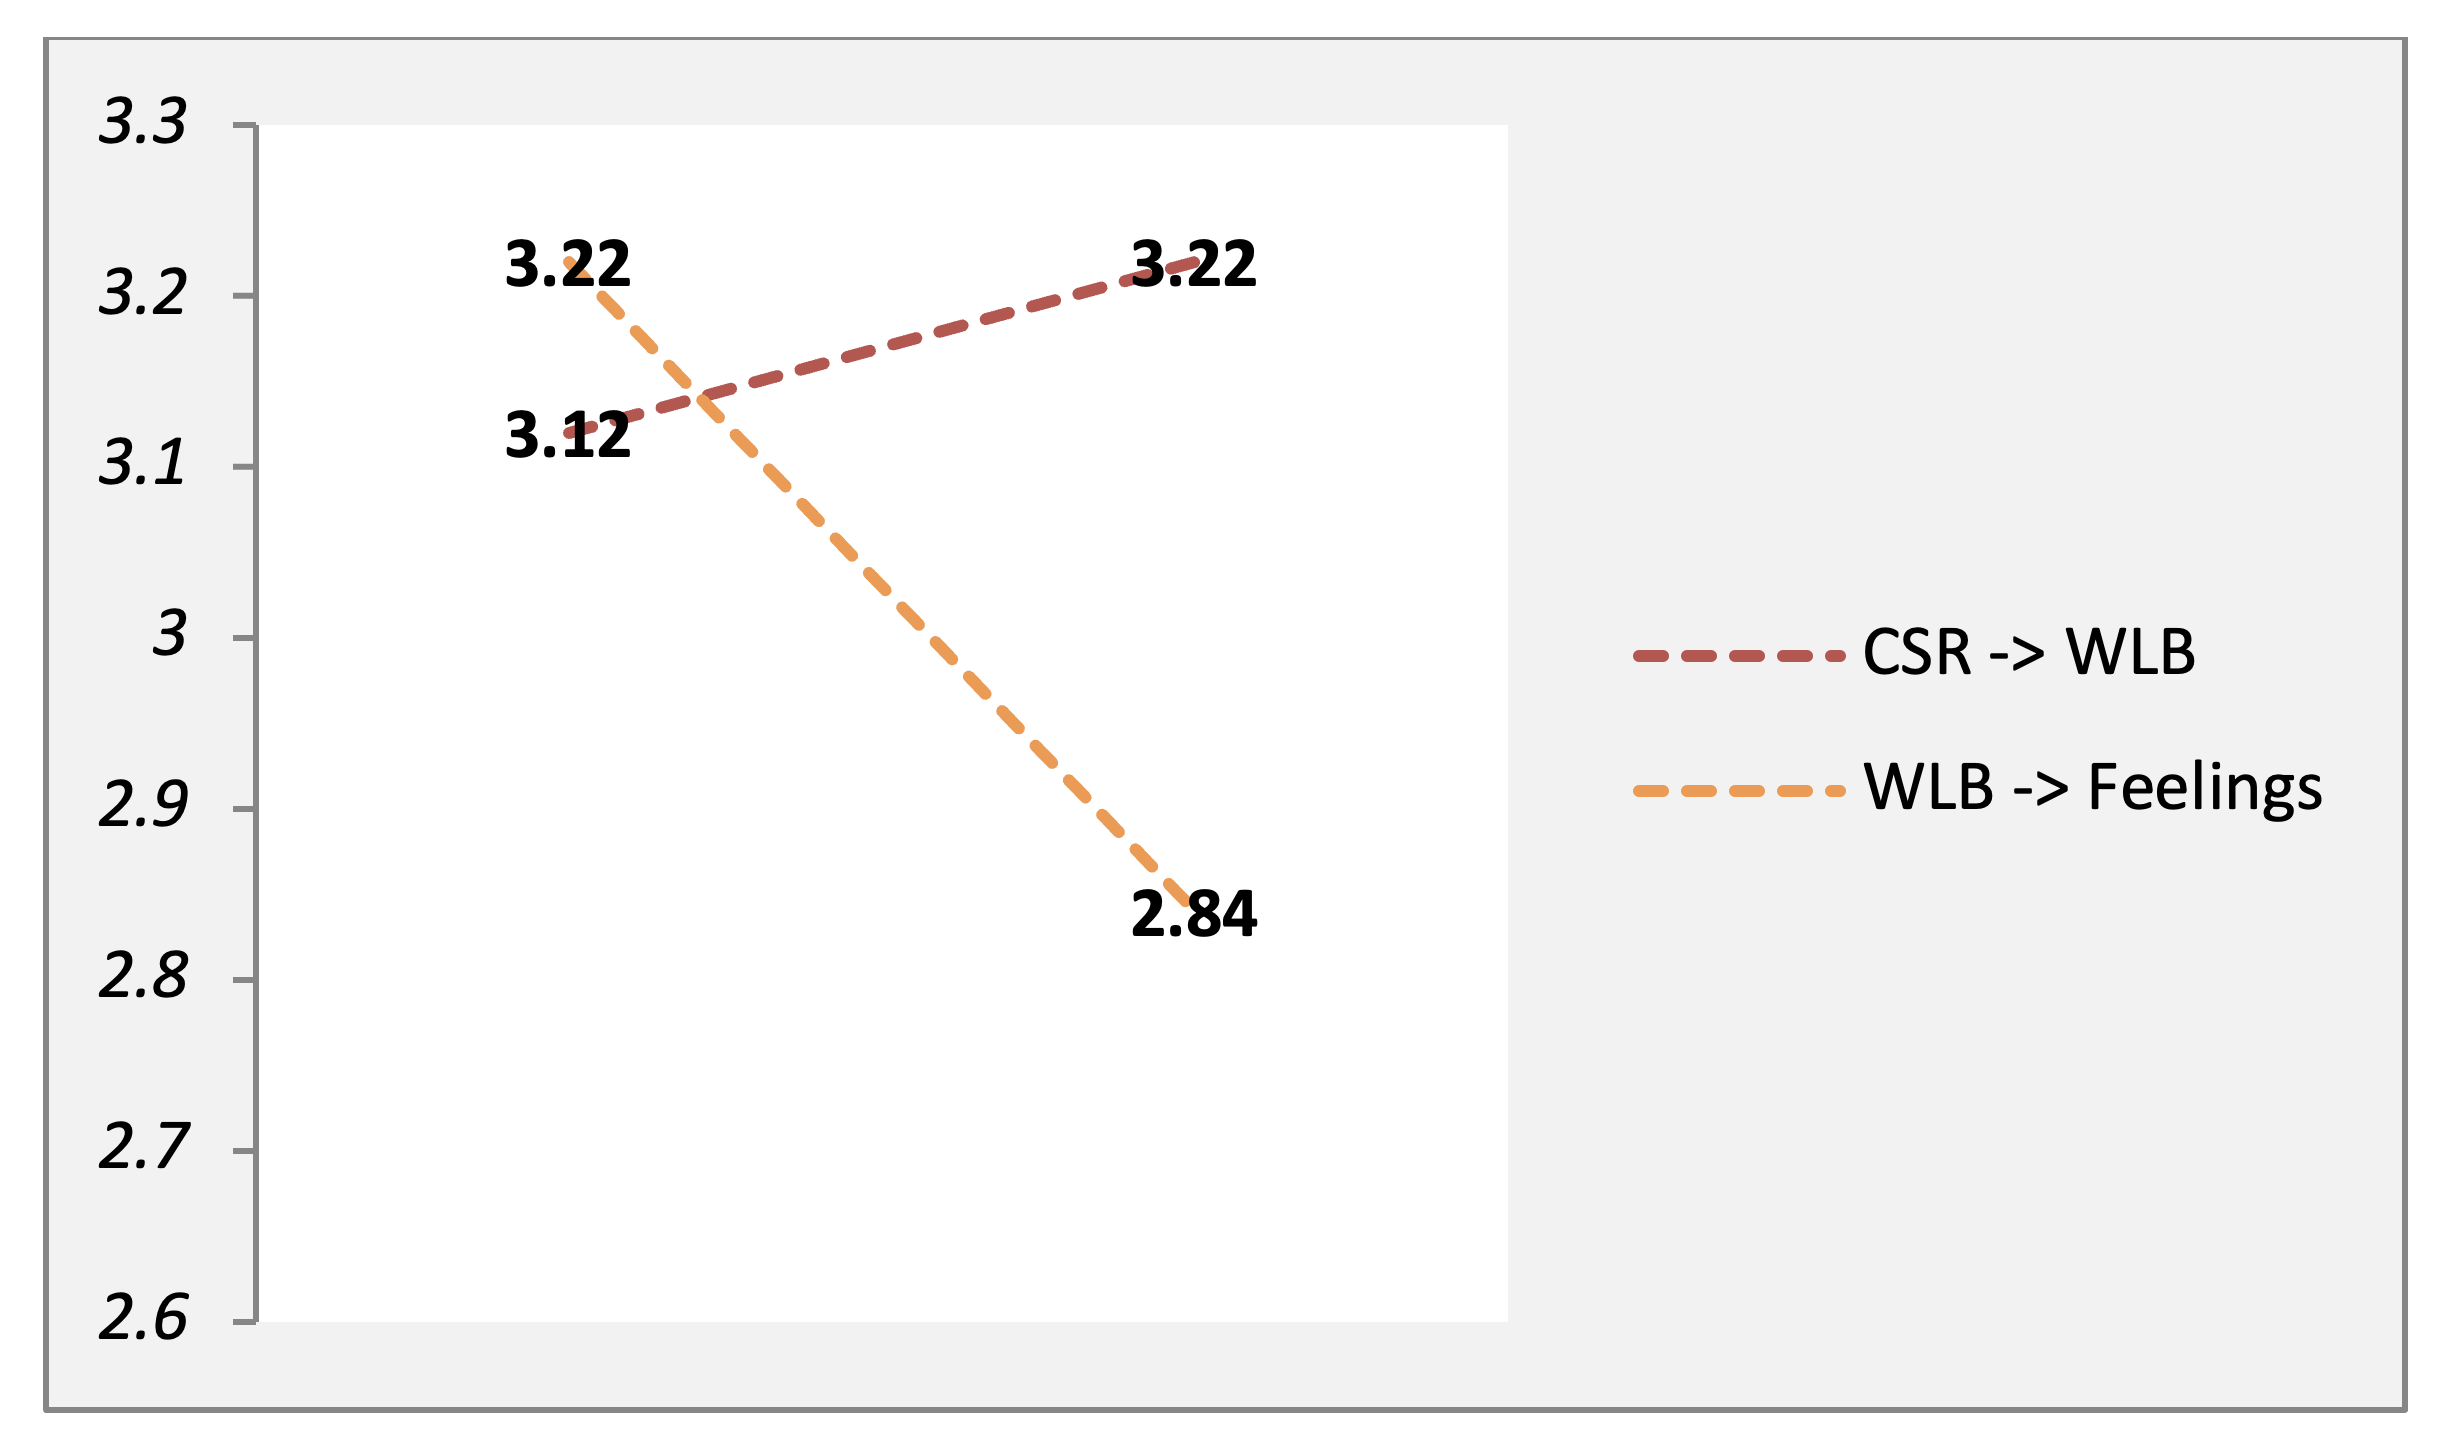
Additionally, the three Figures above show the moderation path in causality between CSR on the meaning of life, feelings, and satisfactions through the role of WLB. In detail, the moderation calculation lies in the combination of the direct relationship (predictor variable and control variable), then compared with the indirect relationship (control variable to endogenous variable). To produce a crossover between the two causalities, the average mean score is used. Referring to the moderation graph above, there is agreement between Figure 4 and Figure 5 which assumes that there is a linear moderating effect between CSR on the meaning of life and feelings via WLB. The line axes that cross from CSR to WLB with the WLB line axes to meaning of life and feelings show that the normality of the data is proven positive. What is amazing is in Figure 6, where it appears that there is a perfect moderating effect that is displayed from a straight line axis for the relationship of CSR to WLB and WLB to satisfactions.
Discussion
In Indonesia, diving into Law Number: 40 of 2007 which focuses on CSR to tighten TJSL is the company's business to protect environmental quality and solve life problems in the production area for the company itself, the local community, and the wider community. The bureaucracy contained in Article 2 stipulates that every PT as a legal subject has social and environmental obligations. In its progress, compliance with applying TJSL is aimed at PTs that carry out business transactions related to natural resources according to the applicable field basis (Wijaya et al., 2019). In line with that, PTs that are connected to the exploitation of natural resources are companies that manage and utilize nature and are also subject to TJSL. In terms of terminology, companies that only focus on business activities related to nature, but do not manage, do not utilize natural resources, and reduce the function of natural resources, but reduce environmental preservation, are also subject to TJSL (Fadillah et al., 2022). Therefore, even if a PT is not integrated in the natural resources sector, but results in environmental damage or is on the threshold of natural capabilities, then the PT is obliged to implement TJSL.
There are different treatments about the obligations of PTs whose business transactions are connected with the utilization of natural resources. Based on the Ruling of the Constitutional Court Number: 53/PUU-VI/2008, where PT manages natural resources and is related to the 1945 Constitution in Article 33 (Paragraph 3), the state has the right to regulate more implicitly. The obligation to implement TJSL is also assigned to other business entities such as Cooperatives, Commanditaire Vennootschap (CV), Firms, and Trading Companies referring to the regulations in Law Number: 25 of 2007 (Article 15) concerning "Investment".
Companies that carry out mining on the border of Sebatik Island are more oriented towards Elod sand and Silica sand types. Apart from exploring this type of sand, several companies with the same branch are also excavating white sand (Lanauan) from Nipah Island which is located on the border of Indonesia and Singapore. These two islands are the outer regions of Indonesia. The sand dredged and exported from these two islands has led to a reclamation project in Singapore. From 1970-2000, sand mining in Indonesia continued to be explored for commercial purposes (Nurzal, 2004). Due to this practice, Indonesia has had a bad fate, where damage to the habitat of organisms, the environment and marine ecosystems has been drastically damaged. The uncontrolled trade in sea sand triggers disturbances to the coastal zone, including fish cultivators and fishermen. In addition, the bustling tourist visits in East Sebatik are inseparable from the attractiveness of coastal destinations, the friendliness of the local population, and other natural panoramas. The diversity of tourism that is popular in the eyes of tourists is coastal parks, beaches, mangrove forests, hotels and inns, and other accommodations such as culinary. The growing enthusiasm and the number of visits proved to be not matched by awareness, hygiene and comprehensive management. Polemics such as the accumulation of garbage in the destination area which has an impact on the surrounding environment, triggering pollution of the marine ecosystem, contaminated air, and health of the islanders.
Referring to monitoring results, the CSR program on East Sebatik Island has been in the same direction as supporting WLB and WLB has a role in stimulating meaning of life and satisfactions. What creates a dilemma is that WLB does not encourage fishermen's feelings even though it is also moderated by CSR. Only meaning of life and satisfactions can be increased with WLB through CSR grants. It is increasingly clear that the position of CSR and WLB does not play a vital role in increasing fishermen's happiness. With happiness from the side of feelings that are tenuous, it further destroys the intimacy and tolerance of fellow individuals.
Investigations by Álvarez-Pérez et al. (2020), Barakat et al. (2016), González-De-la-Rosa et al. (2023), Mei Peng (2020), Sanusi & Johl (2020) and Thardsatien (2016) found that to build a multi-level perception, ethical CSR is needed. In a quality of life lens, CSR involvement must ensure that nothing is left behind. Ethical corporate commitment and by the larger organizational goals, will produce a better image. Outcomes from philanthropic CSR to maintain quality of work life. With a Family-Friendly Psychological Climate (FFPC) landscape, CSR which is mediated by altruism and managerial can channel satisfaction. CSR, which is promoted through non-business environmental features, represents more heterogeneous group involvement. In the internal domain of the company, the compatibility between organizational culture and responsible practices accelerates resilience and sustainable prosperity.
Hassan et al. (2013), Lee & Choi (2018), Subba (2015) and Yuliati et al. (2017) justify that legal CSR has an impact on satisfaction. To maintain business, CSR is applied to social and non-social activities that are continuous and affect positive emotions. From time to time, in order to foster a strategic business climate, companies may share resources and be affiliated with CSR. Ideally, companies should evaluate and confirm each beneficiary of CSR, especially the lower middle class who are exposed to company activities.
Conclusions
The dedication of this study discusses the role of CSR which is controlled by WLB on the happiness of the fishermen contained in the meaning of life, feelings, and satisfactions. By exploring East Sebatik Island which is affected by the existence of sand mining and coastal tourism, the results conclude: (1) CSR significantly affects WLB; (2) CSR influences the meaning of life and satisfactions significantly; (3) CSR does not affect feelings; (4) CSR has a significant impact on meaning of life and satisfactions moderated by WLB; (5) CSR has no impact on feelings moderated by WLB. Sand mining projects and coastal tourism actually bring reactions that are opposite to the feelings of the fishermen. Naturally, CSR grants that are transferred to islanders as a form of appreciation have a negative emotional relationship to the individual. In a fluctuating cycle, the grants provided by the company has reduced enthusiasm for life, hampered psychological recovery, and isolated motivation.
At the global level, authentic CSR with sustainability. The CSR program does not only contain financial assistance, but also develops affected human resources while consistently restoring environmental functions. In the same phase, the population is faced with increasingly difficult prosperity in life. For those who live in areas affiliated with natural resources, of course there are challenges. Universally, positive happiness will determine everyone's future. Learning from the experience of this research, the company's activities in East Sebatik do not yet feel real, but it indicates that fishermen have feelings that tend to be depressed. The majority of respondents are of the opinion that there is a non-subjective CSR treatment, which is contemporary in nature. Even though the CSR program via the distribution of grants is legal, it can trigger havoc. Going forward, the recommendation that can be given to technocratic parties is the need to re-negotiate, including investment licensing. In essence, CSR must be organized as well as possible with a multidisciplinary scientific basis and pretext. Any practical policy will be useful for fishers if there is a fair incubation process without any parties denying it.
Finally, for implications for further research, the study results suggest consideration of the sample cluster. Samples that only focus on one group can trigger unscientific perceptions. Objective arguments are needed to examine the extent of the correlation between the constructs or indicators tested. In this way, problem solving can be organized according to the informant's originality and capability in answering the questionnaire.
References
- Abdelkarim, A., Mokhtari, B. 2019., The indicators of the corporate social responsibility: A search for efficiency or a concern for legitimacy towards stakeholders? A proposed explanatory model. International Journal of Service Science Management Engineering and Technology. 10(1): 62–76.
- Ahtesham, S., 2020. Analysing happiness index as a measure along with its parameters and strategies for improving India’s rank in world happiness report. ICTACT Journal on Management Studies. 6(1): 1170–1173.
- Alsaadi, L.A.S., Miniaoui, S. 2018., Identifying happiness index parameters in the United Arab Emirates to develop better user feedback tools. International Journal of Happiness and Development. 4(2): 123–136.
- Álvarez-Pérez, M.D., Carballo-Penela, A., Rivera-Torres, P., 2020. Work-life balance and corporate social responsibility: The evaluation of gender differences on the relationship between family-friendly psychological climate and altruistic behaviors at work. Corporate Social Responsibility and Environmental Management. 27(6): 2777–2792.
- Barakat, S.R., Isabella, G., Boaventura, J.M.G., Mazzon, J.A., 2016. The influence of corporate social responsibility on employee satisfaction. Management Decision. 54(9): 2325–2339.
- BPS-Statistics of Indonesia., 2021. Indeks kebahagiaan 2021 [in Bahasa Indonesia]. Loaded from https://www.bps.go.id/publication/2021/12/27/ba1b0f03770569b5ac3ef58e/indeks-kebahagiaan-2021.html [March 14, 2022].
- BPS-Statistics of Nunukan Regency., 2022. Kecamatan Sebatik dalam angka 2022 [in Bahasa Indonesia]. Kreasi Cahaya Abadi, Tarakan.
- Brata, N.T., Wicaksono, H., Pramono, D., 2020. Exploiting of natural resources as livelihoods of the border citizens in the Sebatik Island, North Kalimantan. Komunitas: International Journal of Indonesian Society and Culture.12(2): 308–312.
- Briandana, R., 2019. Television and national identity: An ethnography of television audience in the border of Indonesia-Malaysia. Jurnal Ilmu Sosial dan Ilmu Politik. 23(1): 72–85.
- Kapoor, A., Debroy, B., 2019. GDP is not a measure of human well-being. Economics. Loaded from https://hbr.org/2019/10/gdp-is-not-a-measure-of-human-well-being [December 25, 2022].
- Chwiłkowska-Kubala, A., Cyfert, S., Malewska, K., Mierzejewska, K., Szumowski, W., 2021. The relationships among social, environmental, economic CSR practices and digitalization in Polish energy companies. Energies. 14(22): 7666.
- Elnanto, J.G., Suharti, L., 2021. The impact of work from home to work life-balance and its implication to employee happiness. International Journal of Social Science and Business. 5(3): 311–318.
- Elyta, E., Mujiono, D.I.K., Sagena, U.W., 2022. Facing the dangers in Indonesia’s waters: Government’s efforts in proposing illegal, unreported and unregulated fishing as transnational organized crime. Intermestic: Journal of International Studies. 6(2): 335–352.
- Fadillah, H., Widyowati, M.P., Herdiyana, H., Irwansyah, I., Darma, D.C., 2022. Have companies in Indonesia disclose environmental accounting?. Acta Tecnología 8(2): 46–57.
- Gallego-Álvarez, I., 2006. The use of economic, social and environmental indicators as a measure of sustainable development in Spain. Corporate Social Responsibility and Environmental Management. 13(2): 78–97.
- Giannarakis, G., Litinas, N., Theotokas, I., 2009. Characteristics of corporate social responsibility indicators. World Academy of Science, Engineering and Technology. 3(6): 1021–1030.
- Gragnano, A., Simbula, S., Miglioretti, M., 2020. Work-life balance: Weighing the importance of work-family and work-health balance. International Journal of Environmental Research and Public Health. 17(3): 907.
- González-De-la-Rosa, M., Armas-Cruz, Y., Dorta-Afonso, D., García-Rodríguez, F.J., 2023. The impact of employee-oriented CSR on quality of life: Evidence from the hospitality industry. Tourism Management. 97: 104740.
- Government of Nunukan Regency., 2023. Sebatik. Loaded from https://karyanunukan.wordpress.com/sebatik/ [March 7, 2023].
- Hadi, N.U., Ananda, C.F., Pudjiharjo, P., Khusaini, M., 2018. The happiness index as a new and complementary measurement of development as applied to each Province of Indonesia. International Journal of Economics and Financial Issues. 8(4): 214–221.
- Hassan, Z.,Nareeman, A., Pauline, N., 2013. Impact of CSR practices on customer satisfaction and retention: An empirical study on foreign MNCs in Malaysia. nternational Journal of Accounting, and Business Management. 1(1): 63–81.
- Hidayat, Y., Purwandari, T., Sukono, S., Subiyanto, S., 2019. Measuring of the population happiness index of Bandung City. Journal of Physics: Conference Series, Vol. 1179, pp. 012158. The 1st International Conference on Computer, Science, Engineering and Technology, Tasikmalaya, Indonesia, November 27–28, 2018.
- Husain, S.B., Puryanti, L., Setijowati, A., 2021. History, education, and border area: An introduction study on education at the Indonesia-Malaysia border, Sebatik Island, North Kalimantan. Kasetsart Journal of Social Sciences. 42(4), 947–952.
- Idowu, S.O., Kasum, A.S., 2014. People, planet and profit: Socio-economic perspectives of CSR, 1st edition. Taylor & Francis, Florida.
- Isa, K., Jaes, L., Damin, Z.A., Latiff, A.A., Rahman, A.H.A., Maslan, N., A’ain, A.K., Tenah, S.S., 2019. Determining indicators of happiness index among university staff. International Journal of Engineering and Advanced Technology. 8(5C): 726–730.
- Kapoor, A., Debroy, B., 2019. GDP is not a measure of human well-being. Economics. Loaded from https://hbr.org/2019/10/gdp-is-not-a-measure-of-human-well-being [December 25, 2022].
- Lee, W., Choi, S., 2018. Effects of corporate life cycle on corporate social responsibility: Evidence from Korea. Sustainability. 10(10): 3794.
- Lestari, D., Tricahyadinata, I., Rahmawati, R., Darma, D.C., Maria, S., Heksarini, A.N., 2021. The concept of work-life balance and practical application for customer services of banks. Jurnal Minds: Manajemen Ide dan Inspirasi. 8(1): 155–174.
- Mei Peng, L., 2020. The divergent influence of social responsibility on employee engagement through the lens of marital status: Evidence from Higher Education Institutions. Review of Business Management 22(2): 205–231.
- Musikanski, L., Cloutier, S., Bejarano, E., Briggs, D., Colbert, J., Strasser, G., Russell, S. 2017., Happiness index methodology. Journal of Social Change. 9(1): 4–31.
- Nurzal, E.R., 2004. Upaya penanganan pasir laut dari sisi kebijakan [in Bahasa Indonesia]. Jurnal Teknologi Lingkungan BPPT. 5(3): 212–220.
- Osberg, L., Sharpe, A., 2002. International comparisons of trends in economic well-being. Social Indicators Research. 58(1/3): 349–382.
- Ötken, A.B., Erben, G.S., 2013. The relationship between work-life balance and happiness from the perspectives of generation X and Y. Humanities and Social Sciences Review. 2(4): 45–53.
- Purnamasari, W.D., Setyono, D.A., Dayana, I., 2016. Figuring the happiness of poor communities in Malang City: Measuring the outcome of slum and squatter areas. Procedia - Social and Behavioral Sciences. 227: 521–529.
- Raharjo, S.N.I., Anuar, A.A., 2022. Transnationalism of Sebatik Island Malaysia-Indonesia: A regional economic integration perspective. Proceedings of the First Australian International Conference on Industrial Engineering and Operations Management, Sydney, Australia, December 20–22, 2022.
- Rahayu, S., 2020. Work becomes obligation for the family: Analysis of work-family balance on fishermen's wife. International Journal of Social Science and Business. 4(4): 482–488.
- Rahman, M.F., 2019. Work-life balance as an indicator of job satisfaction among the female bankers in Bangladesh. European Journal of Business and Management. 11(6): 15–25.
- Rao, T.S., Indla, V., 2010. Work, family or personal life: Why not all three?. Indian Journal of Psychiatry. 52(4): 295–297.
- Rathschlag, M., Memmert, D., 2013. The influence of self-generated emotions on physical performance: An Investigation of happiness, anger, anxiety, and sadness. Journal of Sport and Exercise Psychology. 35(2): 197–210.
- Sahlan, U.S., 2020. Measuring the indicators of happiness index in Malang City. Journal of International Conference Proceedings. 3(1): 273–282.
- Salim, G., Handayani, K.R., Indarjo, A., Ransangan, J., Atieqah, N., 2020. Growth, mortality and exploitation rate of Pampus argenteus, Parastromateus niger and Scomberomorus commersonin Sebatik Waters, Indonesia. Biodiversitas. 21(11): 5363–5372.
- Sánchez-Hernández, M.I., González-López, Ó.R., Buenadicha-Mateos, M., Tato-Jiménez, J.L., 2019. Work-life balance in great companies and pending issues for engaging new generations at work. International Journal of Environmental Research and Public Health. 16(24): 5122.
- Sanusi, F.A., Johl, S.K., 2022. Sustainable internal corporate social responsibility and solving the puzzles of performance sustainability among medium size manufacturing companies: An empirical approach. Heliyon. 8(8): e10038.
- Sari, M., Sujarwoto, S., 2019. Ship sinking policy and socio-economic welfare: A case study in Sebatik Island, Nunukan District, North Kalimantan Province. Jurnal Borneo Administrator. 15(3): 275–292.
- Soneye, O.Y., Ogundipe, H.D., Ayowole, D., Umar, S.S., Osasona, E.O., Adebayo, O., Enebeli, U.U., Ishaya, D.G., Isma’il, S.A., Kabir M.S., 2023. Systematic review of work-life balance among early career doctors. Ibom Medical Journal. 16(1): 1–13.
- Subba, D., 2015. The impact of CSR on positive emotion. Multiple regression analysis. Purushartha. 8(2): 1–11.
- Tamminen, K., Dunn, R.C., 2022. How do emotions affect sport performance?. Frontiers for Young Minds. 10: 691706.
- Thardsatien, K., 2016. The impacts of corporate social responsibility and quality of work life on job-related outcomes in Thailand. NIDA Development Journal. 56(4): 58–95.
- Tofallis, C., 2020. Which formula for national happiness?. Socio-Economic Planning Sciences. 70: 100688.
- Wijaya, A., Nurfadillah, M., Darma, D.C., 2019. Pattern of corporate social responsibility (CSR) in Mahakam Ulu Regency, East Kalimantan. European Journal of Business and Management. 11(31): 60–66.
- Wijonarko, G., Astut, S.J.W., 2022. Implementation of corporate social responsibility based on the triple bottom line concept in the era of Covid 19 pandemic. Jurnal Penelitian Pendidikan Indonesia. 8(2): 405–414.
- Yuliati, E., Balqiah, T.E., Sobari, N., Astuti, R.D., 2017. The impact of health corporate social responsibility (CSR) activities on brand attitude and customers’ loyalty in two bıg Cities of Indonesia. Asia-Pacific Management and Business Application. 5(3): 173–198.
- ZA, S.Z., Amalia, S., Darma, D.C., Azis, M., 2021. Spurring economic growth in terms of happiness, human development, competitiveness and global innovation: The ASEAN case. ASEAN Journal on Science and Technology for Development. 38(1): 1–6.
- Živčicová, E., Bulková, K., Masárová, T., 2017. Comparison of the selected indicators of work life balance in European Union Countries. Economics and Sociology. 10(1): 222–231.