The Food Accessibility of Fishermen's Households in Small and Outermost Islands with Social Network Analysis
Abstract
This study analyzes how social networks can connect and interact to strengthen food accessibility for poor households on Mapur Island, one of the small and outermost islands in Indonesia. Data collection used interviews with eighteen recipient households of the Family Hope Program (PKH) and Focus Group Discussions with eighteen key informants. Data were analyzed using R analysis and social network analysis. This study found that the level of access to food for PKH households and their social networks was very low and short. His dependence on rice assistance from the government and being in debt to ‘Patron’ became very strong. Of all identified communities, the same pattern was found, and a strong mutual relationship was with ‘Patron.’ The role of ‘Patron’ in the food access network is an intermediary and central role that connects many entities and activities to meet community needs. The interaction between the Regional Logistics Agency stopped at the liaison between the ‘Patron’ and the village government that distributed the assistance. The village food access network is very dependent on the network owned by ‘Patron.’ Government intervention through policies and strengthening food institutions can play a key role in helping to facilitate access to food needs on the island.
Keywords
Food accessibility, fisherman's household, a small outermost island, Social Network Analysis (SNA)
Introduction
Food security is crucial for coastal communities living on remote islands in Indonesia, which has 85.34% of coastal villages. In 2021, Indonesia’s food security weakened, as indicated by a decrease in the Food Security Index (GFSI) from 61.4 in 2020 to 59.2. The province of Riau Islands, including Bintan District, ranked among the lowest with a score of 63.26, ranked 30th out of 34 provinces in Indonesia, with the lowest food security index is 58.82 (Food Security Agency, 2021). Bintan District is one of Indonesia’s 3T regions (frontier, remote, and underdeveloped) and a border area. In recent years, maritime villages in this area have experienced economic contraction due to the COVID-19 pandemic and global climate change, which have led to poverty (Suryahadi et al., 2020), food insecurity (Cahyadinata et al., 2019), malnutrition, and stunting problems (CARE, 2021; Singh et al., 2021; SMERU Research Institute, 2021). In 2022, Bintan District was given priority for addressing stunting, with 36.1% of toddlers experiencing stunting (medium), 12% experiencing wasting (high), and 16.2% experiencing underweight (medium) (Indonesian Health Ministry, 2020). One of the communities that are vulnerable to food insecurity in Bintan is the households of fishermen (Agustina et al, 2020; Cahyadinata et al., 2019; Devanda et al, 2020)
The low food security of coastal communities and small islands in Indonesia is closely related to the problem of food accessibility. The problem of food accessibility is also the primary and fundamental problem of food security (Gordillo & Jeronimo, 2013; Syahyuti et al., 2015). Even though the availability of food supply is sufficient, they can still overcome food insecurity (Ahdiat, 2022). Food availability at the national and regional levels does not guarantee individual or household food security, especially in coastal and small island areas. The proof is that the prevalence of stunting is still high (36.51%) among children under five years old in Bintan (Indonesian Health Ministry, 2020) and the high number of households receiving the Family Welfare Program in coastal villages, low nutrition standards, and limited food diversity in Bintan Regency Food and Agriculture Security Annual Report 2021 (DKPP Bintan, 2021). One indicator of measuring household food security is accessibility (Peng & Berry, 2018).
The accessibility of food represents the ability to have easy, affordable, and stable access to nutritious food, which is a basic need for survival (Falls, 2012). Limited access to food in rural areas is caused by various factors, such as the absence of complete food stores, lack of transportation, and low income due to poverty (Akpalu et al., 2018). Furthermore, a more critical element in ensuring access to food is where the food comes from and who controls its production and distribution. Thus, the problem of access to food is a complex issue with various interconnected factors. Therefore, addressing access to food requires solutions that reach various elements that can affect it.
This article focuses on the role of social networks in strengthening access to food, an approach that has yet to be well-discussed in various food security studies. Social networks articulate relationships between individuals, families, households, villages, communities, and regions. Each can play a dual role, acting as both a unit or node in a social network and as a social actor (Zaphiris & Pfeil, 2007) which is then described in a mapping of relationships (Kadushin, 2012). Social Network Analysis (SNA) is crucial in various disciplines (Popp et al., 2018) and have applied in various fields. SNA is a tool for examining how social relations interact, how to manage them, and how their structure influences choices and actions (Ognyanova, 2022).
Previous studies have focused on using SNA to examine the relationship between social networks and food security. Social networks play a significant role in improving livelihoods, with two essential variables being information and support, which greatly influence food security (Kelemu et al., 2017). Other studies have focused on the contribution of social networks to the four dimensions of food security, namely availability, access, utilization, and stability, by examining the relationship between community-based natural resource management and food security. Social networks are a significant way for rural communities to manage resources under common ownership to obtain food sources (Mertens et al., 2015).
The problem of spatial access faced by small island communities also affects the problem of access to food. Spatial access is a crucial factor for the survival and resilience of small island communities. A study on spatial access, which focused on transportation availability and characteristics, found that households in island clusters face four main issues: disruptions in spatial accessibility due to large waves, bad weather, unsafe vehicle conditions, and irregular schedules (Hilvano et al., 2022). These spatial access issues also affect the food supply in small islands.
Another factor that demonstrates the role of social networks in addressing food security and social inequality is the gap in the formal food system by organizations in the network and policymakers. Quantitatively, the network structure varies by region, with areas with more significant disparities and inequalities less connected. A concerning pattern was found between regional networks, food security levels, and regional inequality and disparities towards vulnerable districts (Hilvano et al., 2022). Governments play an essential role in influencing local food systems. To analyze the involvement of stakeholders in the management of conservation areas, SNA has been used (Yu & Chu, 2022).
SNA is a method for analyzing networks that can identify nodes and explain the connectivity between elements within a node. Depending on the data and research question, network ties can be binary (two actors connected or not), signed (actors can have positive, negative, or no connections), and valued (give a number to each tie based on its strength). Each can play a dual role as a unit or node in the social network or as a social actor (Ognyanova, 2022; Serrat, 2017). SNA represents the interactions and relationships between individuals in a community (Hemmings, 2014; Zaphiris & Pfeil, 2007). A literature review on using SNA shows that centrality indicators play a crucial role in the network (Popp et al., 2018). Centrality is one of the most important and widely used conceptual tools for analyzing social networks (Butts, 2008; Hemmings, 2014; Serrat, 2017). Network analysis is one of the analyzes that use R, which visualizes a network object in a graph (Matloff, 2016).
This study analyzes how social networks can be connected and interact to strengthen food accessibility for poor households in the maritime and outer islands of Bintan Regency, Riau Islands Province, Indonesia. The scientific contribution of this research can identify the pattern of the food access network in small island areas, the communities involved, and their level of accessibility within the network, determine critical actors in the network and identify ways to optimize future food access in maritime small island communities.
Research Methodology
Study Area
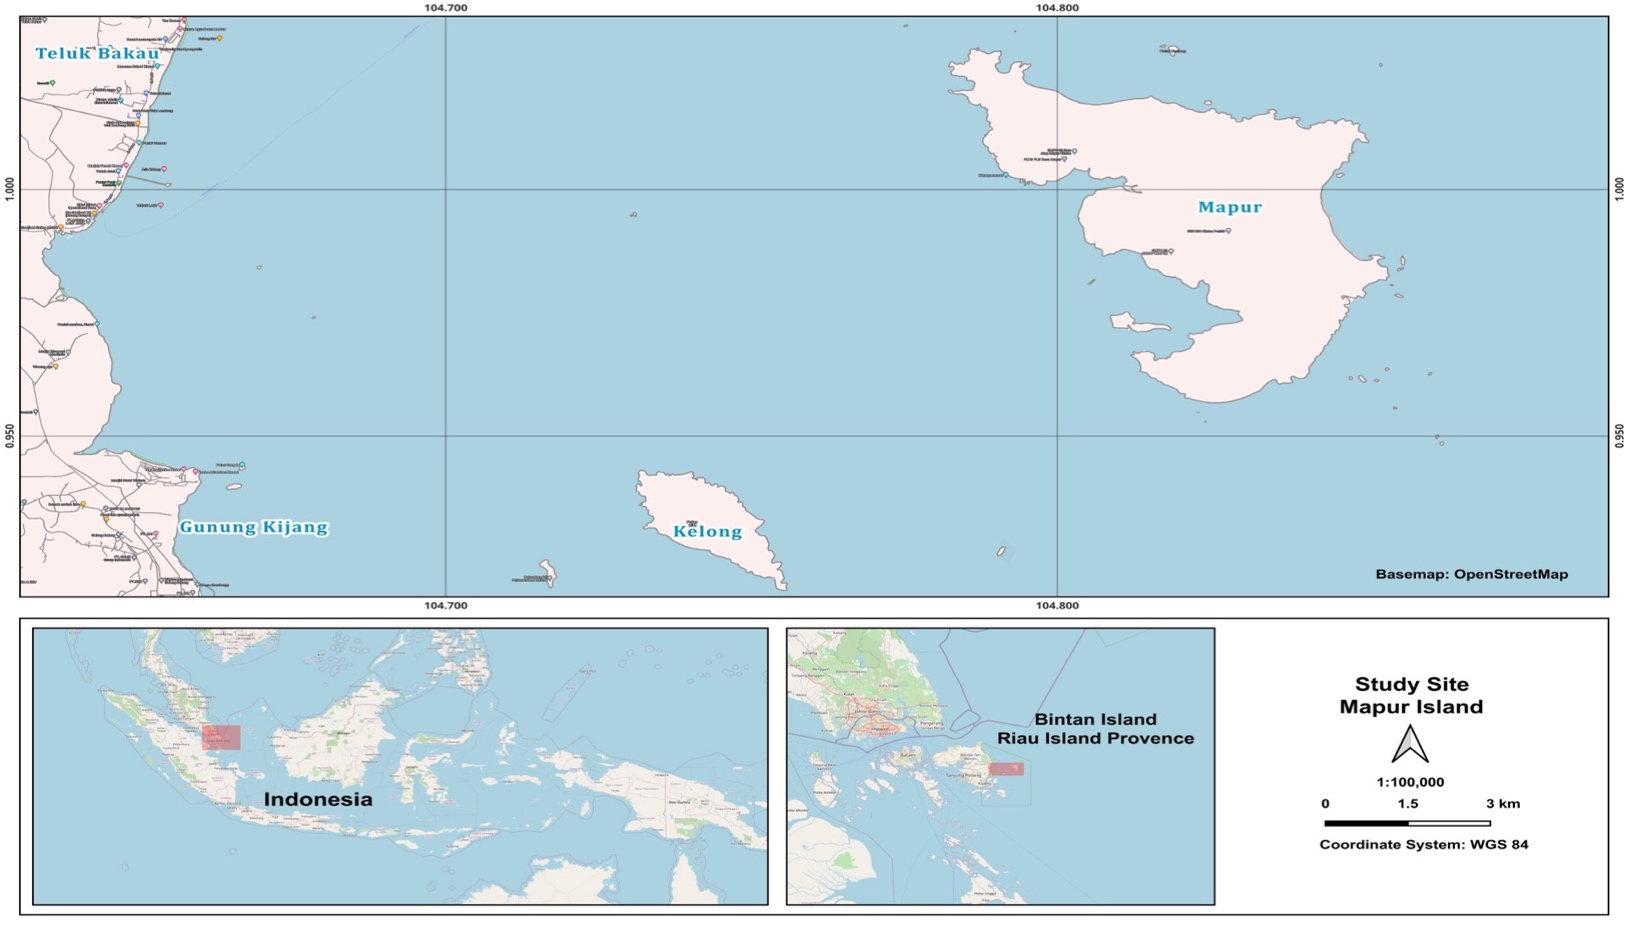
The research location was purposively selected (Jamshed, 2014), namely Mapur Village, located on Mapur Island with coordinates of 1°0'1.000"N 104°49'27.000" E (Figure 1). Mapur Island is one of the small (646.5 hectares) and outermost islands of Bintan Regency, Riau Islands Province, Indonesia (Indonesia Government, 2019). It directly borders the South China Sea with an elevation of 10 m above sea level. The village has a population of 1006 people with 272 households. Among the population, 58 people (5.77%) have never attended school, and 225 people (22.36%) have not completed elementary school for the age group of 13 to 75 years. The main livelihood of the people is fishing. For the age group of 19 to 75 years, there are fishermen (41.44%), housewives (41.86%), farmers (1.48%), laborers (5.29%), civil servants (1.06%), and others (8.8%) (DKPP Bintan, 2021). The potential commodities in Mapur Village are fisheries, grouper fish cultivation, and tourism (beach and underwater tourism). Several fishermen groups include net fishermen, trap fishermen, and fish aggregation device (FAD) fishermen. The village’s community welfare level is relatively low, as shown by the high number of households receiving social assistance. Among them, 19.51% are recipient households of the family hope program (PKH), globally known as Conditional Cash Transfers /CCT (Lindert, 2014). This program is a conditional social assistance program aimed at low-income families. Education and health facilities on Mapur Island are minimal. Mapur Island does not have a Community Health Center, Junior High School, and Senior High School buildings.
The village community of Pulau Mapur, located in the Riau Islands province of Indonesia, needs help accessing essential services due to limited sea transportation options. To reach the district and provincial capital of Pulau Bintan on the mainland island, villagers must rely on infrequent ferry services that operate only 2–3 times per week, with cancellations occurring during periods of adverse weather and strong waves. A single ferry can accommodate just 20–25 passengers, with the only other option being a small speedboat operated by local fishermen. This scarcity of sea transportation has had significant implications for providing essential services such as healthcare, education, and food security. The lack of reliable transportation means villagers must travel by sea to the district capital to access healthcare and education services.
Additionally, the limited variety of food sold at daily village markets makes it difficult for residents to meet their nutritional needs. Furthermore, the availability of electricity and clean water is also a concern, with the village government providing electricity and distributing water from a communal well to households. However, the electricity supply is limited to nighttime hours only.
Data Collection and Analysis
This research employs a survey method (Petr Schmied, 2018; Robert A. Hanneman, 2001) with a quantitative and qualitative approach (Dey, 2003; Jamshed, 2014). Data collection used interview methods using questionnaires and FGD (Rosenthal, 2016). The data collected in this study, in addition to socio-economic and demographic information related to food access, including the collection of network data by asking the number of relatives and non-relatives in the household, traders who live on or off the island whom they know, and relatives they rely on for information exchange, support, resources, and to discuss food issues. Eighteen heads of households, or 32% of the households receiving the Family Hope Program on Mapur Island, were interviewed for this purpose. Furthermore, data collection related to social networks accessing food also uses FGD. Informants for the FGD were purposively selected based on their knowledge of the required information (Table 1). The network survey analysis also identified people who were the center and the main link between regions.
| Data | Collection Method Data | Data Source | |||
|---|---|---|---|---|---|
| Respondents | Informant | ||||
| Socioeconomic, demographic, household network of respondents | Interviews | Male | Female | Element | Total |
| 12 | 3 | ||||
| Access and Food security problems; Government policy; Social networks and Relationships between networks | Focus Group Discussion | Government | 4 | ||
| Academics | 2 | ||||
| Food traders | 2 | ||||
| Collector/Patron trader | 2 | ||||
| Fisherman | 4 | ||||
| Non-fisherman | 4 | ||||
Data analysis using descriptive statistical analysis technique (Sholikhah, 2016) and Social Network Analysis using R-Studio version 4.2.1, a programming environment for data analysis and graphics (Harris, 2018), were conducted in this study. The descriptive Statistical Analysis technique describes and interprets the data characteristics obtained from survey results. Social Network Analysis, on the other hand, involves the analysis of the network model of interactions between actors based on the descriptive statistical analysis results. The connectedness between actors reflects the interaction model constructed in the social network and the identification of essential actors in the network. The SNA method can determine the role of actors in social networks. The next step is to convert the sociogram obtained from the survey into a diagram format using the DIA software (Anggraini et al., 2011; Wahyu Setiyono, 2020). The resulting diagram is then analyzed using R to visualize how the nodes are connected and to measure the degree of interconnectedness among networks using community detection, centrality, betweenness centrality, and shortest path.
The first step is community detection analysis, network, or graph clustering. This technique assesses the significance of detected clustering or the number of clusters formed. Then visualize the results of the analysis using the graphs in R. two cluster features increase the reluctance of nodes to form communities (r>0) and those that decrease it (r<0) (Clark & Baldwin, 1998; Mcclamrock, 2019). The initial information available in the network structure indicates which nodes are interacting and which are not interacting, which is an example of an algorithm for detecting communities (Fortunato & Hric, 2016). Secondly, degree centrality is measured. Mathematically, the first step in calculating the degree centrality of an actor within the sociometric X is through the equation (1):
$$ d(n_i) = \sum_{j=1}^N x_{ij} $$
Where \(d(n_i)\) represents the degree of actor (node) \(I\), \(N\) is the total number of actors, and \(x_{ij}\) is the value of cell \(i\) and \(j\) in the sociometric matrix \(x\). The sociometric matrix is a matrix where 0 indicates no relationship and 1 indicates the existence of a relationship. It is helpful to normalize by comparing it to the maximum number of relationships an actor might have. If there are \(N\) actors in the community, the maximum possible number of relationships an actor can have is \(N-1\). Therefore, the normalized degree centrality value will range between 0 and 1. To normalize degree centrality using equation (2).
$$ C_D (n_i)= {{d(ni)} \over {N-1}} $$
Where \(C_D (n_i)\) is the normalized degree centrality of the actor (node) \(i\), \(d(ni)\) is the degree of the actor (node) \(i\), and \(N\) is the total number of actors. Degree centrality is also helpful for measuring the popularity of each node, where the higher the popularity of a node, the higher the access to other nodes to exchange information information (Farhan et al., 2019)
$$ C_b(n_i) = \sum_{j=1}^n \; \sum_{k=1}^{j-1} \; {{g_{jk} (ni)} \over g_{jk}} $$
Equation (3) calculates the centrality between an actor or \(C_b(n_i)\). Where \(C_b(n_i)\) is the betweenness centrality of actor (node) \(i\), \(g_{jk} (ni)\) is the number of geodesics from actor \(j\) to actor \(k\) that contain actor \(i\), \(g_{jk}\) is the number of geodesics from actor \(j\) to actor \(k\), and \(n_i\) is actor (node) \(i\), \(i\#j\), \(i\#k\). Normalization using equation (5) is carried out by comparing equation (5) for a node \(n\) with the number of possible pairs of nodes in the community without the presence of node \(n\). If the number of actors in the community is \(N\), then the number of possible pairs of nodes without the presence of node n is \(C (N - 1,2)\). Thus, the value of normalized betweenness centrality will range between 0 and 1. To normalize betweenness centrality using equation Normalized centrality can be calculated using equation (4).
$$ {C_B (n_i)} = { {c_b (n_i)} \over {\left({ (N-1) (N-2) } \over 2 \right)} } $$
The normalized betweenness centrality of an actor \(C_b (n_i)\) is represented by \(C_b (n_i)\), and \(c_b (n_i)\) represents the betweenness centrality of actor (node) \(I\), where \(N\) is the number of actors. Betweenness centrality (Zhang & Luo, 2017) is one way to measure centrality in a social network. This centrality analysis helps measure how far a node/actor controls information and controls the flow of information between actors. In addition, this measurement can show how a node or actor can facilitate interactions with other actors (communication intermediaries). A node must exist between other nodes to control the flow of information, and these nodes can interrupt the flow of information between nodes. In short, intermediary centrality measures the percentage of shortest paths in a network. Therefore, betweenness centrality is the most appropriate measure.
Finally, shortest path analysis is a method for determining the shortest path in the network (Simanjuntak, 2015; Zhang & Luo, 2017). This value will be the basis for designing a strategy to strengthen access to food, then visualizing it in a graph. These algorithms are very useful because each decision has an important time component and can have direct relevance to the algorithm (Firmansyah, 2019).Top of FormBottom of Form
Results
Community Detection
SNA will describe how the links in the network connect several entities/elements/nodes using community detection, degree centrality, betweenness centrality, and shortest path. These nodes use local/national terms, including ‘patron,’ which is often referred to as ‘tauke’ locally. ‘Patron’ has a patron-client relationship with various communities in the village, including fishermen. The patron-client relationship is an exchange relationship between two people that involves instrumental friendship where an individual with higher socioeconomic status (Patron) uses their influence and resources to provide protection or benefits to an individual or group (client). This work relationship pattern does not involve the family in their work. This working relationship will eventually lead to social relationships (Hakim, 2016). ‘Patrons’ in the village can act as fish collector traders, distributors, owners of small shops, and owners of sea transportation services, and have small shops in the village. Meanwhile, clients are fishermen households and village communities. Those in the client position in this relationship are fishermen, PKH recipient households, fishermen households (main livelihood as fishermen), and non-fishermen households (main livelihood other than fishermen).
Several algorithms can perform community detection in various ways, depending on the type of network and research objectives. The results of the community detection analysis describe the grouping of communities in the Mapur Village food access network. The walk trap algorithm detects communities through a series of short random walks with a modularity of 0.33. This value is greater than zero, indicating community formation is strengthening in Mapur Village. However, the communities formed are strengthened with shorter distances or with the nearest elements, as shown in Figure 2.
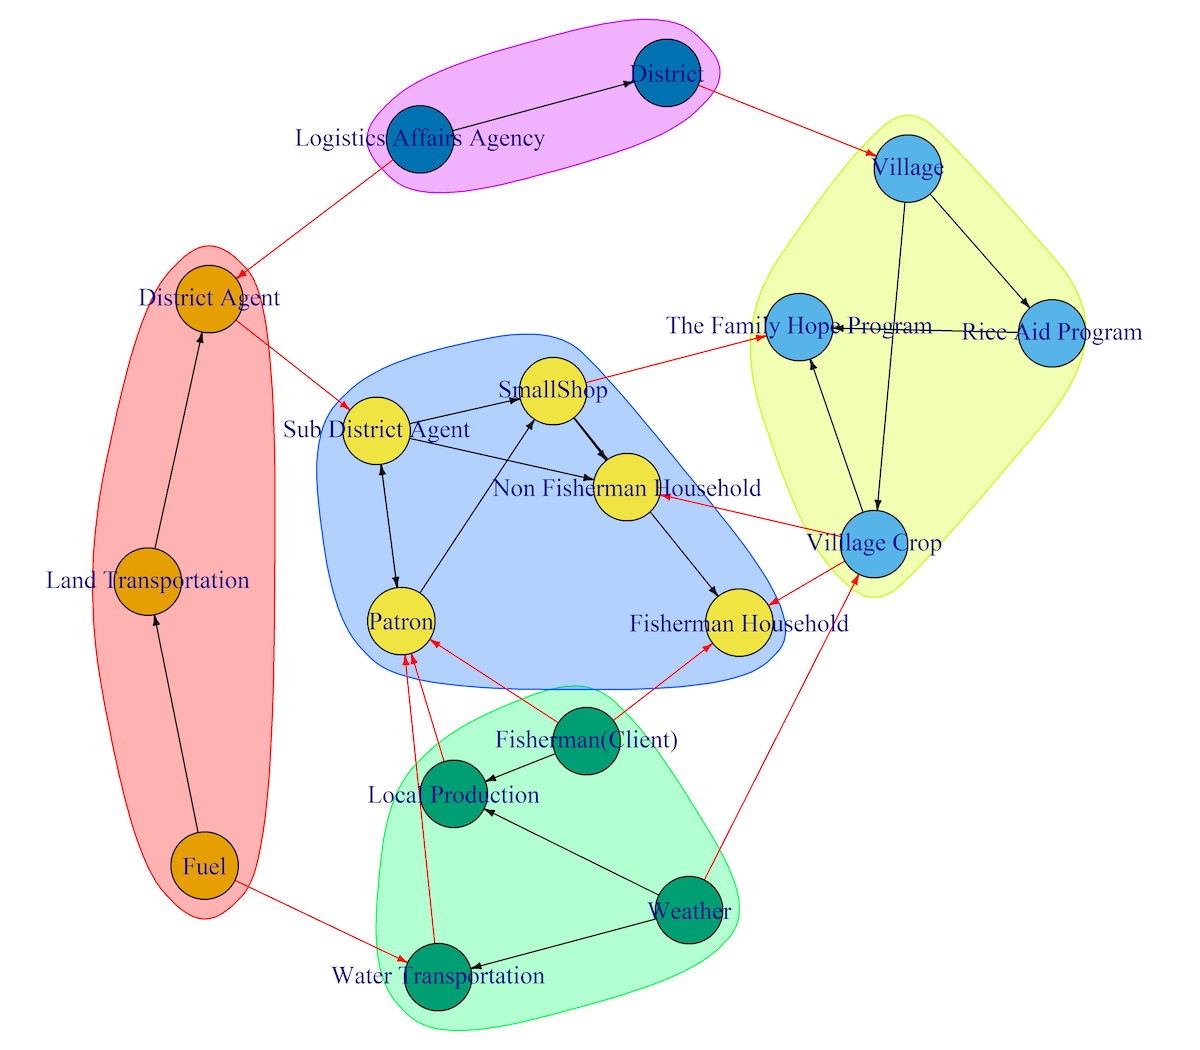
Community detection identifies five main communities in the network, namely: Community 1 (blue color) consists of fish households, patrons, non-fish households, small shops, and subdistrict agents; Community 2 (yellow color) consists of rice aid programs, village governments, village crops, and the family hope program; Community 3 (green color) consists of water transportation, local fish production, weather, and fishermen; Community 4 (red color) consists of fuel, land transport, and district agents; and Community 5 (purple color) consists of logistic affair agencies and district governments. These five communities formed do not overlap, but each community has its own network. The largest community (1) intersects with communities (2) and (3), and is very far from communities (5) and (6). Community 1 is included in a strong community because each node has a higher probability of being linked to each other subgraph node in the graph. The distance between community five, which are outside the island, is the cause of the high dependence of the community on the ‘Patron’ for food. Because those who can relate directly to the Logistics Agency that plays a role in food distribution are ‘Patron.’
Degree Centrality
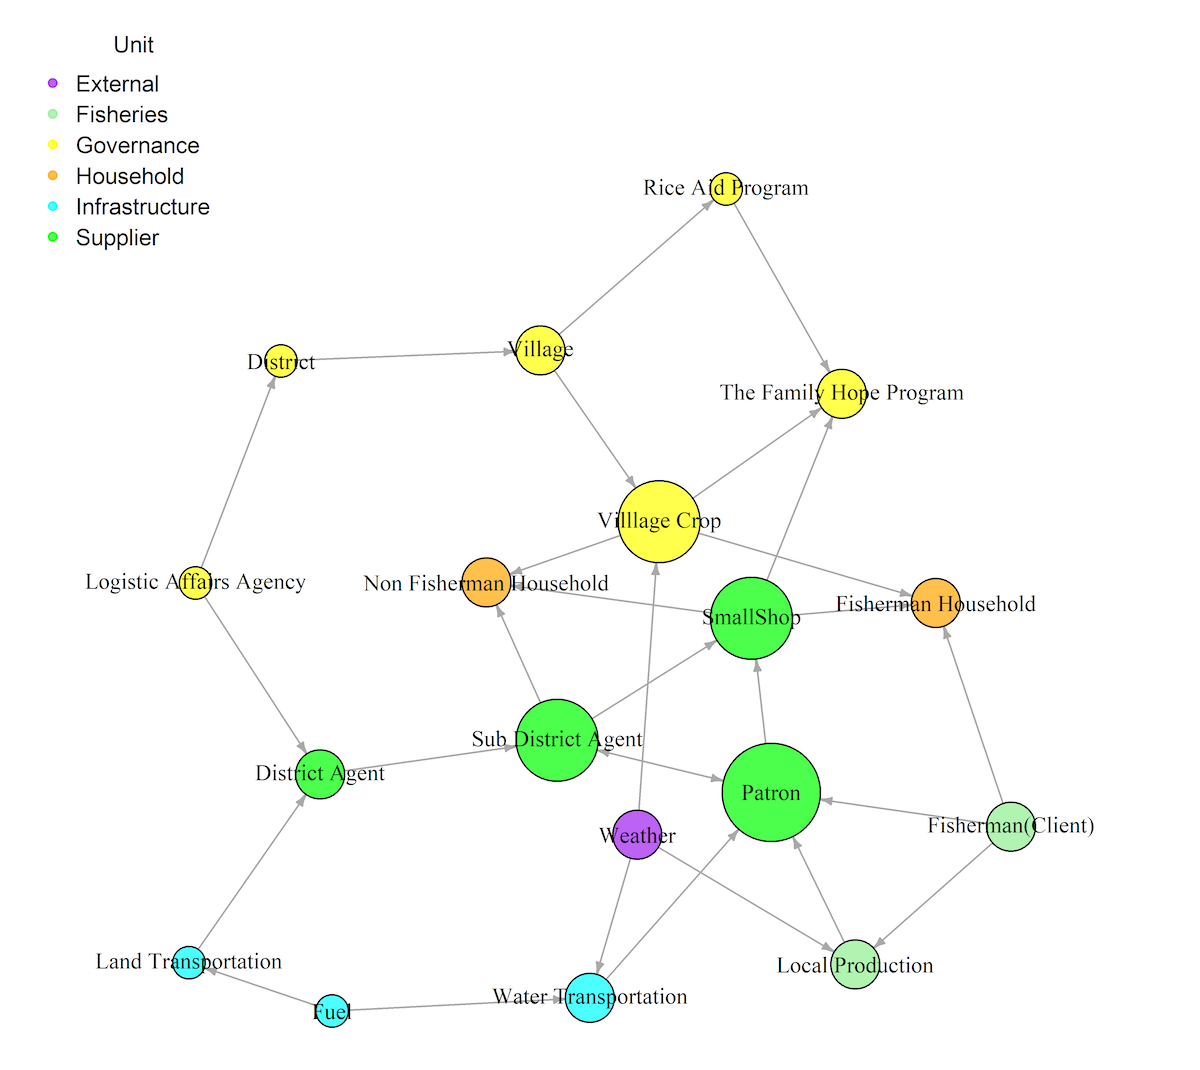
This analysis aims to identify the individuals/entities with the highest popularity or likability level in the sociogram, their strong relational communication abilities with other entities, and how their influence can affect access to food in Mapur village. Figure 3 visualizes the degree centrality value, where there are 18 entities in the group network, but only a few actors (individuals) have high centrality levels (popularity/likability). ‘The Patron,’ who plays a crucial role in buying and selling fish caught by fishermen in the village, is one of the most critical actors in the network. In the local language, Patron is called ‘tauke.’ Figure 3 shows the role of Patron in the network connecting nine networks connected to the other nine entities, namely sub-district agents, small shops, district agents, non-fisherman households, fisherman households, sea transport, local production, fishermen, and water transportation. The Patron is also known as the most popular entity among the villagers and can control information sources, availability, distribution, and accessibility of food. The Patron holds an influential central role in the accessibility of food in the village.
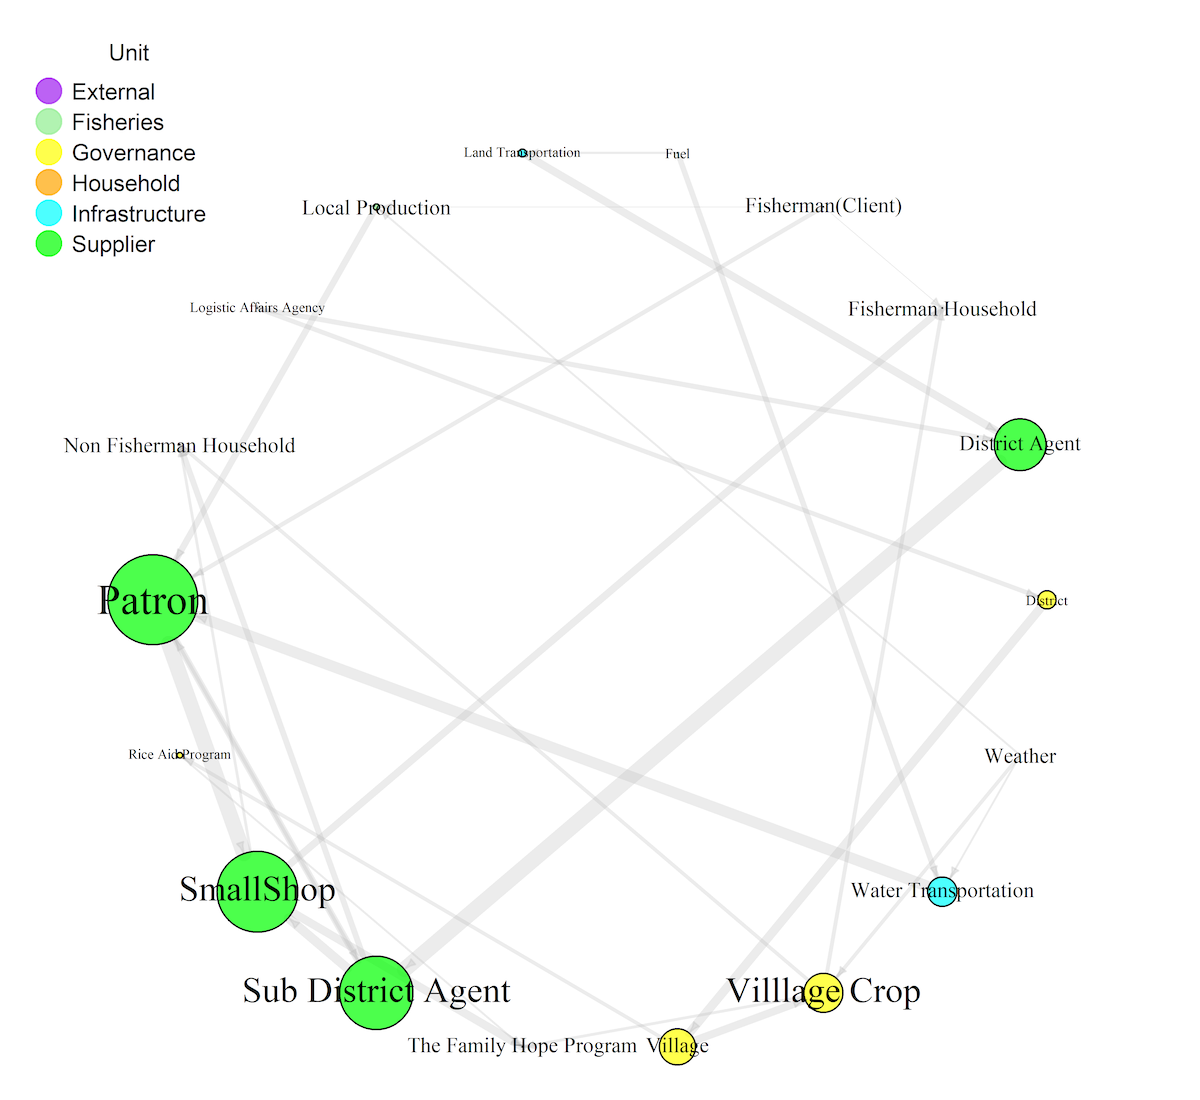
Betweenness Centrality
This analysis examines the role of a node/entity in mediating connections within a network using betweenness centrality. A node has significant value if it lies on a path that other nodes, such as transportation, communication, transactions, social assistance, fuel, food, or other purposes, must pass. Such nodes tend to have high intermediate centrality values. The Patron is a central intermediary between nodes/entities within and outside Mapur Island. Within the village, the Patron acts as a middleman between fishermen and sub-district agents, collects all fish production, provides sea transportation for the community, supplies daily food needs such as kerosene and gas for cooking, nine staple food items, and other shop items. The Patron also has direct access to the village government, sub-district agents, and district government.
Shortest Path
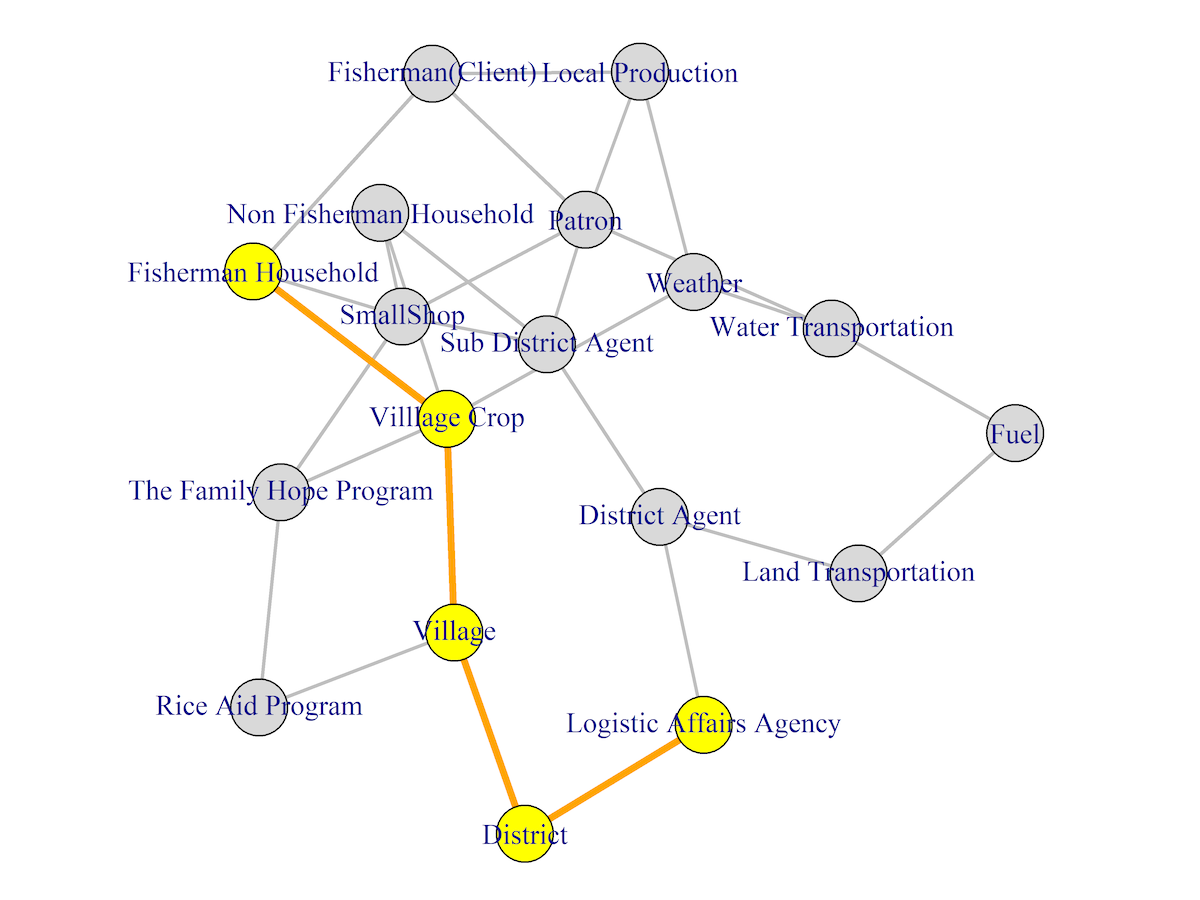
The Shortest Path Algorithm (SPA) method finds the shortest path in a connected, directed, and chained graph. This article uses the method to find the shortest path to access food that the people of Pulau Mapur village can find. The edges of a graph have a meaning beyond just connecting nodes, which is to solve problems or find solutions. Figure 5 shows that the ‘patron’ node reaches almost all nodes, but it causes the access path to food for poor households to become further away from the food sources (district agent, logistic affair agency, and district government nodes), thus depending heavily on the ‘patron.’ The shortest path analysis finds the shortest path to access food for poor households through the fishermen’s household, village crop, village government, district government, and logistic affair agency nodes (highlighted in yellow).
Discussion
The barrier of Sea Transportation to Mapur Island, Bintan
Bintan Regency, Riau Islands Province, which consists of small islands located on the border of Indonesia with neighboring countries, faces challenges in ensuring food security. The dominance of the sea area in this province is up to 96%, with only 4% land area, making the agricultural sector unable to meet the population’s needs, so it is very dependent on food supplies from outside the region, such as Java and Sumatra. However, transportation costs are high due to the long distance between provinces and the need to travel by land and cross several islands, and it takes considerable time to bring food to the region. Another factor that causes food scarcity on the island is the frequent delivery delays due to problems with the distance to the island and the influence of the weather. The implication is that it is difficult for the community to access food that fulfills nutrition at affordable prices on the island. Therefore, maritime transportation plays a crucial role in distributing and providing access to food for island communities To overcome this problem, the government has issued various regulations to prevent this action. His party took a policy to import food needs directly from abroad, such as Malaysia and Thailand. This country is much closer than other provinces in Indonesia.
Developing maritime transportation networks requires connectivity between food production areas and consumers. Integrated infrastructure between maritime and land transportation is needed to develop such services. This integrated mode of transportation also connects with a port’s hinterland. Weather conditions significantly affect the distribution of food by the sea. Therefore, a food buffer stock is needed. The success of buffer stock development is greatly influenced by maritime transportation infrastructure and resource allocation according to demand, including the use of technology (Widodo et al., 2013). Small island regions are inherently vulnerable to shocks, which sometimes co-occur due to geographical, topographical, and climate-related features. Meanwhile, building robust and sustainable maritime transportation requires significant investment. Meanwhile, building robust and sustainable maritime transportation requires significant investment. Therefore, it is necessary to strengthen partnerships to mobilize resources and build greater collaboration, dialogue, cooperation, and engagement between states, organizations, and the public-private sector (UNCTAD, 2021). In addition, it is necessary to improve the transportation system and port warehouses on each small island. Community ships can help overcome the small fleet of cargo ships to distribute rice from the district center to each small island (Arifin et al., 2017). Harbor terminals on the islands should also support sound transportation systems as a mode of maritime and land transportation for carrying food supplies (La Welendo et al., 2021). Smooth distribution of food through sustainable domestic and inter-regional shipping and utilizing small-scale regional trade opportunities between islands are solutions to strengthening food access in small island regions.
This article discusses the relationship between maritime transportation and spatial accessibility. Spatial accessibility problems for islands related to transportation can be measured using indicators such as distance (km), availability of public vehicles, round-trip travel time in a day (available/unavailable), the number of vehicles making trips per week, the number of trips per week, the total passenger capacity of vehicles per week, and transportation connectivity (Hilvano et al., 2022). Despite the beauty of Mapur Island’s coastal and underwater scenery, transportation to the island is limited. The island is located 50 km from the nearest island (district capital), and only one boat with a maximum passenger capacity of 20 people and a travel time of 2–2.5 hours is available, making 2–3 trips per week. Furthermore, the condition of the boat is often unsafe, and it carries both passengers and agricultural/fishery products of the local community. Overloading is also typical and dangerous during bad weather with high waves. The government should address maritime transportation issues that hinder small island communities’ food access. Maritime transportation is crucial for accessing food from outside and transporting local resources for export. Mapur Island is known for its high fishery production, which has export potential. Mapur Island is known for its high fishery production, which has export potential. Fish is a high-protein food source (Abhimanyu et al., 2019), but it needs to be distributed immediately after being caught so it does not spoil quickly. Therefore, the community needs storage facilities and ice, which depend on the smoothness of maritime transportation.
Village Food Barns and Purchasing Power of the Community
Mapur Island has the minimal infrastructure, such as inadequate health facilities, education, social facilities, food, water, electricity, waste management, and road infrastructure. Mapur Island does not have a village market, food storage, or a complete grocery store that can serve various foods to meet nutritional needs. Mapur Village has only one small grocery store owned by villagers that serves the entire community. The basic infrastructure of a village has an important role and can affect economic growth and poverty (Sari et al., 2017; Tinambunan et al., 2020). While the local fisheries can serve as a food source to meet nutritional and protein needs, the low level of prosperity leads fishermen to sell almost all of their catch to support their families. Although some households use fish processing, they need proper processing and storage facilities. As a result, income decreases due to rapid decay. Access to diverse, nutritious food is challenging for households, especially during adverse weather conditions.
The low purchasing power of households in small and remote islands is due to low levels of prosperity. This condition can be seen in the food households consume daily, such as instant noodles and eggs. These products are readily available at the village grocery store and are affordable. Household food consumption strategies reflect this reality, with 63.5% of households opting for cheaper food, 20% borrowing food or relying on friends or relatives, and 7.8% reducing the number and size of their meals. Poor households also rely heavily on government social assistance programs. However, this situation does not support sustainable food access for households, as they are not self-sufficient in income. Moreover, high food prices further reduce the community’s purchasing power (Silvia et al., 2021). Government intervention is crucial to increase the purchasing power of poor households to access nutritious food, and government intervention is needed. Villagers still need interventions such as rice assistance and fuel subsidies (Maryono et al., 2020), which can reduce the production costs of fishing activities dominant in Mapur Island. In addition to social assistance programs, the government needs to carry out interventions to support sustainable livelihoods for the community. Interventions must be fair to both men and women (CGIAR & IWMI, 2018), and gender integration is essential at every program stage (Conservation International, 2019).
Social Networks and Food Access on Mapur Island, Bintan
Social networks play a crucial role in facilitating access to food in Mapur Island, Bintan. The network consists of interconnected entities, with two elements comprising the network: nodes (connected actors, also known as vertices) and edges (connections). Several entities can function as nodes in the food access network, including individuals, households, organizations, government, programs, seasons, and locations. The network’s edges represent the relationships or exchanges between actors, which can be one-way or mutual.
Access to food refers to the ability of households or communities to access food and meet their nutritional needs quickly. The higher the level of access to food, the stronger the food security in the village. Through community detection analysis, the research found that fisherman and non-fisherman households on the island have a short and minimal social network in the village. Patrons in the network have relationships and interact with more nodes than other entities in the community. Food access relationships only extend to small shops in the village and are one-way, from small shops to households. Meanwhile, small shops have access to sub-district agents who also act as patrons for households in the village.
The patron-client relationship (PCR) is an open, asymmetric, but mutually beneficial transaction based on the differential control of resources and flows in the community. Patrons can limit access to the resources they control and divert them as they see fit (Roniger, 2015). In the local context, they were referring to ‘Patron’ as ‘tauke,’ who serves as a collector and trader and owns a small shop in the village, while clients are fishing households and villagers. The patron-client relationship is a cultural legacy still applied in traditional rural communities today (Lukiyanto, 2018). This relationship also exists in other areas of Indonesia, such as Madura (Ubaidillah & Kusairi, 2017) and Sumatra (Rahayu et al., 2020).
The patron plays a vital role in the access to food in Mapur Island, Bintan. The patron has a broad relationship network beyond the village or island and controls resources in the village, such as purchasing local production from fishermen and selling it to the district agent. The patron also provides various needs for the island community, including fuel, ice, household essentials, fishing and agricultural supplies, and transportation by sea. Moreover, the patron’s sea transportation also carries government rice aid to households that receive the family hope program. These households are separated from other communities in the village food access network and often interact with the village government to obtain social assistance. After the COVID-19 pandemic, the village government started developing a garden program. The betweenness centrality analysis revealed that the Patron is a central intermediary actor connecting many nodes in Mapur Island’s food access network. Therefore, the Patron’s role as an intermediary significantly affects the smooth distribution of social aid to recipient households, such as rice and other essential commodities. This impact is critical for food access when sea transportation is unavailable during bad weather conditions. This situation affects not only food but also access to healthcare and education.
The most vulnerable entity to food access is households that receive the family hope program due to their weak social networks and separation from other community networks. Hence, they must rely on their relatives, neighbors, and friends when they have difficulty obtaining food. This problem indicates the importance of social networks in improving access to food for poor households in Mapur Island, Bintan. Social networks’ critical role in food resilience is also evident in the econometric model estimation study, which showed that households with higher and more robust social networks had higher food resilience. The multinomial logit model estimated two social network variables, the number of relatives and non-relatives living in the village, and statistically significant and positive effects on reducing households’ vulnerability to food insecurity (Kelemu et al., 2017).
Conclusion and Suggestions
This study explores how social networks can connect and interact to strengthen food accessibility for poor households in maritime villages on small and remote islands. Households receiving the Family Hope Assistance Program (PKH) are the primary targets in this research. Social network variables, described as nodes and ties, were analyzed using social network analysis with R tools to depict how each node connects and interacts with others in the network, influencing the strength of poor households’ access to food. The social network model in community detection analysis showed that poor households on small and remote islands had external social networks, interacting with only one community (close relatives, social assistance) and rarely interacting with other communities in the village. This form of social interaction will affect PKH household food access vulnerability. Furthermore, other households in the village, both fishermen and non-fishermen households showed limited social networks at the village level, leading to limited food access for the small island community. Nodes with broader networks and interactions with many networks, both on and off the island, are called ‘patrons.’ In the social network of Mapur Island, patrons play a crucial role as central intermediary nodes that can connect all nodes and interactions in the network. The smooth access to food on Mapur Island highly depends on the patrons’ role in serving the village’s food needs. This dependence is very vulnerable during extreme weather events caused by climate change.
The implications of the finding that social networks positively affect food access for households on small and remote islands are as follows:
- Social networks are an essential social interaction medium for households to strengthen food access. Therefore, it is necessary to build better social networks beyond the island to ensure good food access and prevent food vulnerability during extreme weather events for poor households and communities on Mapur Island.
- The close patron-client relationship in island society encourages patrons to play an essential role in linking all entities and interests. Government policies and programs should become an intermediary role that can expand the social network of all communities in the village.
- The government needs to intervene to strengthen people’s access to food on the island. In addition to continuing the social assistance and subsidy programs, the government can strengthen the Seafood highway and build village food storages supported by the logistics affairs agency.
Acknowledgments
We are highly grateful to the researchers and would like to thank the Directorate General of Higher Education, Research and Technology Ministry of Education, Culture, Research, and Technology through the Directorate of Research, Technology and Community Service https://dikti.kemdikbud.go.id who has funded this research in Fiscal Year 2022. In addition, to LP3M UMRAH, the Regency Government of Bintan https://bintankab.go.id/, Maritime Affairs and Fisheries of the Riau Archipelago https://dislautkan.kepriprov.go.id/ for facilitating this research, local NGO http://fcsea.or.id/ and Local people who have provided research data and information.
References
- Abhimanyu, T., Dhiman, A. K., Thakur, N. S., & Hamid, H., 2019. An Introduction to Seafood and Recent Advances in the Processing of Seafood Products. International Archive of Applied Sciences and Technology, 10(2), 169–180. https://doi.org/10.15515/iaast.0976-4828.10.2.169180
- Agustina et al., 2020. Consumption Patterns and Food Security Levels of Poor Households in Gading Rejo District, Pringsewu Regency. Jiia, 8(3), 490–495. https://jurnal.fp.unila.ac.id/index.php/JIA/article/view/4449/pdf
- Ahdiat, A., 2022. Indonesia’s Food Security 2021. In Databox.id. https://databoks.katadata.co.id/datapublish/2022/03/22/ketahanan-pangan-indonesia-melemah-pada-2021
- Akpalu, W., Christian, A. K., & Codjoe, S. N. A., 2018. Food access and subjective welfare in a developing country. Journal of Behavioral and Experimental Economics, 73(January), 34–39. https://doi.org/10.1016/j.socec.2018.01.002
- Anggraini, D., S, K. A., Yuda, H., & Mulia, S., 2011. Practicum Module : Application Software [ Dia ].
- Arifin, A. Y., Soemarno, Setiawan, B., Sudarto, & Teapon, A., 2017. Production Optimization and Food Needs Provision Distribution in South Halmahera Regency, North Maluku. Agricultural Socio-Economics Journal, 17(3), 140–151. https://doi.org/10.21776/ub.agrise.2017.017.3.6
- Butts, C. T., 2008. Social network analysis: A methodological introduction. Asian Journal of Social Psychology, 11(1), 13–41. https://doi.org/10.1111/j.1467-839X.2007.00241.x
- Cahyadinata, I., Fahrudin, A., Sulistiono, & Kurnia, R., 2019. Food security and multidimensional poverty of mud crab fishermen household in small and outer islands of Indonesia. Case study: Enggano island, Bengkulu province. AACL Bioflux, 12(4), 1196–1207.
- CARE., 2021. Impact of COVID-19 on Food Security, Gender Equality, and Sexual and Reproductive Health in Yemen (Issue September 2021). https://reliefweb.int/report/yemen/impact-covid-19-food-security-gender-equality-and-sexual-and-reproductive-health-yemen
- CGIAR, & IWMI., 2018. Gender-equitable pathways to achieving sustainable agricultural intensification (Issue 5). https://doi.org/10.5337/2018.204
- Clark, K., & Baldwin, C. Y., 1998. Modularity-in-Design: An Analysis based on the Theory of Real Options. Working Paper, Harvard Business School, 2(August).
- Conservation International., 2019. Guidelines for Integrating Gender & Social Equity Into Conservation Programming. 1–21.
- Devanda et al., 2020. Household Food Security of Traditional Fishermen in Pasarmadang Village, Kota Agung District, Tanggamus Regency. JIIA, 8(4), 681–688.
- Dey, I., 2003. Qualitative data analysis: A user-friendly guide for social scientists. In Qualitative Data Analysis: A User-Friendly Guide for Social Scientists. https://doi.org/10.4324/9780203412497
- DKPP Bintan., 2021. Strategic Plan for Food Security and Agriculture Service or DKPP Bintan for 2021–2026.
- Falls., 2012. Factors that Influence Food Access in the United States : A Snapshot of Food Access in Ohio and Kentucky. https://corescholar.libraries.wright.edu/cgi/viewcontent.cgi?article=1087&context=mph
- Farhan, M. T., Darwiyanto, E., & Asror, I., 2019. Analysis of Hubs and Authorities Centrality Using Probabilistic Affinity Index (PAI) on the directed-weighted graph in Social Network Analysis. Journal of Physics: Conference Series, 1192(1). https://doi.org/10.1088/1742-6596/1192/1/012005
- Firmansyah, A., 2019. Characteristics of Shortest Path Algorithm: Effectiveness of Dijkstra’s and Bellman Ford’s Algorithm in Parallel Programming. September. https://doi.org/10.13140/RG.2.2.28907.69924
- Food Security Agency., 2021. Food Security Index 2021. In Indonesian Ministry of Agriculture (Vol. 0, Issue 0). http://repository.pertanian.go.id/bitstream/handle/123456789/15396/IKP2021-ISBN.pdf?sequence=1&isAllowed=y
- Fortunato, S., & Hric, D., 2016. Community detection in networks: A user guide. Physics Reports, 659, 1–44. https://doi.org/10.1016/j.physrep.2016.09.002
- Gordillo, G., & Jeronimo, O. M., 2013. Food Security and Sovereignty. In the News.Ge.
- Harris, R., 2018. An Introduction to R. Quantitative Geography: The Basics, 1, 250–286. https://doi.org/10.4135/9781473920446.n12
- Hemmings, J., 2014. Social network. Selvedge, pp. 60, 50–54. https://doi.org/10.22196/rp.v22i0.6322
- Hilvano, N. F., Bantayan, N. C., Pulhin, J. M., Nelson, G. L. M., & Arboleda, M. D. M., 2022. Small Island Spatial Accessibility: The Case of San Vicente, Northern Samar, Philippines. Journal of Marine and Island Cultures, 11(1), 22–41. https://doi.org/10.21463/jmic.2022.11.1.03
- Indonesia Government., 2019. Indonesian Presidential Regulation number 9 of 2019.
- Indonesian Health Ministry., 2020. Annual Report of the Research and Development Center for Public Health Efforts in 2019. In Puslitbang Ukesmas. http://www.pusat3.litbang.kemkes.go.id/downlot1.php?file=Laptah2019.pdf
- Jamshed, S., 2014. Qualitative research method-interviewing and observation. Journal of Basic and Clinical Pharmacy, 5(4), 87. https://doi.org/10.4103/0976-0105.141942
- Kadushin., 2012. Basic Network Concepts. SpringerBriefs in Computer Science, 0(9781461422532), 1–81.
- Kelemu, K., Hailu, M., Haregewoin, T., & Bezabeh, E., 2017. Effect of social networks on food security status : The case of maize producing farmers in Ethiopia. New Media and Mass Communication, 62, 22–30. www.iiste.org
- La Welendo, Rianse, U., Putra, A. A., & Hatani, L., 2021. Characteristic analysis of sea transportation passenger Kendari Nusantara Port. GSC Advanced Engineering and Technology, 1(2), 042–048. https://doi.org/10.30574/gscaet.2021.1.2.0038
- Lindert, K., 2014. Lindert - CCTs. In Social Safety Net Core Course. https://www.worldbank.org/content/dam/Worldbank/Event/social-protection/Lindert - CCTs .pdf
- Lukiyanto, K., 2018. Patron-client relationship in microenterprise development as a cultural heritage in the modern era. Pertanika Journal of Social Sciences and Humanities, 26(T), 155–162.
- Matloff, N., 2016. A User’s Guide to Network Analysis in R . Journal of Statistical Software, 72(Book Review 3). https://doi.org/10.18637/jss.v072.b03
- McClamrock, R., 2019. Modularity. https://doi.org/10.1002/0470018860.s00168
- Mertens, F., Fillion, M., Saint-Charles, J., Mongeau, P., Távora, R., Passos, C. J. S., & Mergler, D., 2015. The role of strong-tie social networks in mediating food security of fish resources by a traditional riverine community in the Brazilian Amazon. Ecology and Society, 20(3). https://doi.org/10.5751/ES-07483-200318
- Ognyanova., 2022. Social Network Analysis. 1–8. https://kateto.net/papers/Social Network Analysis - Ognyanova - 2022.pdf
- Peng, W., & Berry, E. M., 2018. The concept of food security. Encyclopedia of Food Security and Sustainability, 2(January), pp. 1–7. https://doi.org/10.1016/B978-0-08-100596-5.22314-7
- Petr Schmied., 2018. Rapid Guide to Survey Sampling (pp. 1–3). www.indikit.net
- Popp, J., Balogh, P., Oláh, J., Kot, S., Rákos, M. H., & 2, P. L., 2018. Social network analysis of scientific articles published by food policy. Sustainability (Switzerland), 10(3), 1–20. https://doi.org/10.3390/su10030577
- Rahayu, R. I., Hendri, R., & Nugroho, F., 2020. The dependence of fishermen from the sea tribe on tauke in Panglima raja Village, Concong District, Indragiri Hilir Regency, Riau Province. Coastal Socio-Economic Journal, 1, 18–21.
- Robert A. Hanneman., 2001. Introduction to Social Network Methods Introduction to Social Network Methods.
- Roniger, L., 2015. Patron-Client Relations, Social and Anthropological Study. International Encyclopedia of the Social & Behavioral Sciences: Second Edition, pp. 17, 603–606. https://doi.org/10.1016/B978-0-08-097086-8.12125-7
- Rosenthal, M., 2016. Qualitative research methods: Why, when, and how to conduct interviews and focus groups in pharmacy research. Currents in Pharmacy Teaching and Learning, 8(4), 509–516. https://doi.org/10.1016/j.cptl.2016.03.021
- Sari, R. M., Maqdi, I. A., & Syahbandar, M. Y., 2017. Analysis of the Influence of Infrastructure Development on the Poor in Tangerang City. Prosiding Seminar Nasional “Perencanaan Pembangunan Inklusif Desa-Kota,” 737–746. http://repo.unand.ac.id/5269/1/PROSIDING ASPI PERHEPPI - Faidil Tanjung.pdf
- Serrat, O., 2017. Social Network Analysis. Knowledge Solutions, 1–1140. https://doi.org/10.1007/978-981-10-0983-9
- Sholikhah, A., 2016. Descriptive Statistics in Qualitative Research. Komunika, 10(2), 342–362.
- Silvia, D., Balafif, M., & Rahmasari, A., 2021. Faktor-Faktor yang Mempengaruhi Tingkat Daya Beli Masyarakat di Kabupaten Sidoarjo. Bharanomics, 2(1), 81–92. https://doi.org/10.46821/bharanomics.v2i1.193
- Simanjuntak, O. S., 2015. Pengembangan Longest Path Algorithm (Lpa) Dalam Rangka Pencarian Lintasan Terpanjang Pada Graf Bersambung Berarah Beruntai. Telematika, 8(2), 280–287. https://doi.org/10.31315/telematika.v8i2.449
- Singh, D. R., Sunuwar, D. R., Shah, S. K., Sah, L. K., Karki, K., & Sah, R. K., 2021. Food insecurity during COVID-19 pandemic: A genuine concern for people from the disadvantaged community and low-income families in Province 2 of Nepal. PLoS ONE, 16(July), 1–20. https://doi.org/10.1371/journal.pone.0254954
- SMERU Research Institute., 2021. The Social and Economic Impacts of COVID-19 on Households and Strategic Policy Recommendations for Indonesia. https://doi.org/10.1093/jn/134.11.3143s
- Suryahadi, A., Izzati, R. Al, & Suryadarma, D., 2020. The impact of the COVID-19 outbreak on poverty: An estimation for Indonesia. In Jakarta SMERU Res. Inst. https://smeru.or.id/sites/default/files/publication/wp_covid19impact_draft.pdf
- Syahyuti, Sunarsih, Wahyuni, S., Sejati, W. K., & Azis, M., 2015. Food Sovereignty as a Base for Realizing National Food Security. Forum Penelitian Agro Ekonomi, 33(2), 95. https://doi.org/10.21082/fae.v33n2.2015.95-109
- Tinambunan, E. victara, Muhammad Findi, & Yeti Lis Purnamadewi., 2020. Dampak Pembangunan Infrastruktur dalam Mendorong Pertumbuhan untuk Mengurangi Tingkat Kemiskinan di Indonesia Tahun 2013 – 2017. Jurnal Ekonomi Dan Kebijakan Pembangunan, 8(1), 20–42. https://doi.org/10.29244/jekp.v8i1.29447
- Ubaidillah, K., & Kusairi, L., 2017. TAUKE, JURAGAN, BANDOL: Relasi Patron-Klien dan Transformasi Sosial dalam Organisasi Perdagangan Tembakau di Madura. Jurnal ETNOHISTORI, 4(1), 22–40. http://ejournal.unkhair.ac.id/index.php/etnohis/article/view/918
- UNCTAD., 2021. Review of Maritime Transport. In Small Island and Developing States: Maritime Transport in The Era of a Disruptive Pandemic - Empower States to Fend Against Disruptions to Maritime Transportation Systems, Their Lifeline to The World. https://doi.org/10.18356/4c6b06eb-en
- Wahyu Setiyono., 2020. Aplikasi Editor Diagram. https://www.scribd.com/document/337071382/E-Book-Panduan-Aplikasi-DIA-Editor-Diagram-Di-Linux#download
- Widodo, K. H., Perdana, Y. R., Riyadi, I. P., & Security, A. F., 2013. Determination of Sea Transport Route for Staple Food Distribution to Achieve Food Security in Eastern Indonesia. 7(8), 440–447.
- Yu, S. L., & Chu, Y. C., 2022. Using Social Network Analysis to Study Marine Protected Areas on Penghu Islands. Journal of Marine and Island Cultures, 11(1), 12–21. https://doi.org/10.21463/jmic.2022.11.1.02
- Zaphiris, P., & Pfeil, U., 2007. Introduction to social network analysis. In People and Computers XXI HCI. However Not as We Know It - Proceedings of HCI 2007: The 21st British HCI Group Annual Conference (Vol. 2). https://doi.org/10.14236/ewic/hci2007.89
- Zhang, J., & Luo, Y., 2017. Degree Centrality, Betweenness Centrality, and Closeness Centrality in Social Network. 132(Msam), pp. 300–303. https://doi.org/10.2991/msam-17.2017.68