Assessment of Macroplastic Litter on the Coastal Seabeds of Sultan Naga Dimaporo, Lanao Del Norte, Philippines
Abstract
Plastic pollution is an arising problem of our generation. Tons of plastics are globally produced affecting different coastal ecosystems. Plastics pile and end up in coastal areas, at the ocean surface, and in the coastal seabed. Almost 70% of plastics made are known to eventually sink in water, and it is suspected that ever-increasing amounts of plastics are accumulating in seabed sediments. However, there are limited studies on macroplastics in coastal seabeds in the different coastal ecosystems in the Philippines. This study aims to determine the prevalence, types, and density of macroplastic litters in the coastal seabed of Sultan Naga Dimaporo (SND), Lanao del Norte. A 100-m transect line with four quadrats measuring 5 m x 5 m, was delineated parallel to the seabed at the beaches of Barangay Pikalawag, Dabliston, Koreo and Sugod. Results revealed that all four sites were contaminated with plastic litter in which 55% were from Pikalawag, a residential area, 16% from Dabliston, a mangrove area, 15% from Sugod, a beach/tourism area, and 14% from Koreo, a non-residential area. The plastic density was 1.32 items/m2 for Pikalawag, and 0.32 to 0.37 items/m2 for the other areas. The waste collected was primarily food packaging (17%), plastic fragments (16%), and plastic bags (11%). The highest polymer type was LDPE (40%) followed by both multilayers (13%) and PET (13%). Based on the clean coast-index, Pikalawag can be categorized as extremely dirty while the other three sites were moderately clean. Overall, this study showed how the prevalence and composition of plastic litter vary in different coastal seabeds in SND, Lanao del Norte.
Keywords
macroplastic, seabed, pollution, mangroves, Lanao del Norte
1. Introduction
Plastic pollution is a significant problem nowadays and these plastics can be found everywhere. With the continuous increase in human population, the massive use of plastics also increases rapidly, mainly due to the vast usage of plastics (North and Halden 2013). These plastics are made to help people in their daily lives, which are supposed to make life better. According to Plastic Europe (2020), plastic manufacturing reached around 360 million tons in 2018 and is expanding at a 3.5 % annual rate. Plastics can be found in clothes, houses and buildings, cars, and transportation vehicles. The toys children play with, the screens from our televisions and gadgets like phones and laptops, the IT tools, and medical equipment all contain plastics (Plastics Europe 2020). Unknown to many, these plastic problems have now greatly affected the coastal ecosystem which makes over 4.8 - 12.7 million metric tons of plastic being globally produced per year (World Bank Group. 2021). The Philippines is considered the third largest contributor of plastic waste inputs in the ocean discharges 0.28 - 0.75 million metric tons of mismanaged plastic per year into the marine environment (Jambeck et al. 2015). Furthermore, the Philippines is known as the largest contributor of plastics from riverine sources according to a recent study by Meijer et al. (2021). Moreover, the amount of pollution in the environment including plastics is perceived to increase in the next decades (Sumeldan et al. 2021). Despite this, the country currently does not have any existing national research programs focusing on basic plastic problems which resulted to a limited understanding of its implications to the country (Onda et al. 2019).
Plastics pile up in the coastal areas, at the ocean surface, and on the coastal seabed. Almost 70% of all plastics made are known to eventually sink in water, and it is suspected that ever-increasing amounts of plastic items are accumulating in seabed sediments (Hammer et al. 2012). These plastics may be buried in the sediment, undergo weathering, be consumed by benthic organisms, and may harbor microbial communities (Schwarz et al. 2019; Onda et al. 2019; Shiu et al. 2020; Navarro et al. 2022). There were studies that tackled plastic pollution in different coastal ecosystems. These coastal ecosystems include riverine areas, mangrove areas, beach areas, and other respective coastal areas (Acot et al. 2022; Sajorne et al. 2022; Gaboy et al. 2022; Escañan and Bacosa, 2022; Navarro et al. 2022), but only a few have been conducted in the Philippines, especially on how plastics end up and submerged in coastal seabeds. The seabed is important to the coastal ecosystem in way that it sustains a crucial purpose and ecosystem services, which include nutrient regeneration, carbon sequestration, and biological and mineral resources (Banet 2020). Among the plastic litter that ultimately ends up in the sea, floating plastics or plastic debris are currently the most abundant waste items of marine litter. Wastes plastic makes up to 60% - 80% of all marine debris from surface waters to deep-sea water sediments (Kibria 2018).
Plastics have been detected on the shorelines of many countries, with more plastic materials found near popular tourist destinations and densely populated areas (Inocente and Bacosa, 2022). Eight percent (80%) of this plastic debris pollution even originates highly from land-based sources. The remaining twenty percent (20%) are those plastics that are ocean-based; originate mainly from the fishing industry, nautical activities, and aquaculture (IUCN 2018; Kibria 2018). In 2013, the Philippine plastic production reached up to 1,920 metric tons where 48% of plastic products are being used for packaging in the year 2017 (Sea Circular, 2020).
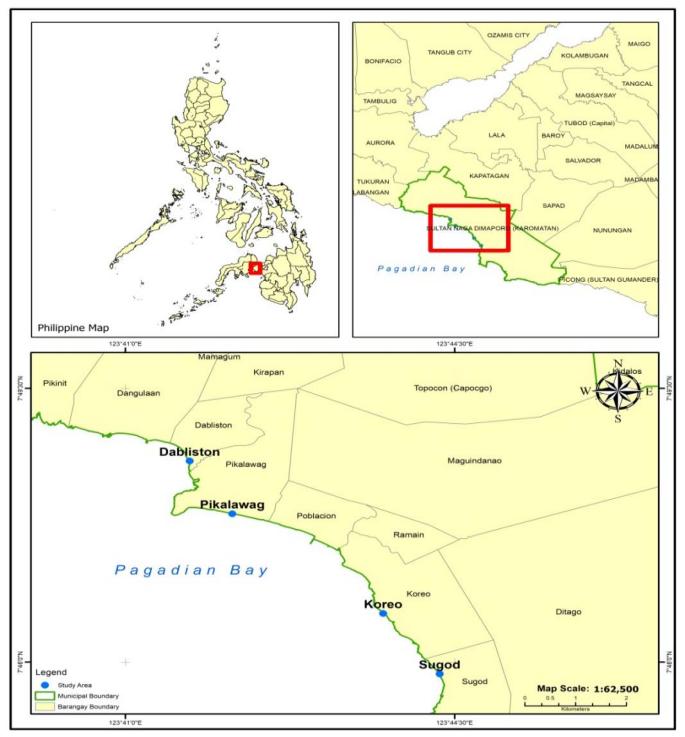
The municipality of Sultan Naga Dimaporo (SND) is located in the province of Lanao del Norte, Philippines. The southeast boundary of SND is the municipality of Picong, Lanao del Sur, and the west part is bounded by barangay Tukuran and Aurora in Zamboanga del Sur. Whereas the southern area of SND includes the connection to one of the known bays in SND which is the Illana Bay, which connects to the famous south sea of the Philippines, the Celebes Sea. With the longest coastline area and high coastal communities in the municipality, it comes with a question for most people as to how much of plastics could end up and submerged in the coastal seabed of SND. Sajorne et al. (2021) reported that 76% of the sandy beaches on the east coast of Puerto Princesa are dirty to extremely dirty. Despite the Philippines being a major producer of plastics to the marine environment, only a few studies have been undertaken to evaluate the scope of the problem (Kalnasa et al. 2019; Paler et al. 2019; Esquinas et al. 2020; Bucol et al. 2020; Inocente and Bacosa, 2022). According to Abreo (2018), the importance of baseline studies on marine plastic litter in varied coastal ecosystems cannot be overstated.
This study was conducted to determine the prevalence of macroplastic litter in the coastal seabed of Sultan Naga Dimaporo. Furthermore, this aims to; (a) determine the density and composition of the plastic waste in the coastal seabed of SND Bay in different areas- the mangrove, beachside, residential, and non-residential areas, and (b) to determine the types of macroplastic found in the coastal seabed of SND in different areas. This study serves as baseline data on the presence of macroplastic in the coastal seabed areas of the municipality of Sultan Naga Dimaporo, Lanao del Norte, Philippines.
2. Methodology
2.1 Study Area
The sampling sites were located along the coastal area of Sultan Naga Dimaporo (SND), Lanao del Norte, Philippines. SND has a total coastal line of almost 30 km. It is also known as Karomatan, a fifth-class municipality and is located in the south-western part of Lanao del Norte with latitude of 7°46'59.99" N and longitude of 123°44'59.99" E (Figure 1). SND is known as the municipality that has the longest coastline in the province. Covering an area of 37, 634 kilometers, it comprises 16 coastal barangays out of the 37 active barangays (Lacuna and Merlas, 2018) with a corresponding total population of 60, 904 (2020 Census, 2021-251). The barangay is the smallest political unit in the Philippines.
2.2 Coastal Seabed Plastic Litter Collection
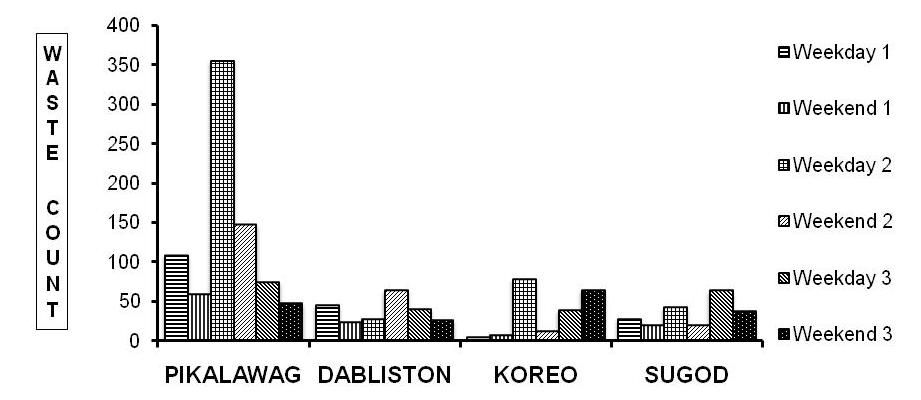
Four sites were identified for the sampling collection (Table 1). The plastic collection was done for six days. It was divided into three weekdays, July 15, 29 and August 12, and three weekends, July 17, 31 and August 14, 2021 (Figure 2).
| SITE | NAME | AREA CLASSIFICATION | COORDINATES |
|---|---|---|---|
| 1 | Pikalawag | Residential Area | 7.8181° N, 123.7127° E |
| 2 | Dabliston | Mangrove Area | 7.8164° N, 123.6917° E |
| 3 | Koreo | Non-residential Area | 7.7932° N, 123.7254° E |
| 4 | Sugod | Beach/Tourism Area | 7.7646° N, 123.7395° E |
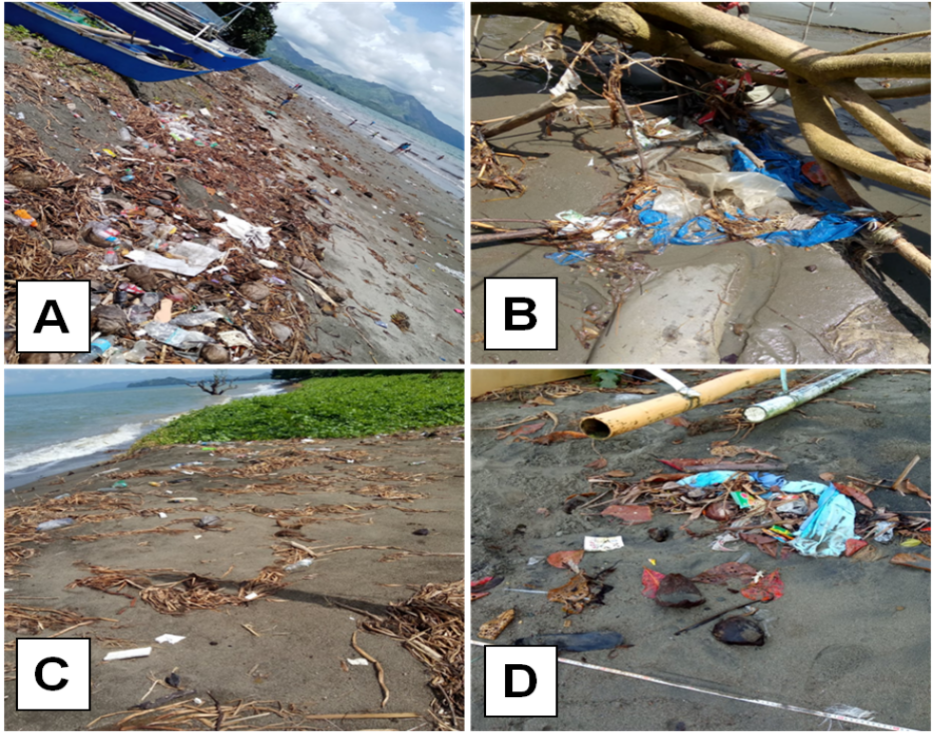
Each area has a 100-meter transect line which was parallel to the seabed, and it was then divided into twenty-five-meter quadrats. Four five-meter quadrats were chosen randomly (with accordance to Lippiat et al. 2013 study) which stands as the area’s focused sites. Coastal width of five meters was measured from the whack line boundary/ high tide line towards the shoreline, hours after the low tide. . Wooden stakes were used to mark the start and finish of each transects, and a GPS position was recorded to allow for repeat sampling during subsequent collection sessions. Every plastic litter that was found in the quadrat were collected, counted, and analyzed based on their category and codes. The plastic litters collected was computed for the clean coast index (CCI) (Alkalay et al. 2007) and tallied for NOAA Marine Debris Monitoring and Assessment Program (MDMAP) Survey Debris Datasheet (Lippiat et al. 2013).
2.3 Coastal Seabed Plastic Litter Category
The plastic litters that were collected in the seabed area were sorted into categories which was modified based on the study of Galarpe (2019) and Syakti (2017): (a) food packaging, (b) disposable utensils (c) food containers (d) cloth, (e) napkin and diapers, (f) ropes, (g) cigarette, (h) plastic fragments, (i) plastic bags, (j) styrofoam, (k) medical waste, (l) sack, and (m) nylon fishing line, (n) footwear, (o) plastic bottle, (p) plastic caps, (q) fishing nets, (r) other bottle containers, (s) disposable lighters, (t) plastic cups (u) straws, (v) toiletries, (w) rubbers, (x) tetra packs, (y) metals, (z) glass, (aa) aluminum, (ab) electronics. After sorting into categories, it was then classified into nine common plastic polymers: polyethylene terephthalate (PET), high-density polyethylene (HDPE), polyvinyl chloride (PVC), low-density polyethylene (LDPE), polypropylene (PP), polystyrene (PS), polyamide (PA), multilayers and others (Martins and Sobral 2011). The total plastic waste collected was then tallied and calculated for a clean coast index (CCI) (Alkalay et al. 2007).
2.4 Data Analysis
2.4.1 Abundance and Density of Plastic litter
The density of the plastic litters collected was computed from the total number of items collected divided by the total sampled area which was expressed in no. of items/m2 as shown in Equation 1. This method was modified from the study of Abreo et al. (2019) and Rahim et al. (2019). For the composition of plastic litter, the use of percent composition was obtained, shown in Equation 2. The same calculation was also performed using the weight of plastic litter collected. This method was also modified from the study of Abreo et al. (2019).
$$ \text{Density Analysis} = {\textit{number of plastic litter} \over m^2} $$
$$ \text{Composition Analysis} = {{\textit{number of items in a category} \over \textit{total number of items in all categories}} \times 100} $$
2.4.2 Clean Coast Index
The Clean-coast index or CCI was suggested as the best tool in evaluating actual coast cleanliness. It measures plastic debris as a criterion for beach cleanliness; this mathematical instrument was an easy way to avoid bias conducted by the assessor (Alkalay et al. 2007). With this analysis, the total plastic litters collected in the study were calculated with CCI evaluation, as a representative to qualitatively identify the coastal cleanliness per site. The CCI was calculated as shown in Equation 3:
$$ \text{CCI} = \left({ \textit{Total number of plastic items on transect} \over \textit{Total area of transect} }\right) \times K $$
For a statistical reason, the coefficient of k = 20 was inserted in the equation as a multiplier to ensure that the generated value from the equation will not fall into zero or between 0 and 1. Then the final CCI numbers and coast grade index are as follows: 0–2: VERY CLEAN — which indicates that no litter was seen; 2–5: CLEAN — indicating no litter was seen over a large area; 5–10: MODERATE — a few pieces of litter can be detected; 10–20: DIRTY — a lot of debris on the shore; and 20+: EXTREMELY DIRTY — most of the beach was covered with plastic debris (Vlachogianni et al. 2018).
2.4.3 Statistical analysis
The data gathered were statistically analyzed using the PAST software (Hammer et al. 2001). A one-way analysis of variance (ANOVA) test was used in identifying the significant differences between the four coastal seabeds. Data were analyzed for a normality test, and to compare the means, the Post Hoc test (Tukey's test) was used. The means of waste collected during the weekdays and weekends were compared using t-test. The density (items/m2) ± SD was calculated, and values were evaluated as significantly different at p < 0.05.
3. Results and Discussion
3.1 Macroplastic Study
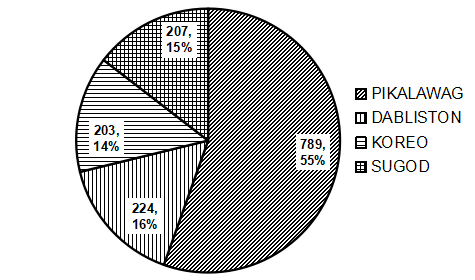
A total of 1,423 plastic litter items were collected in all four study sites during the 6 days of sampling in which 55% were from Pikalawag followed by Dabliston, Sugod, and Koreo with 16%, 15%, and 14%, respectively. (Figure 3).
Notably, the number of plastic wastes did not decrease through time (Figure 4). Higher numbers of plastics were observed in many sites in succeeding sampling. For example, three times more plastics were collected during the third sampling in Pikalawag compared to the first sampling. Similarly, in Koreo, from 4 pieces of plastics collected during the first day, the total waste collected increased to 64 during the last sampling. This observation can be attributed to two possible factors; the first one was human factor. Pikalawag, a residential area has the highest overall waste collected, mainly due to the behaviours of residents towards plastic waste. This finding is consistent with Sajorne et al. (2021) who found that the residential areas in Puerto Princesa, Palawan have 2-5 time more plastic waste compared to non-residential sites. In terms of population in SND, Pikalawag is ranked 2nd with 6.82% of the total population in SND, Dabliston as 5th with 4.14%, then 8th Koreo of 3.34% and Sugod with 1.83% ranked 24. The second factor is seasonal changes. According to the locals, the southwest monsoon or “habagat” season, which commonly falls during the last week of May or the middle of June to September were particularly the season where most waste drifts in the shore of SND. Hence, the waste results for the 3rd and 4th day sampling were heavy rainfall and winds were happening in the area. Heavy rainfall and flooding can carry plastics waste from the upland terrestrial environment through the canals and rivers that ends up in the ocean (Requiron and Bacosa, 2022). According to Galgani et al. (2000) submarine geomorphology, geographical settings, hydrodynamics, and bathymetric stratification all have a role in plastic dispersion on the coastal seabed/seafloors. It was well known that plastics can be transported to remote places through currents, tides, and even the climate (Galgani et al. 2013).
A total of 30 waste classifications were used in this study. Overall results show that 17% were food packaging followed by plastic fragments (16%) and plastic bags (11%) (Figure 5). The results agree with previous studies (Paler et al. 2019; Kalnasa et al. 2019; Esquinas et al. 2020 and Sajorne et al. 2021) where it was found that the most prevalent plastic waste in any nation with high levels of poverty, like the Philippines, are sachets and other food packaging which were locally available and can easily be purchased.
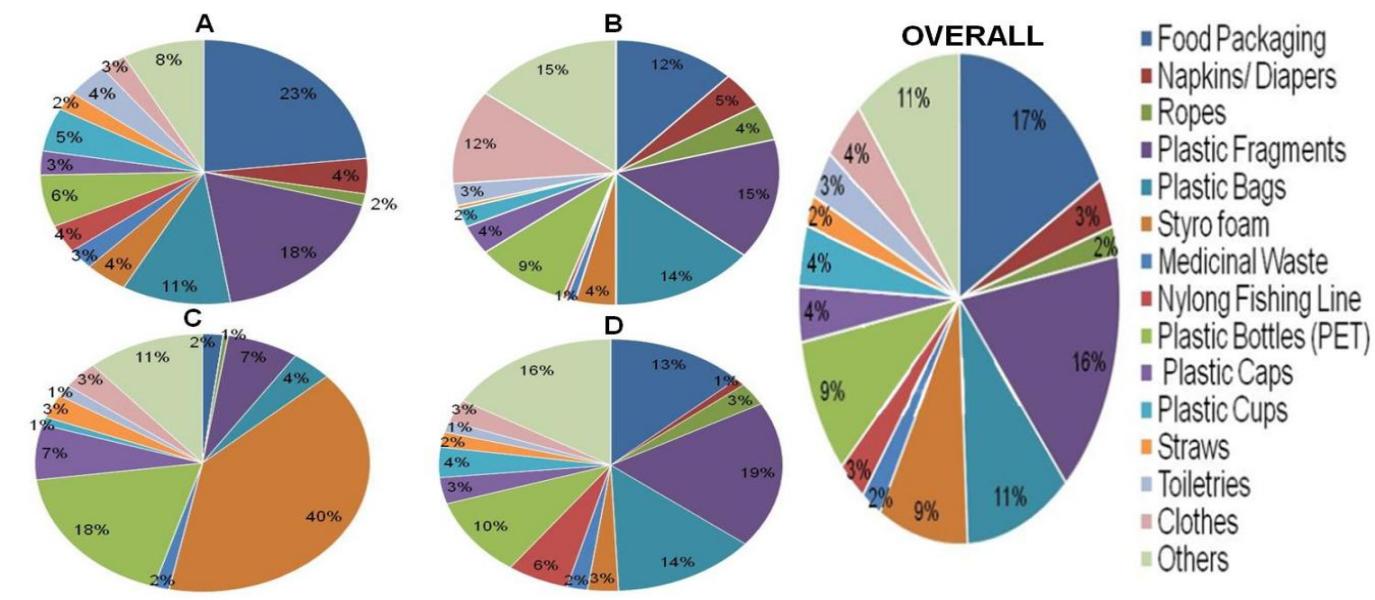
There is variability in the waste composition of the sites. For example, food packing was 23% of the total waste in Pikalawag, a residential area while only 4% in Koreo, a non-residential area. On the other hand, styrofoams were only 4% in Pikalawag while 40% in Koreo. Plastic fragments both in Dabliston (15%), a mangrove area, and Sugod (19%), a beach/tourism area was also the highest. Araújo et al. (2018) speculated that these plastic fragments in the coastal areas may be thrown or carried by the waves in the ocean for a long period of time which then fragmented into smaller sizes.
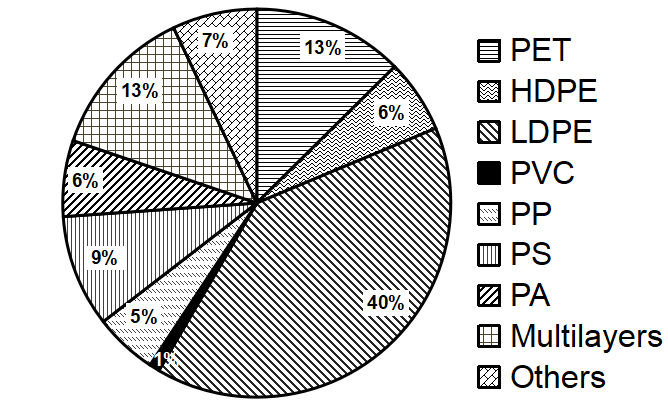
The plastics collected were then classified into nine polymer types. These are the polyethylene terepthalate (PET), high-density polyethylene (HDPE), low-density polyethylene (LDPE), polyvinyl chloride (PVC), polypropylene (PP), polystyrene (PS), polyamide (PA), multilayers and others. Results shows that the dominant plastic waste found in all sites were LDPE at 40% followed by multilayers and PET both of 13%. The least polymer classified was PVC of 1% (Figure 6). However, it was identified that PE, PP and PS, where plastics and polystyrene foam comprises 90%, as the most dominant plastic polymers found in the coastal environment (Pabortsava et al. 2020. and SLO active, 2021).
3.2 Density of Plastic litter and Clean Coast Index
With the results gathered it was found that all sampling sites were polluted with plastic waste. Pikalawag leads the highest plastic density (1.32/m2) of all four sites. Density analysis results show that Pikalawag was significantly higher (p < 0.05) than that of Dabliston (0.37/m2), Koreo (0.34/m2) and Sugod (0.35/m2).
Computed CCI of the four sites shows that Pikalawag was an extremely dirty coast, whereas Dabliston, Koreo, and Sugod fall under the moderately clean coast (Table 2).
| SITE | CLASSIFICATION (Area) | Total Mass (g/site) | Total Litter Count | Density/m2 ± SD | CCI | Coast Grade |
|---|---|---|---|---|---|---|
| Pikalawag | Residential | 21,438.2 | 789 | 1.32 ± 1.05a | 25.2 | Extremely Dirty |
| Dabliston | Mangrove | 10,146.9 | 224 | 0.37 ± 0.16b | 7.5 | Moderately Clean |
| Koreo | Non-residential | 2,489.3 | 203 | 0.34 ± 0.32b | 6.8 | Moderately Clean |
| Sugod | Beach/Tourism | 3,787.72 | 207 | 0.35 ± 0.17b | 6.9 | Moderately Clean |
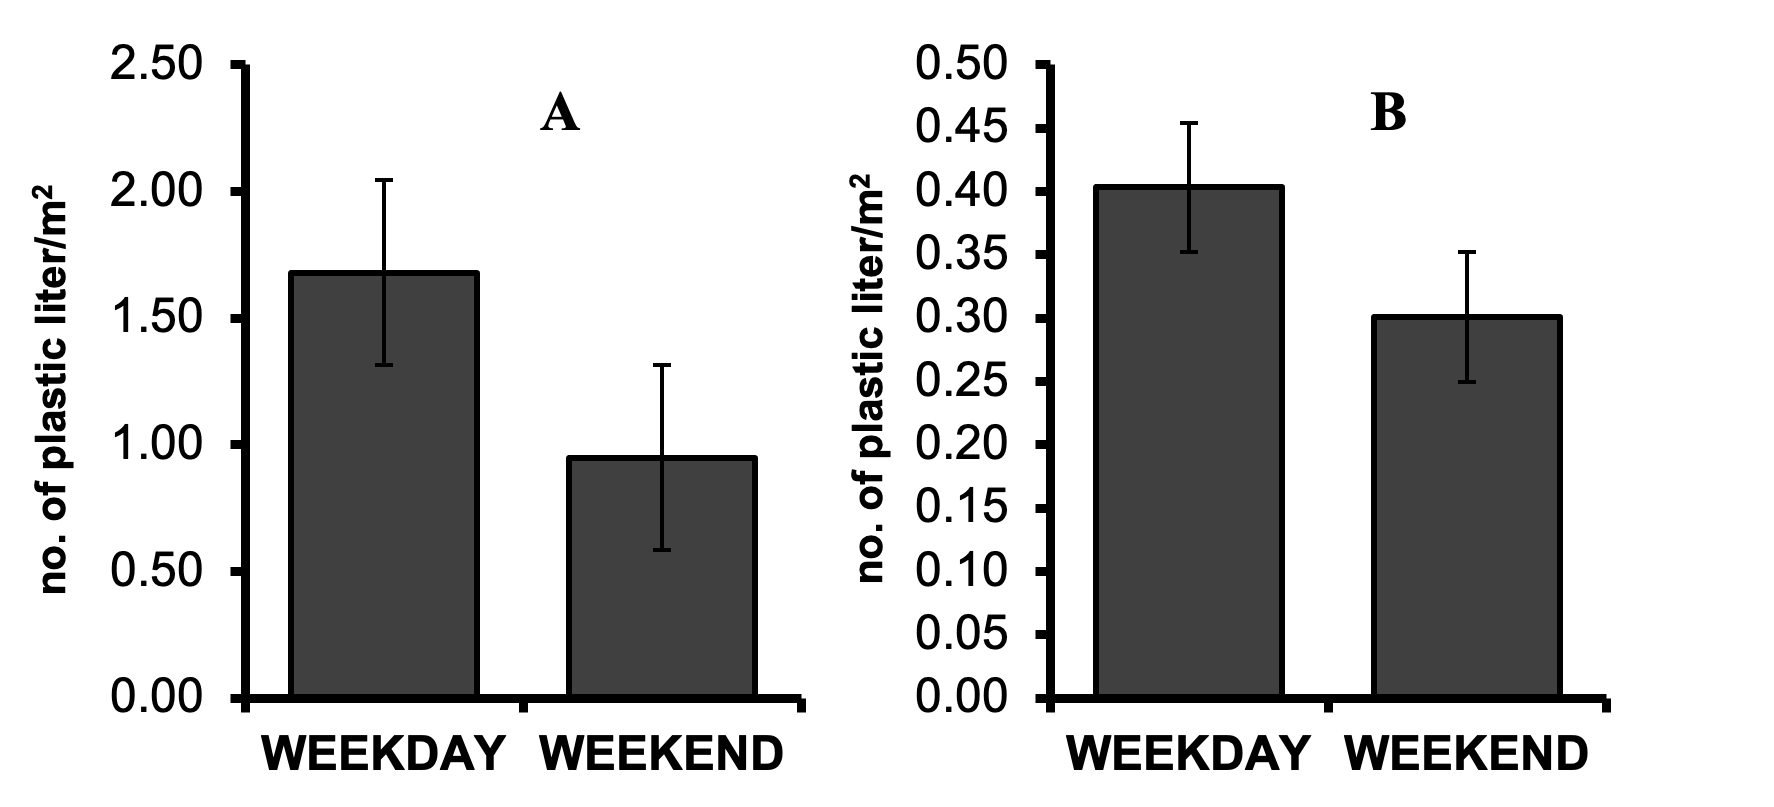
Figure 7 shows that the plastic density collection was higher during the weekday compared to the weekend. However, t-test analysis revealed that there was no significant difference between the weekday and weekend of Pikalawag (p ≥ 0.05), and the weekend and weekdays of other three sites combined (p ≥ 0.05).
Pikalawag was predominant in waste density since it is a residential area and accordingly as the population of a certain area grows so will the demand for consumable products, which will eventually turn into plastic trash (Alabi et al. 2019). The second was Dabliston which is a mangrove area, and according to van Bijsterveldt et al. (2021), in their field study, plastics were significantly found covering most of a mangrove’s forest floor in certain spots of their field where plastics were commonly hidden in the sediment's higher layers. This result would indicate that plastics would have a direct and indirect harmful impact on the mangrove environment (Suyadi & Manullang 2020). Sugod, which has an emerging beach/tourism site; where plastic waste was also highly increasing. According to Gössling (2002); Biubwa et al. (2014); and Jang et al. (2014), tourism sites may serve as a waste-producing areas. Lastly was Koreo with the least plastic waste density. Since non-residential areas are less frequented than residential ones, the amount of plastic litter produced was limited (Alabi et al. 2019), rather the waste found and collected in the area was mainly due to the waste brought by the wind and wave currents.
4. Conclusion and Recommendation
This study revealed how plastic litter density and composition vary in different coastal areas in SND, Lanao del Norte. Overall, a total of 1,423 waste counts were collected during the 6 non-consecutive days of sampling in 4 sites of SND. Pikalawag, a residential site has 55% of the total waste collected and can be classified as extremely dirty based on clean-coast index. Dabliston a mangrove area, Koreo a non-residential area, and Sugod a beach area were all classified as moderately clean beaches. The types of plastics litters collected were predominantly food packaging (17%), plastic fragments (16%), and plastic bags (11%), which results to LDPE (40%), multilayers (13%), and PET (13%) as the highest polymer type categorized. This is the first study detailing plastic pollution in coastal areas with different characteristics in Lanao del Norte.
This study was conducted during the COVID-19 pandemic, which adds to the limitations of the study. Recommended survey frequency from UNEP is at least every 30 months, while for NOAA is every 28 days ± 3 days (Lippiat et al. 2013). Moreover, Eriksson et al. (2013) further suggested that a 12-day consecutive sampling period at a specific location may yield more useful results than a year's worth of monthly surveys. However, the collection time of this study is particularly limited to six non-consecutive days, due to the time frame limit given to the researcher, which limits the results of the study. Moreover, the results of the marine debris monitoring survey were conducted at specific times of the year, so care must be taken in interpreting them as a universal phenomenon in this area. Hence, it is highly recommended that future research will be done, such as the monitoring of plastic debris commonly found and collected in the area for a much longer period of time.
However, the current data show specific plastic accumulation from the coastal communities, which could serve as a foundation for future plastic waste management policies and initiatives. Hence these results will strengthen and enhance the local government unit in the municipality of Sultan Naga Dimaporo towards their solid waste management ordinances and policies in these coastal areas. The lack of regular and improper waste collection will serve as a suitable starting point for addressing this plastic waste issue. The present study is preliminary and provides the baseline status of macroplastic litter in the different coastal areas of Sultan Naga Dimaporo, Lanao del Norte.
5. Acknowledgements
The researcher would like to extend her genuine appreciation to the different personalities and organizations that helped make this research a success. To the Department of Science and Technology – Science Education Institute (DOST-SEI) through the Accelerated Science and Technology Human Resource Development Program (ASTHRDP) scholarship program and research funds that made this study possible. The author would also like to thank her colleagues Sherley Ann Inocente, Shiela Mae Gaboy, Judea Requiron, Joseph Pacilan, Maribeth Pacilan, Sarahlyn Pacilan, Justinmae Macas, Lea Macas, Belinda Paragoso, Veronica Tañan, and Ralf Benjo Morilla for the support all throughout the study analysis and sampling period.
References
- Abreo, N.A.S., 2018. Marine plastics in the Philippines: a call for research. Philippine Science Letters, 11, 20–21.
- Abreo, N.A.S., Siblos, S.K., Macusi, D., 2019. Anthropogenic marine debris (AMD) in mangrove forests of Pujada Bay, Davao Oriental, Philippines. Journal of Marine and Island Cultures. doi: 10.21463/jmic.2020.09.1.03. Page 44-53.
- Acot, F.T., Sajorne, R.E. Omar, N.A.K., Suson, P.D., Rallos, L.E.E., Bacosa, H.P., 2022. Unraveling macroplastic pollution in rural and urban beaches in Sarangani Bay Protected Seascape, Mindanao, Philippines. Journal of Marine Science and Engineering. 2022; 10(10):1532. doi: 10.3390/jmse10101532
- Alabi, O.A., Ologbonjaye, K.I., Awosolu, O., Alalade, O.E., 2019. Public and environmental health effects of plastic wastes disposal: a review. Journal of Toxicology and Risk Assessment 5 (2), 1–13. doi: 10.23937/2572-4061.1510021
- Alkalay, R., Pasternak, G., Zask, A., 2007. Clean-coast index; a new approach for beach cleanliness assessment. Ocean Coastal Management, 50, 352-362. doi: 10.1016/j.ocecoaman.2006.10.002
- Araújo, M.C.B., Silva-Cavalcanti, J.S., Costa, M.F., 2018. Anthropogenic litter on beaches with different levels of development and use: a snapshot of a coast in Pernambuco (Brazil). Frontier in Marine Science 5, 233. doi: 10.3389/fmars.2018.00233
- Banet, C. (January 2020). The Law of Seabed. Access, Uses, and Protection of Seabed Resources. E-Book ISBN: 9789004391567. Publications on Ocean Development,Volume:90. doi: 10.1163/9789004391567_002
- Biubwa, A., Sharifah, N., S., I., & Irniza, R., 2014. Municipal solid waste management of Zanzibar: Current practice, the challenges and the future. International Journal of Current Research and Academic Review, 1, 5-19.
- Bucol, L.A., Romano, E.F., Cabcaban, S.M., Siplon, L.M.D., Madrid, G.C., Bucol, A.A., Polidoro, B., 2020. Microplastics in marine sediments and rabbitfish (Siganus fuscescens) from selected coastal areas of Negros Oriental, Philippines. Marine Pollution Bulletin, 150, 110685. doi: 10.1016/j.marpolbul.2019.110685
- Eriksson, C., H. Burton, et al. (2013). Daily accumulation rates of marine debris on subAntarctic island beaches." Marine Pollution Bulletin 66(1–2), 199-208. doi:10.1016/j.marpolbul.2012.08.026
- Escañan, A.S. and Bacosa, H.P., 2022. Assessment of riverine plastic flux in Pulot River and its tributary in Sofronio Española, Palawan, Philippines. Journal of Marine and Island Cultures. (accepted)
- Esquiñas, G.G.M.S., Mantala, A.P., Atilano, M.G., Apugan, R.P., Galarpe, V.R.K.R., 2020. Physical characterization of litter and microplastic along the urban coast of Cagayan de Oro in Macajalar Bay, Philippines. Marine Pollution Bulletin, 154, 111083. doi:10.1016/j.marpolbul.2020.111083
- Gaboy, S.M., Guihawan, J.Q., Leopardas, V.M., Bacosa, H.P., 2022. Unravelling macroplastic pollution in seagrass beds of Iligan City, Mindanao, Philippines. Marine Pollution Bulletin, 185, 114233. doi: 10.1016/j.marpolbul.2022.114233
- Galarpe, K.R., Kalnasa, M.L., Lantaca, S.M.O., Boter, L.C., Flores, G.H.T., 2019. Occurrence of surface sand microplastic and litter in Macajalar Bay, Philippines. Marine Pollution Bulletin, 149, 110521. doi:10.1016/j.marpolbul.2019.110521
- Galgani, F., Leaute, J.P., Moguedet, P., Souplet, A., Verin, Y., Carpentier, A., Goraguer, H., Latrouite, D., Andral, B., Cadiou, Y., Mahe, J.C., Poulard, J.C., Nerisson, P., 2000. Litter on the sea floor along European coasts. Marine Pollution Bulletin, 40, 516–527. doi: 10.1016/S0025-326X(99)00234-9
- Galgani, F., Hanke, G., Werner, S., Oosterbaan, L., Nilsson, P., Fleet, D., Kinsey, S., Thompson, R.C., van Franeker, J., Vlachogianni, T., Scoullos, M., Veiga, J.M., Palatinus, A., Matiddi, M., Maes, T., Korpinen, S., Budziak, A., Leslie, H., Gago, J., Liebezeit, G., 2013. Guidance on Monitoring for Marine Litter in European Seas. MSFD Technical Subgroup on Marine Litter (TSG-ML). European Commission. Joint Research Centre Scientific and Policy, Institute for Environment and Sustainability Reports 2013.
- Gössling, S., 2002. Human–environmental relations with tourism. Annals of Tourism Research, 29(2), 539-556. doi:10.1016/S0160-7383(01)00069-X
- Hammer, J., Kraak, M.H., Parsons, J.R., 2012. Plastics in the marine environment: the dark side of a modern gift. Reviews of Environmental Contamination and Toxicology, 220,1-44. doi: 10.1007/978-1-4614-3414-6_1
- Hammer, Ø., Harper, D., & Ryan, P., 2001. PAST: Paleontological Statistics Software Package for Education and Data Analysis. Palaeontologia Electronica. Palaeontological Association, 22 June 2001.
- Inocente, S.A., and Bacosa, H., 2022. Assessment of marine plastic pollution in selected tourism beaches of Barobo, Surigao del Sur, Philippines. Journal of Marine and Island Cultures, v11n1. doi:10.21463/jmic.2022.11.1.14
- IUCN. 2018.Marine plastic: Issues and brief. https://www.iucn.org/sites/dev/files/ marine_plastics_issues_brief_final_0.pdf. Page 1-2.
- Jambeck, J.R., Andrady, A., Geyer, R., Narayan, R., Perryman, M., Siegler, T., Wilcox, C., Lavender Law, K., 2015. Plastic waste inputs from land into the ocean, Science, 347 (6223), 768-771. doi:10.1126/science.12603
- Jang, Y. C., Hong, S., Lee, J., Lee, M. J., & Shim, W. J., 2014. Estimation of lost tourism revenue in Geoje Island from the 2011 marine debris pollution event in South Korea. Marine Pollution Bulletin, 81(1), 49–54. doi:10.1016/j.marpolbul.2014.02.021
- Kalnasa, M. L., Lantaca, S. M. O., Boter, L. C., Flores, G. J. T., & Galarpe, V. R. K. R., 2019. Occurrence of surface sand microplastic and litter in Macajalar Bay, Philippines. Marine Pollution Bulletin, 149, 110521. doi:10.1016/j.marpolbul.2019.110521
- Kibria, G. 2018. Plastic Pollution Sources, Global Production, Global Hoot Spots, Impacts on Biodiversity & Seafood, Adsorption of Organic & Inorganic Chemicals, and Mitigation. doi:10.13140/RG.2.2.35028.24967 https://www.researchgate.net/publication/327230697_Presentation_Plastic_ Waste_Plastic_Pollution-_A_Threat_to_All_Nations
- Lacuna, M.L.D., Merlas, G., 2018. Macrobenthic fauna on the rocky intertidal shore of Sultan Naga Dimaporo, Lanao Del Norte, Mindanao, Philippines. International Journal of Biology, Pharmacy and Allied Sciences (IJBPAS). 7(9), 1675-1685.
- doi:10.31032/IJBPAS/2018/7.9.4523
- Lippiatt, S., Opher, S., Arthur, C., 2013. NOAA Marine Debris Shoreline Survey Field Guide. National Oceanic and Atmospheric Administration. https://www.MarineDebris.noaa.gov
- Martins, J., Sobral, P., 2011. Plastic marine debris on the Portuguese coastline: a matter of size? Marine Pollution Bulletin 62 (12), 2649–2653. doi:10.1016/j.marpolbul.2011.09.028
- Meijer, L. van Emmerik, T., van der Ent, R., Schmidt, C., Lebreton, L., 2021. More than 1000 rivers account for 80% of global riverine plastic emissions into the ocean. Science Advances, 7, aaz5803. doi:10.1126/sciadv.aaz5803
- Navarro, C.K.P.; Arcadio, C.L.A.; Similatan, K.M.; Inocente, S.A.T.; Banda, M.H.T.; Capangpangan, R.Y.; Torres, A.G.; Bacosa, H.P. Unraveling microplastic pollution in mangrove sediments of Butuan Bay, Philippines. Sustainability 2022, 14, 14469.
doi: 10.3390/su142114469 - North, E.J., Halden, R.U., 2013. Plastics and environmental health: the road ahead. Reviews on Environmental Health, 28, 1–8. doi:10.1515/reveh-2012-0030
- Onda, D.F., Gomez, N.C., Purganan, D.J., Tolentino, M.P., Bitalac, J.M., Calpito, J.V., Perez, J.N., Viernes, A.C., 2019. Marine microbes and plastic debris: research status and opportunities in the Philippines. Philippine Journal of Science, 149 (1), 71-82.
- Pabortsava, K., Lampitt, R. S., 2020. High concentrations of plastic hidden beneath the surface of the Atlantic Ocean. Nature Communications, 11(1), 4073. doi: 10.1038/s41467-020-17932-9
- Paler, M. K. O., Malenab, M. C. T., Maralit, J. R., Nacorda, H. M., 2019. Plastic waste occurrence on a beach off southwestern Luzon, Philippines. Marine Pollution Bulletin, 141, 416–419. doi: 10.1016/j.marpolbul.2019.02.006
- Plastics Europe. Plastics—the Facts 2019. An Analysis of European Plastics Production, Demand and Waste Data; PlasticsEurope: Brussels, Belgium, 2019.
- Plastics Europe, 2020. Plastics – the Facts 2020. An Analysis of European Plastics Production, Demand and Waste Data for 2020 (12.10.2020) https://issuu.com/plasticseuropeebook/docs/plastics_the_facts-web-dec2020
- Rahim S., Widayati W., Analuddin K., Saleh, F., Alfirman, Safruddin, S., 2019. Spatial distribution of marine debris pollution in mangrove-estuaries ecosystem of Kendari Bay. IOP Conference Series: Earth and Environmental Science 412, 012006.
- Requiron, J.C. and Bacosa, H., 2022. Macroplastic transport and deposition in the environs of Pulauan River, Dapitan City, Philippines. Philippine Journal Science. 151 (3), 1211-1220.
- Sajorne, R., Bacosa, H., Cayabo, G.D., Ardines, L.JR., Sumeldan, J. Omar, J. and Creencia, L., 2021. Plastic litter pollution along sandy beaches in Puerto Princesa, Palawan Island, Philippines. Marine Pollution Bulletin. 169, 112520. doi:10.1016/j.marpolbul.2021.112520
- Sajorne, R. E., Cayabo, G. D. B., Madarcos, J. R. V., Madarcos, K. G., Omar Jr, D. M., Ardines, L. B., ... & Bacosa, H. P., 2022. Occurrence of COVID-19 personal protective equipment (PPE) litters along the eastern coast of Palawan Island, Philippines. Marine Pollution Bulletin, 182, 113934. doi: 10.1016/j.marpolbul.2022.113934
- Schwarz, A.E., Ligthart, T.N., Boukris, E., van Harmelen, T., 2019. Sources, transport, and accumulation of different types of plastic litter in aquatic environments: a review study. Marine Pollution Bulletin, 143, 92-100. doi:10.1016/j.marpolbul.2019.04.029
- Sea Circular (April 2020). Sea Circular Country Profile: The Philippines. https://www.sea-circular.org/wp-content/uploads/2020/04/SEA-circular-Cou ntry-Briefing_THE-PHILIPPINES.pdf
- Sea Circular (June 2020). Perceptions on Plastic Waste. Insights, Interventions, and Incentives to action from Businesses and Consumers in South-East Asia. https://www.sea-circular.org/wp-content/uploads/2020/06/PERCEPTIONS- ON-PLASTIC-WASTE_FINAL.pdf
- Shiu, R.F., Chiu, M.H., Vazquez, C.I., Tsai, Y.Y., Le, A., Kagiri, A., Xu, C., Kamalanathan, M., Bacosa, H.P., Doyle, S.M., Sylvan, J., Santschi, P., Quigg, A., Chun, W-C., 2020. Protein to carbohydrate (P/C) ratio changes in microbial extracellular polymeric substances induced by oil and Corexit. Marine Chemistry. 223; 103789. doi: 10.1016/j.marchem.2020.103789
- SLO active., 2021. Plastic Pollution. The impact of plastic pollution on our oceans and what we can do about it. https://sloactive.com/plastic-pollution/
- Sumeldan, J.D.C., Richter, I., Avillanosa, A.L., Bacosa, H.P., Creencia, L.A., Pahl, S., 2021. Ask the locals: A community-informed analysis of perceived marine environment quality over time in Palawan, Philippines. Frontier in Psychology 12, 661810. doi: 10.3389/fpsyg.2021.661810
- Suyadi, and Manullang, C.Y. 2020. Distribution of plastic debris pollution and it is implications on mangrove vegetation. Marine Pollution Bulletin 160, 111642. doi:10.1016/j.marpolbul.2020.111642
- Syakti, A.D., Bouhroum, R., Hidayati, N.V., Koenawan, C.J., Boulkamh, A., Sulisyo, I., Lebarillier, S., Akhulus, S., Doumeq, P., Wong-Wah-Chung, P., 2017. Beach macrolitter monitoring and floating microplastic in a coastal area of Indonesia. Marine Pollution Bulletin 122 (1–2), 217–225. doi: 10.1016/j.marpolbul.2017.06.046
- van Bijsterveldt, C., Wesenbeeck, B., Ramadhani, S., Raven, O., Gool, F., Pribadi, R., Bouma, T., 2020. Does plastic waste kill mangroves? A field experiment to assess the impact of macro plastics on mangrove growth, stress response and survival. Science of the Total Environment 756, 143826. doi:10.1016/j.scitotenv.2020.143826.
- Vlachogianni, T., Fortibuoni, T., Ronchi, F., Zeri, C., Mazziotti, C., Tutman, P., VareziV, D.B., Palatinus, A., Trdan, Š d Peterlin, M., Mandi, M. et al,, 2018. Marine litter on the beaches of the Adriatic and Ionian Seas: an assessment of their abundance, composition and sources. Marine Pollution Bulletin 131, 7451, 74. doi:10.1016/j.marpolbul.2018.05.006
- World Bank Group. 2021. Market Study for the Philippines : Plastics Circularity Opportunities and Barriers. East Asia and Pacific Region Marine Plastics Series;. World Bank, Washington, DC. © World Bank. https://openknowledge.worldbank.org/handle/10986/35295 License: CC BY 3.0 IGO.
- 2020 Census of Population and Housing (2020 CPH) Population Counts Declared Official by the President. Philippines Statistics Authority (PSA). Region X. Reference Number: 2021-251