Assessment of riverine plastic flux in Pulot River and its tributary in Sofronio Española, Palawan, Philippines
Abstract
The Philippines is the world’s third major contributor to global marine plastic pollution and the biggest polluter of riverine plastics into the sea. Several rivers in Philippines including those in Palawan, the country’s Last Frontier, are assumed to be the main pathways of land-based plastic waste into the ocean. However, variations, model estimations and plastic litter’s composition among rivers remains uncertain due to lack of field data. In this regard, the quantity, temporal variations and composition of plastic flux were studied in Pulot River and its tributary in Sofronio Española, Palawan. This aims to collect field data on floating macroplastics and its composition, as well as to determine the effect of flow velocity to plastic flux. Plastic flux was measured at three different locations along Pulot River, two hourly measurements during two different time of the day was made. The results showed significant difference on the amount of plastic flux during the morning and afternoon measurements. On the other hand, plastic flux during the weekends and weekdays measurements showed no significant difference. Instantaneous plastic flux and flow velocity showed significant positive correlation at all locations for all periods of measurements except the Pulot River Bridge during morning. Predominant plastic types are food packaging, plastic bottles, and toiletries. Multilayers and mixed plastics under the “Other” category were the most abundant plastic polymer classified. These results provide new insights on variations and prevalence of plastic flux in Pulot River which may benefit future long-term monitoring efforts and plastics pollution mitigation strategies.
Keywords
temporal variations, flow velocity, macroplastic
1. Introduction
Pollution of plastics in aquatic environments is rising global environmental threat (van Emmerick and Schwarz 2020), for according to studies since the industry of plastics began in early 1900s the annual global plastic production has exploded from 1.5 million metric tons to 359 million metric tons in 2018 (Statista 2020). Direct negative effects of these plastics in freshwater ecosystems includes entanglement of aquatic life, economic losses through damage to vessels, and increased flood risk in urban areas through clogging of hydraulic structures (Thompson et al. 2004; Lebreton and Andrady 2019; van Emmerick and Schwarz 2020). Large amount of mismanaged plastic has been found in rivers, which is assumed as main pathways of marine anthropogenic litters (Schmidt et al. 2017). These plastic wastes eventually break down into microplastics, which are later ingested by aquatic organisms and faunas, furthermore threatens the biodiversity (Lasut et al. 2018; Abreo et al. 2019; van Emmerick et al. 2020b). As a consequence, combined with insufficient waste management and handling practices, plastic debris is present in all ecosystems, including remote locations, therefore considering plastic pollution as global tragedy adversely affecting marine and aquatic organisms as well as human alike.
The Philippines’ riverine plastic pollution is in alarming condition. Recent studies show that the Philippines is assumed to have the highest national plastic emission in the world with 4,820 rivers emitting 356,371 metric tons of plastics from rivers into the marine environment (Meijer et al. 2021). The Province of Palawan, which is considered as the country’s Last Ecological Frontier and tourism hub, has been experiencing pollution of coastal environment mainly driven by terrestrial inputs (Cayabo et al. 2021; Sajorne et al. 2021; Sumeldan et al. 2021). Rivers traversing in populated urban areas such as those in Palawan, are expected to contribute high amounts of plastics wastes from land into the ocean. Study in plastic litter pollution along sandy beaches in Puerto Princesa in Palawan Island Philippines, for example, demonstrated that 76% of the sites sampled in the east and west coast were categorized as dirty to extremely dirty based on Clean Coast Index (Sajorne et al. 2021). Although several studies suggest the importance of rivers as primary pathways of marine pollution, field data of plastic transport and abundance, model estimations and types of anthropogenic litters from contributing rivers are scarce.
In recent years the prevalence and transport of land-based plastic waste remain understudied, but riverine plastic pollution is an increasing field. Previous studies on the litter situation in riverine locations provide initial indications of the underlying processes, but we are still far from the general understanding of the overall patterns of sources, transport and distribution of such litter. The challenge is to reduce the amount of all kinds of plastics in rivers in the world. However, this is only possible when we know how much plastics are actually present in the rivers. To achieve this aim, we need data and that is why monitoring is crucial in attacking the original problem.
One of the unknowns to date is the temporal variation of river plastic transport (van Emmerick et al. 2019c). Study suggested that there might be a considerable difference in plastic transport in different times (Moore et al. 2011; van Emmerick et al. 2019c). The increased in the number of studies focusing on quantifying macroplastics abundance in rivers, demonstrated that the magnitude, temporal variations and typical composition of riverine plastics varies between rivers (van Calcar and van Emerick 2019). Identification of plastics composition is also essential to determine the potentials sources of plastic waste, and transport mechanisms from land into river systems (van Emmerick et al. 2020b). A better understanding and characterization of riverine plastic flux are necessary to effectively implement mitigation and prevention strategies.
Results of a ten consecutive days of field assessment between the 04 June 2021 and 13 June 2021 for plastic flux and plastic composition at three locations along Pulot River and its tributary in Sofronio Española, Palawan Philippines has been presented in this study. We focus on studying the variation of plastic transported through time. Furthermore, this study specifically discusses the effect of flow velocity on the transport of plastics in Pulot River and its tributary. With this paper, we aim to quantify the amount and composition of plastics transported in Pulot River through time. The observational informations presented in this paper provides insights in the temporal variations on plastic flux in Pulot River and its tributary.
2. Methodology
2.1 Study Site
The Municipality of Sofronio Española is located in Southern Palawan along its eastern seaboard, beginning at kilometer 128.1 to kilometer 166 of the National Highway (Puerto Princesa City, South Road). It lies approximately between 8 53’3.58” to 9 11’26.26” North and 117 51’24.42” to 118 7’35.58” East (Figure 1). The number of residents in Espanola steadily increased from 32, 876 in 2015 to 37, 416 in 2020. The Pulot watershed is the sole delineated catchment area or watershed in the municipality. It occupies a total area of 18,158 hectares, of which 17,186 hectares are within the territory of Española. Pulot River spans 15 km of winding natural water channel from Pulot watershed, it is one of the major rivers in Sofronio Espanola that runs through the town center. Three measurement location has been selected, two from the major river (Pulot Center Bridge and Pulot Shore Bridge), and one from its tributary (Malalong Bridge) for plastic flux transport in the river. All locations are distant from the river mouth hence we disregard tidal influence (Figure 1).
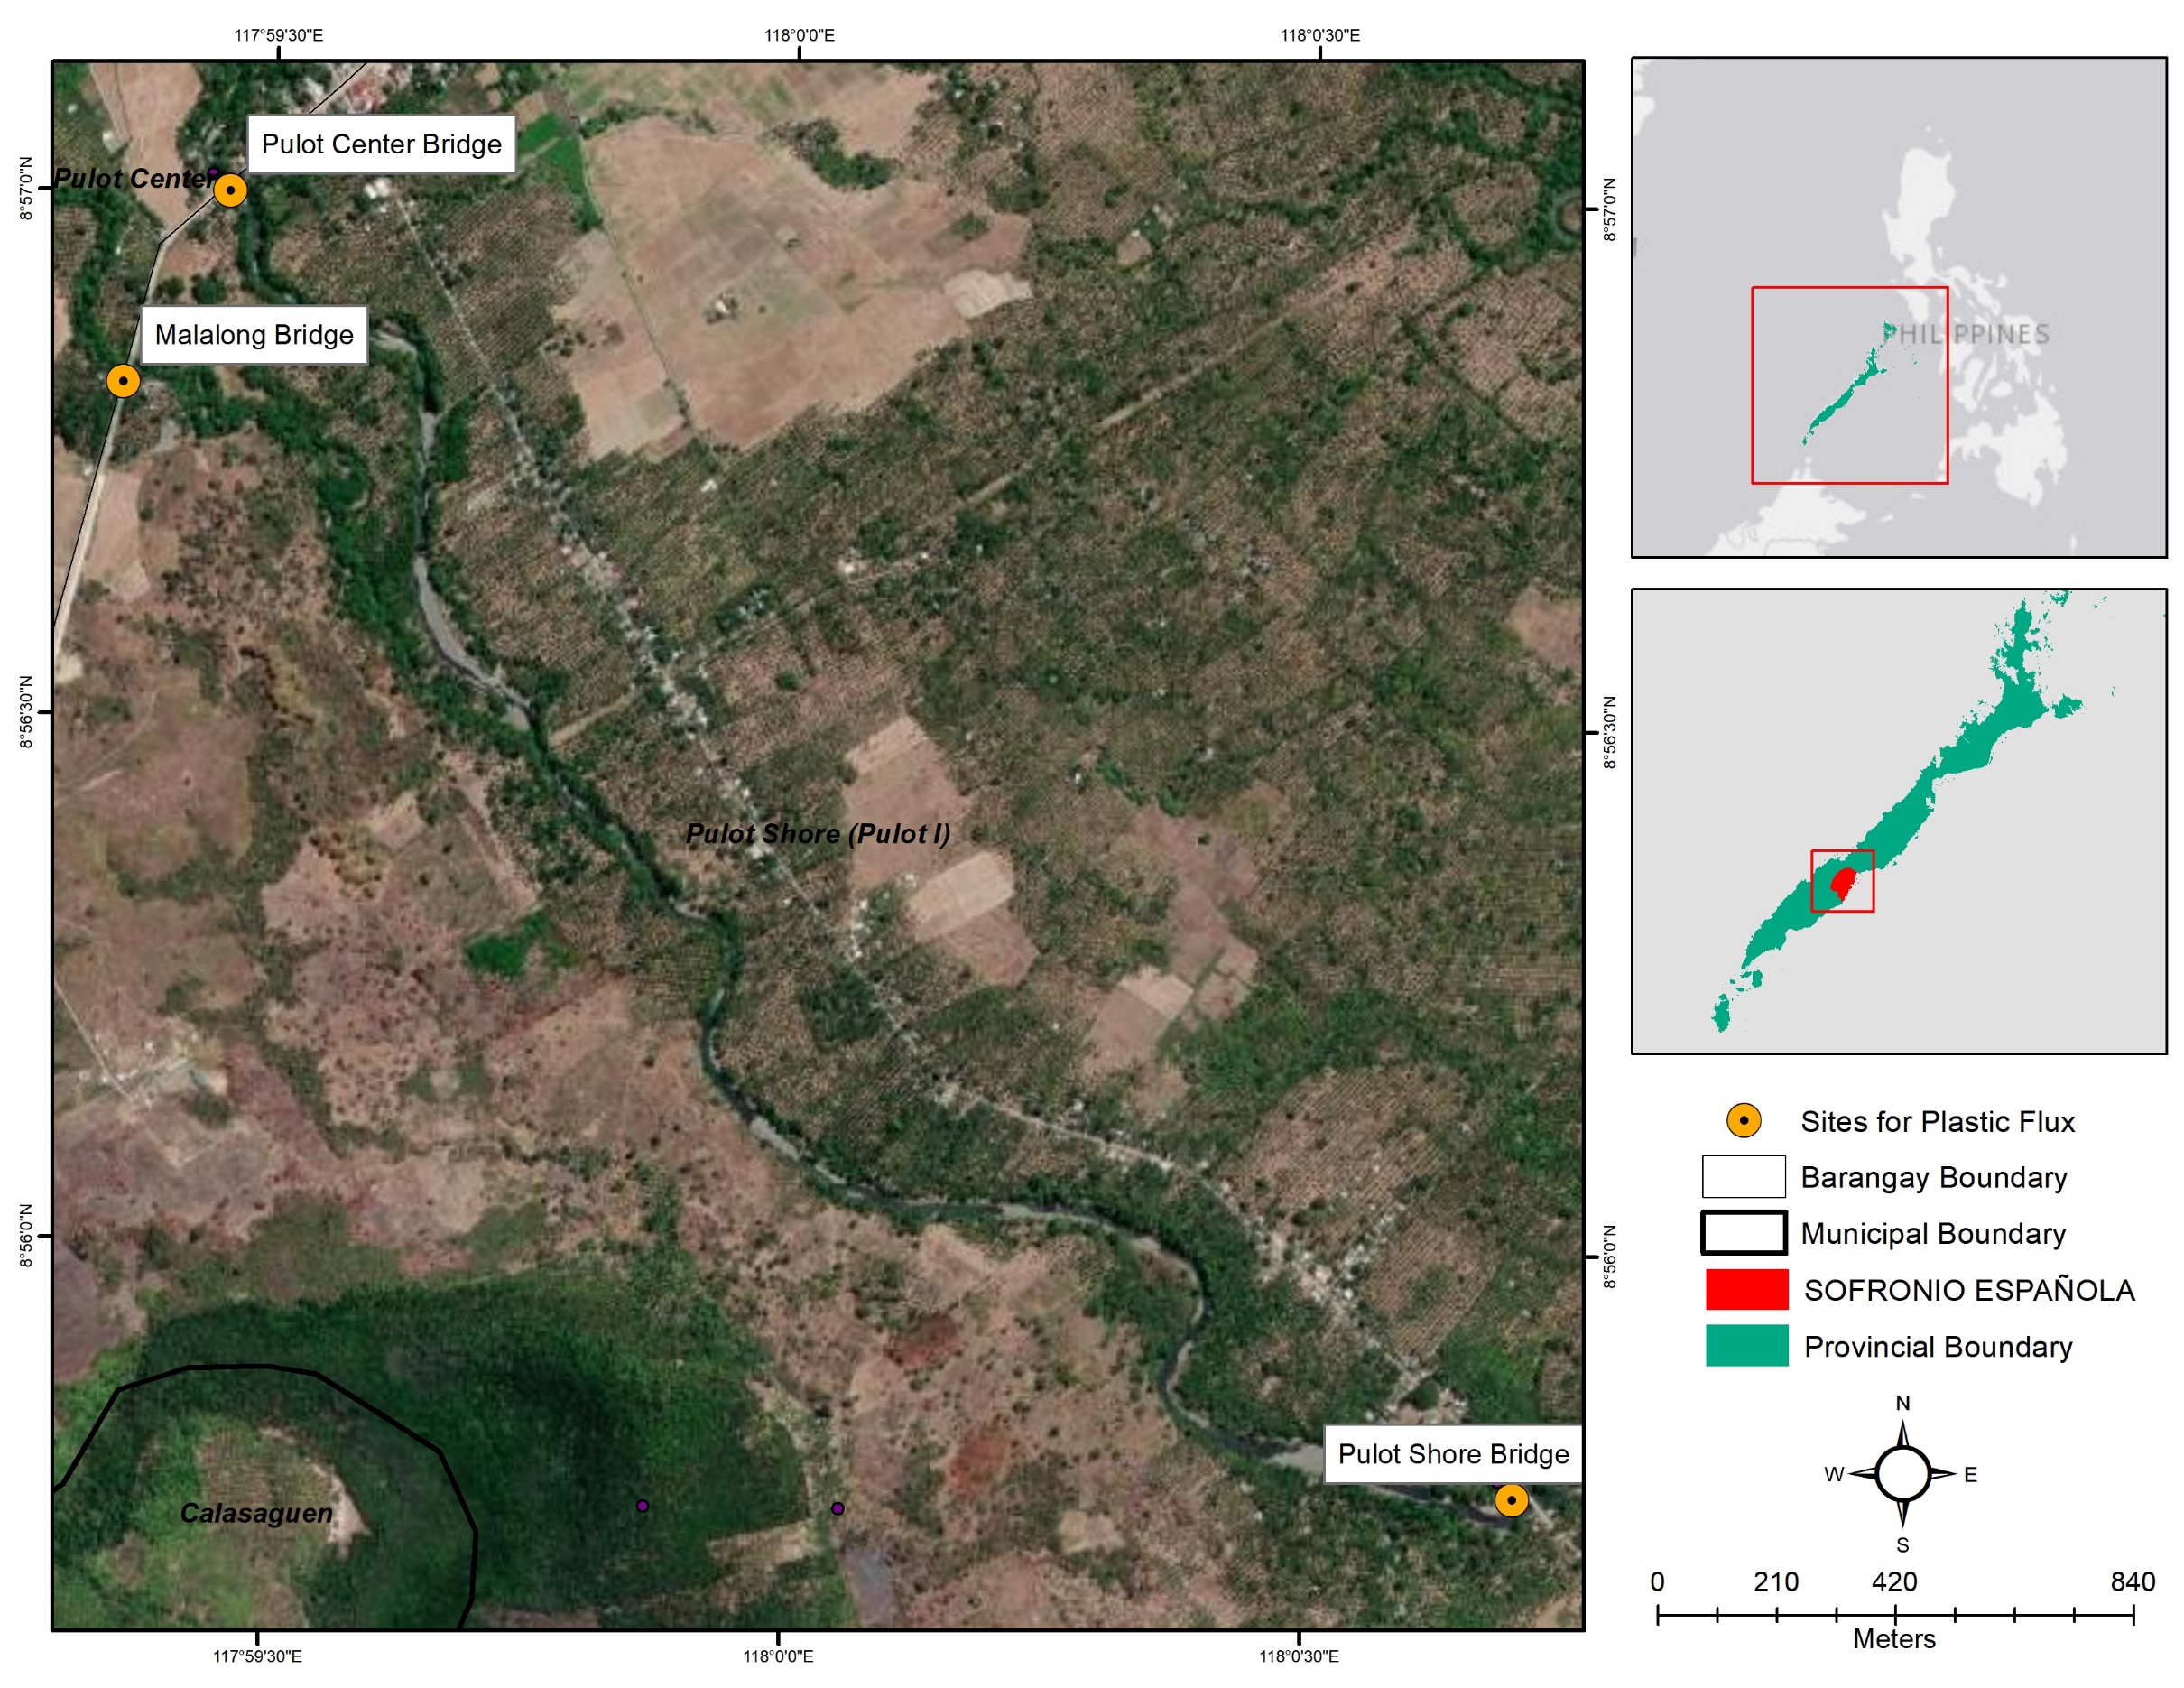
The measurement locations, watercourse type and bridge width can be found in Table 1. Observations were done on consecutive days from 04 June 2021 to 13 June 2021 from 09:00 to 10:00 and from 13:00 to 17:00.
| Measurement Locations | Watercourse Type | Location | Bridge width (m) | Coordinates |
|---|---|---|---|---|
| Pulot Center Bridge | Main River | Barrangay Pulot Center | ˜32 | 8˚57’0”N 117˚59’8”E |
| Pulot Shore Bridge | Main River | Barangay Pulot Shore | ˜44 | 8˚55’45”N 118˚0’43”E |
| Malalong Bridge | Distributary | Sitio Malalong | ˜30 | 8˚56’49”N 117˚59’22’’E |
2.2 Plastic Transport Measurements
Plastic measurements were done by utilizing the visual counting method of van Emmerick et al. (2018). Observations for this method were performed in bridges. During each sampling day, two hourly plastic transport profiles has been made, one in the morning and one in the afternoon. During a time frame of 60 min, the observer counted and classified all plastic passing through the whole bridge. The length of the bridge has been estimated between 30 to 40 m each. The bridges were selected based on safety, travel time for the observers, and location based on its availability. Each bridge was measured by one observer. Counting has been done hourly facing downstream, as we could identify plastics pieces more accurately. Each floating and superficially submerged plastics piece that was visible has been counted, independent of its sizes. For subsequent analysis, the plastic debris counts were normalized over time and expressed in total number of plastic items per hour for the whole river width. Generally, no permits are required for the visual counting method, making it as an extra advantage in our study.
2.3 Plastic Flux Classification
To determine the classification of floating plastic, visual counting method was expanded to count items based on plastic types and plastic polymer category. The plastic types include food packaging, plastic bags, plastic cups, sacks, disposable utensils, food containers, napkins and diapers, ropes, plastic fragments, Styrofoam, medicinal packaging/waste, nylon fishing line, footwear, plastic bottles, plastic caps , fishing nets, other jugs, disposable, cigarette lighters, six-pack rings, straws, toiletries, buoys and floats, rubbers and tetra-packs (Sajorne et al. 2021). A seven polymer category: polyethylene terephthalate (PET), high density polyethylene (HDPE), polyvinyl chloride (PVC), low density polyethylene (LDPE), polypropylene (PP), polystyrene (PS), and others (O), was utilized (Sajorne et al. 2021). Note that Mixed and Multilayer polymers are include in ‘Others’. The observer, count and observed the items and write it down on a tally sheet. We only explore the relative contribution of each plastic category of total number of classified items for each sampling locations, and not its temporal variation, for further analysis
2.4 Additional Data
Utilizing the “Pooh-Sticks” method by Bull and Lawler (1991), flow velocity was measured hourly at each sampling locations every after our plastic flux observations. A floating item (Ping-Pong ball) was track and timed over a predefined transect. The observer measured flow velocity by a floating item, in our case we used a Ping-Pong ball which was tracked over the first 10 m downstream of the bridge. Two observer measured the flow velocity, the Ping-Pong ball was released by the first observer at the middle segment of the bridge, the second observer tracked the time travelled by the object to the 10 m transect. At the beginning of the observation periods, transects and bridges were measured and marked with a measurement tape. Calculation of flow velocity [m sˉ¹], was carried out by dividing the transect length by the travelled time of the tracked item. Hourly measurements of flow velocity were done at the middle segments of the bridges.
2.5 Statistical Analysis
T–test was used to compare the means of the morning and afternoon, and weekdays and weekend measurements. Values were reported as plastic flux (items per hour) ± SD and considered significantly different at P < 0.05.
The Pearson’s and Spearman correlations (ρ) for each monitoring locations were calculated to determine the correlation between the plastic flux and flow velocity. Using the complete time series during morning and afternoon measurements (the morning flux, and the afternoon flux only), we investigate both Pearson’s and Spearman to determine whether any correlation is just monotonic (Spearman), or also linear (Pearson).
3. Results
3.1 Plastic Flux Profiles
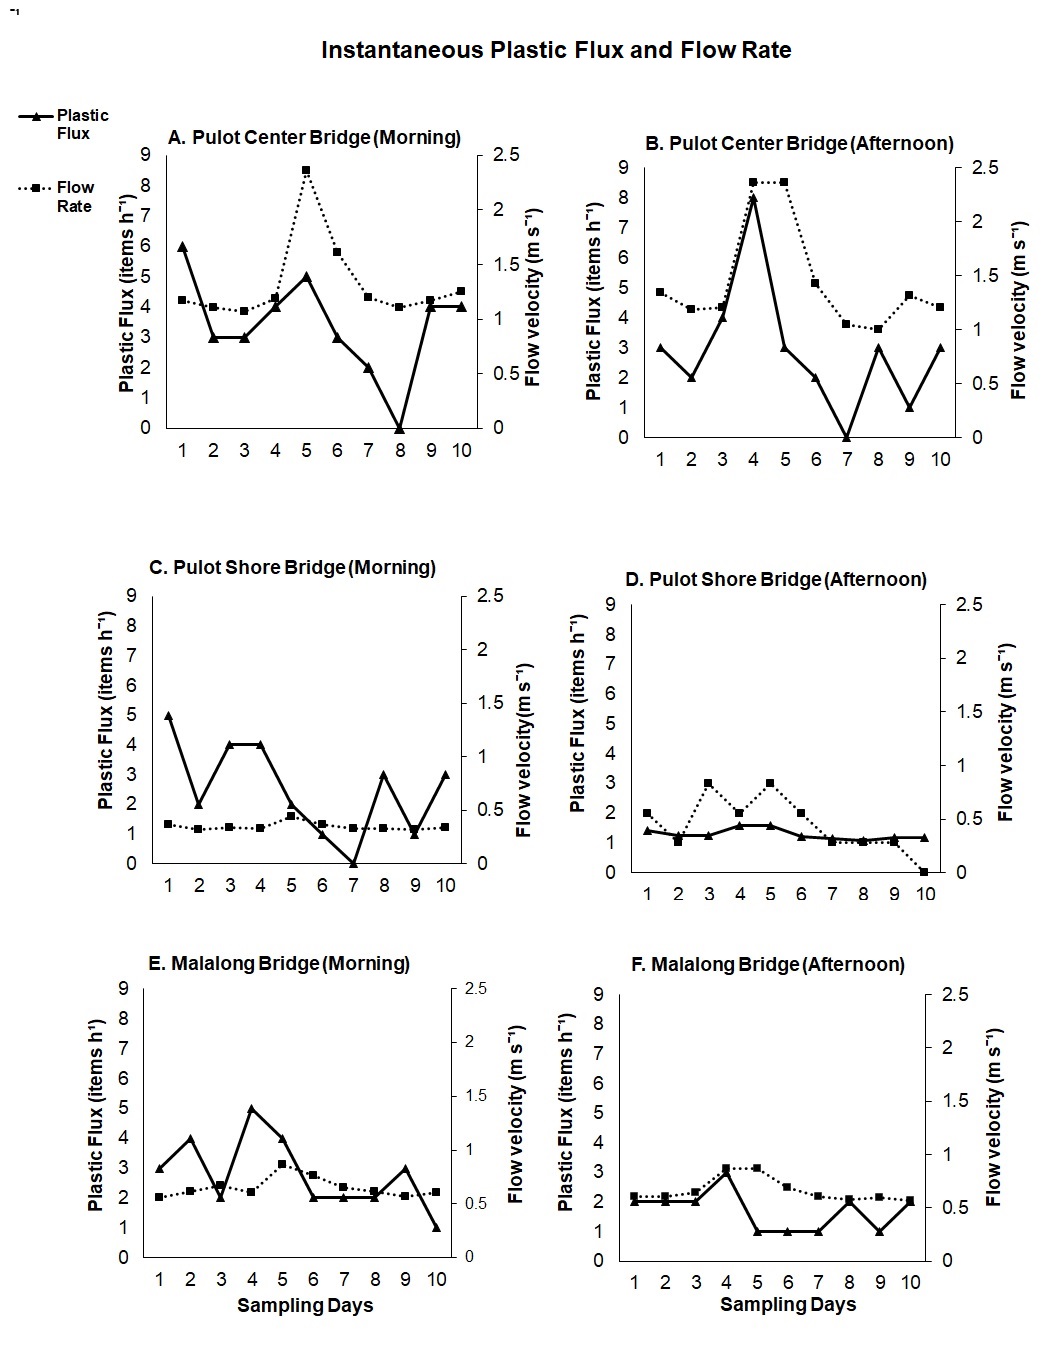
The observed plastic in the three measured locations (Pulot Center Bridge, Malalong Bridge and Pulot Shore Bridge), during the two hourly measurements showed clear variations (Figure 2). The range of instantaneous plastic flux is highest on the afternoon measurement of the Pulot Center Bridge varying between zero and eight plastic items per hour (Figure 2B). At all other locations during the afternoon measurement, the plastic flux varied between zero and three plastic items per hour. Flow velocity was measured at all locations. The observed flow velocity range was highest during morning and afternoon at Pulot Center Bridge (1–2.36 m sˉ¹), the lowest was also during the morning and afternoon measurement at Pulot Shore Bridge (0.3–0.44 m sˉ¹). The flow velocity during morning and afternoon measurement was not significantly different for Pulot Center Bridge (P = 0.17, Pulot Shore Bridge (P = 0.23), and Malalong Bridge (P = 0.36).
3.2 Daily Variations of Plastic Flux
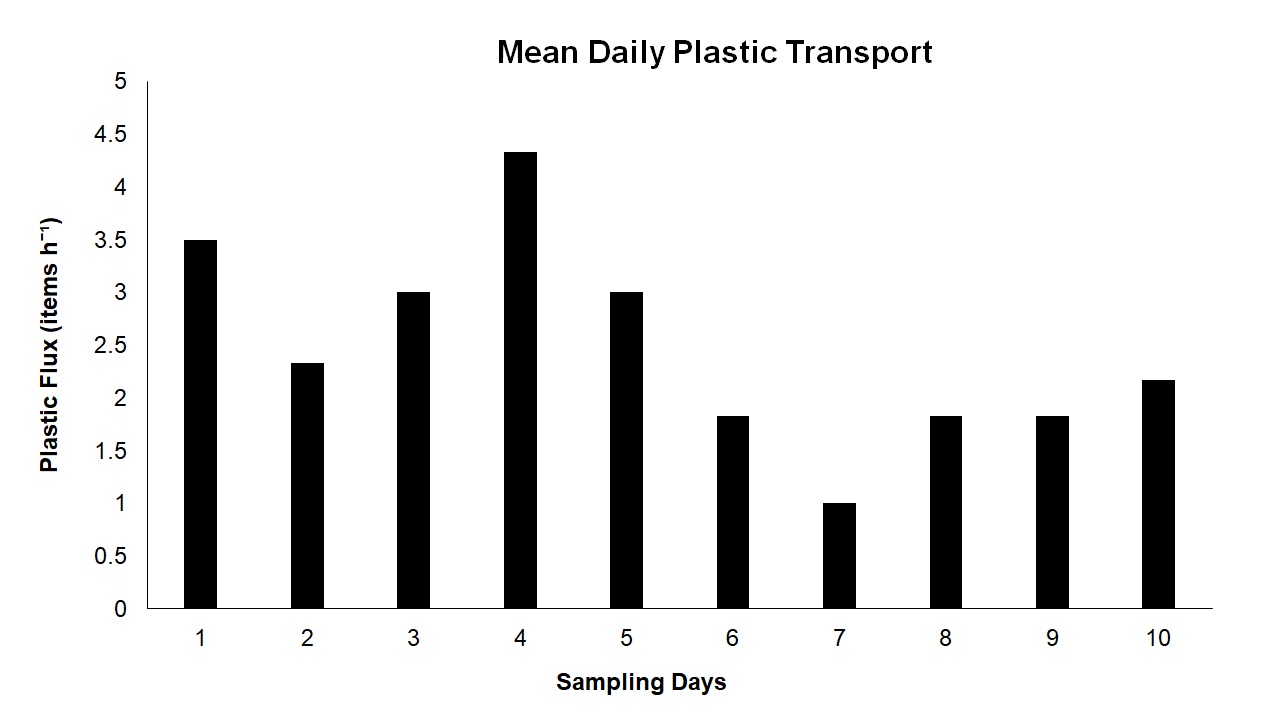
An overview of total floating plastic debris transport from three measurement locations in Pulot River, expressed in daily mean amount of plastic items per hour over full river width is shown in Figure 3. Daily average plastic transport showed some variation in measurement days, and recorded the highest plastic flux on the fourth day of visual counting measurement with up to 4.33 plastic items per hour. The lowest plastic flux was recorded on the seventh day with a total of one plastic item per hour. The average daily plastic transport is about 2.48 plastic items per hour.
3.3 Variations of Plastics during Different Time of the Day
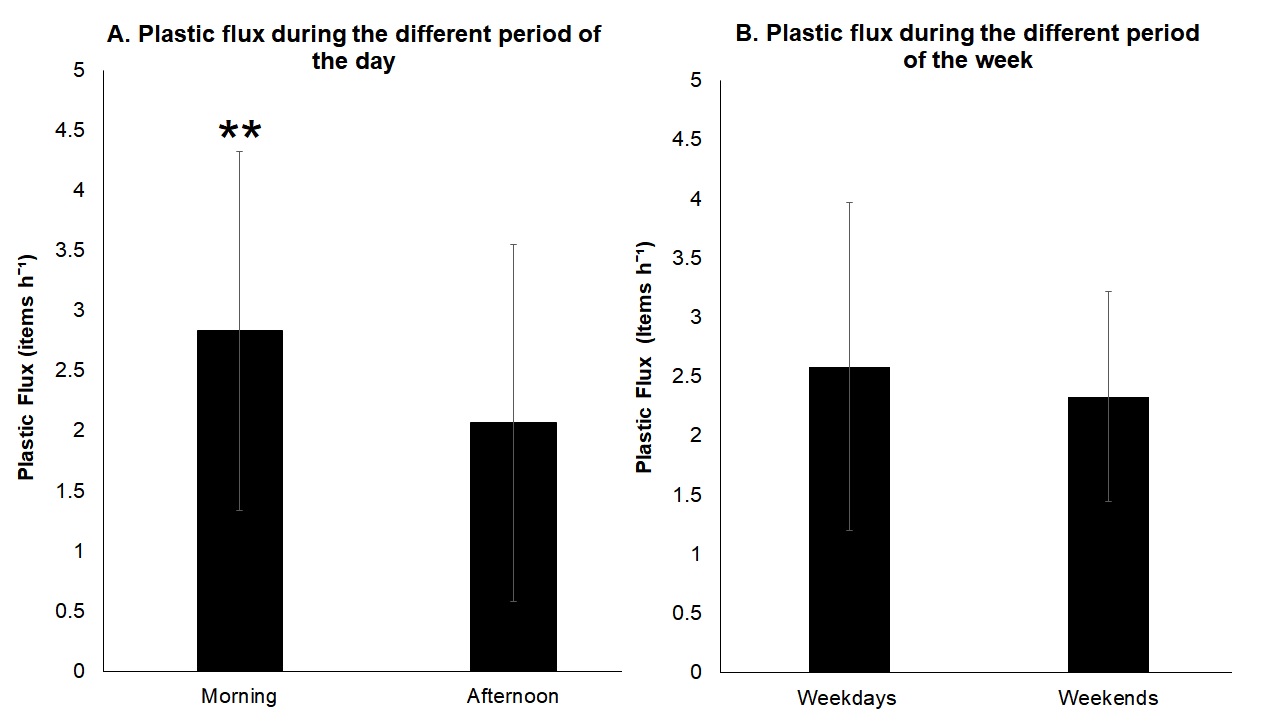
To assess the variations on the amount of plastics transported during the two different time of the day, the observed transport profiles at all locations during morning and afternoon are expressed in average of plastic items per hour (Figure 4A). During the morning measurement the average amount of plastics is 2.83 items per hour and during the afternoon measurement the average amount of plastics is 2.07 items per hour was recorded. The plastic flux during two different periods of the day (morning and afternoon) showed significant difference (P = 0.01).
3.4 Variations of Plastics Flux during the Different Time of the Week
For the variations on the amount of plastics at two different time of the week (weekends and weekdays), the observed plastic profiles at all locations during weekends and weekdays measurements are also expressed in average of plastic items per hour (Figure 4B). During the weekdays, the average amount of plastics items observed is 2.58 items per hour, and during the weekends the average amount of plastic items counted is 2.33 items per hour. The plastics items transported in Pulot River during two different time of the week (weekdays and weekends) has no significant difference (P = 0.28).
Instantaneous plastic flux and flow velocity show significant positive correlation (Spearman: 0.26-0.72, Pearson’s: 0.05-0.63) at all time for all locations at different period of measurements, except the Pulot Center Bridge during morning measurements (Spearman: 0.40, Pearson’s: -0.25), and the Malalong Bridge during morning (Spearman: -0.12, Pearson’s: 0.09) and afternoon measurements (Spearman: -0.05, Pearson’s: 0.14), in which a negative significant relation was found, suggesting that the plastic flux decreases for increasing of flow velocity.
3.5 Plastic Type Classification
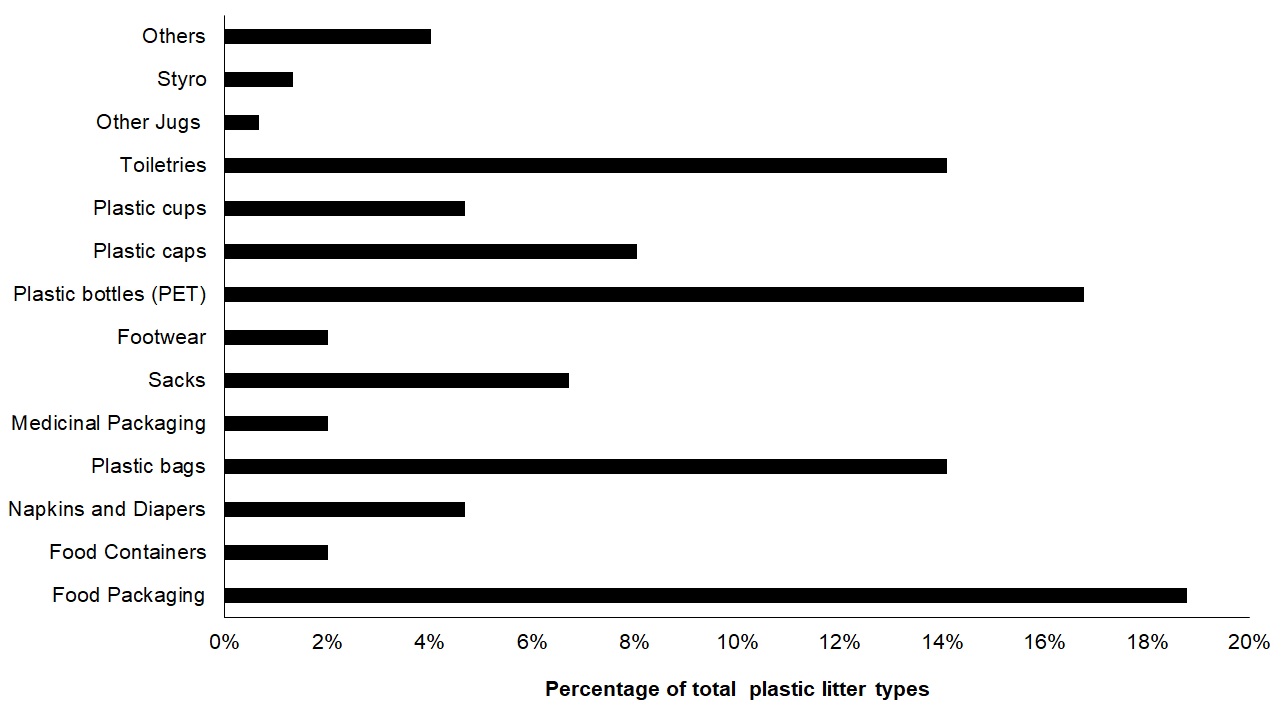
The most abundant floating plastic type in Pulot River were food packaging, plastic bottles, plastic bags and toiletries which accounts for more than 50% of the plastics observed (Figure 5).
3.6 Plastic Polymer Category
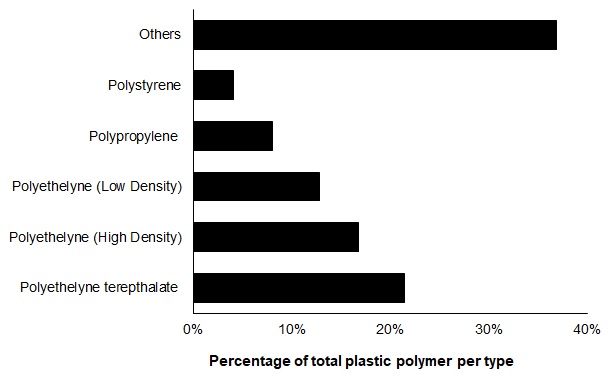
The majority of observed floating plastics classified in Pulot River surface water falls to the “Other” category, which was a combination of Mixed and Multilayers plastics, which accounts of about 37% of the total classified floating items (Figure 6).
4. Discussion
4.1 Plastic Transport
The Philippines is estimated in producing about 2.7 million tons of plastics waste each year, of which about 20% was assumed to end up in the ocean (World Bank Group 2021). The estimated 356,371 metric tonnes of plastic emission from the river into ocean (Meijer et al. 2021) therefore equals 66% of the total annual plastic waste in the Philippines. With this amounts, the need for future assessments for estimating macroplastics transport should be emphasized for optimization on the collection of these plastics before they are transported to the sea.
First, transport of mismanaged plastic waste during different periods of the day (morning and afternoon) should be quantified. A better understanding of the factors influencing plastic transport such as flow velocity with river system will contribute to the improvement of riverine plastic transport modelling approach.
This assessment was based on instantaneous measurement values for flow velocity and plastic flux. Extreme events such as floods (Bläsing and Amelung 2018) may cause increased in flow velocity could remobilized settled macroplastic waste, and increase riverine plastics transported further into the ocean (Hurley et al. 2018; Lechthaler et al. 2019. During the ten days monitoring period in June, we assumed that the plastic flux remains as the same level as observed for throughout the year. Hypothesis was also made that increased in flow velocity due to extreme events might mobilize additional plastic debris such that the plastic flux maybe higher during flooding. Peak debris flow generally happens during flood events (Minamie et al. 2015), with that it is expected that in urban areas this is the same for plastic debris flow. Mainly during rainy seasons, flooding is a continuous threat for Pulot River. It is unfortunate that accurate information during first hour of flooding are scarce (Eilander et al. 2016). Moreover, based on early observations accumulated plastics are also abundant in riversides that may acts as temporary sinks of plastics during low flow that are further remobilized during high flow (van Emmerick et al. 2019c). Furthermore, future work will shed additional lights on the effects of flood events on plastic transport, as it will contribute to a better understanding of all driving forces of riverine plastic transport (van Emmerick et al. 2019c).
4.2 Variations of plastics over time
The net export of plastic into the ocean was not represented by the plastic flux data presented in this paper. The observation length was limited and measurements were only done during the day. The 10 day field assessment does not cover the seasonal riverine plastic flux, furthermore did not assess factors such that river discharge and tidal influence. Note that the plastic transport is always in downstream direction, for all locations are away from the river mouth. Lacking on the data of tidal dynamics, makes it impossible however to estimate the net export of plastics flux from rivers into the ocean (van Emmerick et al. 2020b). It is not also possible to estimate the plastic mass flux from the plastic item flux without mass statistics (van Emmerick et al. 2018, 2020b). With the uncertainties on the literature values, as found means mass per item vary over an order magnitude (van Emmerick et al. 2019a.b, 2020b), therefore we cannot directly compare our measurements of plastic flux to recent modelled riverine plastic export estimates (van Emmerick et al. 2020b). In here we assessed and compare means on plastic transport during morning and afternoon, daily, and, weekend and weekdays measurements of plastics flux in Pulot River for temporal variations. To arrive at the total daily estimations of plastic flux, several empirical relations are used, based on observations at all three locations. The mean daily plastic flux at three different locations was calculated and the result shows that the plastic transport varies on daily amount. The mean of daily plastic flux estimates is highest on the fourth day with 4.33 plastic items per hour. Understanding the variations on the amount of plastics transported during different times of the day is also crucial and remain uncertain in the assessment of riverine plastic flux. In this study, plastic flux is significantly higher during morning with an average of 2.83 plastic items per hour than the afternoon measurement with an average of 2.07 plastic items per hour. For the amount of plastic transported during different time of the week (weekends and weekdays), there is 4 weekends and 7 weekdays during our sampling period, it was found out that plastic transport during weekdays is higher with an average amount of 2.58 plastic items per hour than on the weekends with an average amount of 2.33 plastic items per hour. These variations in the amount of plastics transported in Pulot River might have three explanations. First, there might be a variation on the discharge and flow velocity. Second, the highest plastic transport was measured on Day 4, wherein there is an increase in flow velocity and most of the mobilized plastics was flushed out of the river system out to the ocean, hence there’s the decrease on the amount of plastics introduced or remobilized on the 5fth and 6xth Day. Third, the contribution of anthropogenic activities along the river, for the variations of plastic during different times of the day (morning and afternoon), it is assumed that people along Pulot River might throw their plastic waste more often on the morning than the afternoon. Same thing as for weekends and weekdays, it is assumed that more plastics are being consumed by people during weekdays for their daily activities than on weekends. Plastic transport can respond to changing hydrological conditions or less predictable human factors (van Emmerik and Schwarz 2020; van Emmerick et al. 2020a). In some river systems, the majority of plastic transport can occur in a very limited time (Moore et al. 2011; van Emmerik et al. 2019b, 2020a).
4.3 Classification of plastic flux in Pulot River and its tributary
Observed plastics consisted mostly of Multilayer, PVC and PET (plastic bottles, toiletries and food packaging) which can reflect the waste management practices and consumption patterns of the surrounding populations. The plastic composition observations were similar from the other rivers that has been observed with a similar methodology. For example, Multilayers was the most abundant plastic category being observed in the upstream portion of Pasig River (van Emmerick et al. 2020b). These data therefore suggest that rivers in the Philippines situated in urban areas exhibit a specific plastic footprint similar to that river. On the other hand, Sajorne et al. (2021), have shown that the most abundant plastics litters at the residential and non-residential beach areas of Palawan were low-density polyethylene, polyamide and other plastics wherein Multilayers does belong and those plastics which were difficult to classify. Therefore, it seems that Pulot River does emit the most commonly found plastics in the beaches of Palawan. It is therefore important to expand these measurements to better understand plastic composition in rivers.
5. Conclusion and Recommendation
Riverine plastic pollution is an emerging environmental issues, yet field assessments are still limited. The aim of this study was to provide new insights in the occurrence and temporal variations of riverine plastic transport in the rivers of Palawan, Philippines, specifically in Pulot River in Sofronio Española. The increase in availability of riverine plastic data which will contribute to improving our understanding of riverine plastic flux and for evaluation of potential mitigation measurement remains crucial.
Overall, we unralleved the plastic flux and plastic composition in Pulot River, Sofronio Española, Palawan. Plastic flux vary depending on the location on the river and time of the day. Plastic flux on Pulot River were significantly high in the morning than in the afternoon. The two different time of the week (weekdays and weekends), showed no significant difference. This illustrates for the need for additional observations of plastic flux for Pulot River and beyond for temporal variations.
Instantaneous plastic flux was measured the highest during increased flow velocity at all locations. The result suggests that flow velocity play important role in transport of plastics in the riverine surface water. Future studies on long term data of plastic flux and tidal dynamics may also shed additional information on the spatiotemporal variations of plastics as well as the total annual plastic transport. This paper presents the first macroplastic observations for the rivers in Palawan and provide baseline information into the potential sources, deposition and pathways of plastic pollution aquatic environment in Palawan. Furthermore, the result of this study emphasize the need for further investigation on the effect of flow velocity on river plastic transport.
6. Acknowledgments
The researcher would like to extend her genuine appreciation and acknowledgement the different personalities and organizations that helped make this research a success. To the Department of Science and Technology – Science Education Institute (DOST-SEI) through the Accelerated Science and Technology Human Resource Development Program (ASTHRDP) for the scholarship program and for funding this research that made this study possible. The author would also like to thank her colleagues for the support all throughout the study analysis and sampling period.
References
- Abreo NAS, Thompson KF, Arabejo GFP and Superio MDA. (2019). Social media as a novel source of data on the impact of marine litter on megafauna: the Philippines as a case study. Marine Pollution Bulletin, 140: 51–59. https://doi.org/10.1016/j.marpolbul.2019.01.030
- Bläsing M and Amelung W. (2018). Plastics in soil: Analytical methods and possible sources. Science of the Total Environment, 612: 422-435. https://doi.org/10.1016/j.scitotenv.2017.08.086
- Bull PA and Lawler DM. (1991). Flow measurements and water tracing. In: Judson D (ed). Caving Practice and Equipment. Cordee-Leicester/British Case Research Association, pp. 167-178.
- Cayabo GDB, Omar DM, Mabuhay-Omar JA and Bacosa HP. (2021). Bacteriological assessment of recreational water in Bacuit Bay El Nido, Palawan, Philippines. The Palawan Scientist, 13(1): 44-58.
- Eilander D, Trambauer P, Wagemaker J and Van Loenen A. (2016). Harvesting social media for generation of near real-time flood maps. Procedia Engineering, 154: 176-83. https://doi.org/10.1016/j.proeng.2016.07.441
- González-Fernández D and Hanke G. (2017). Toward a harmonized approach for monitoring of riverine floating macro litter inputs to the marine environment. Frontiers in Marine Science, 4: 86. https://doi.org/10.3389/fmars.2017.00086
- Hurley R, Woodward J and Rothwell JJ. (2018). Microplastic contamination of river beds significantly reduced by catchment-wide flooding. Nature Geoscience, 11: 251-257.
- Lasut MT, Weber M, Pangalila F, Rumampuk ND, Rimper J R, Warouw V, Kaunang S and Lott C. (2018). From Coral Triangle to Trash Triangle–How the Hot Spot of Global Marine Biodiversity is Threatened by Plastic Waste. In: Cocca M…… (eds). Proceedings of the International Conference on Microplastic Pollution in the Mediterranean Sea. Springer Water, pp. 107-113. https://doi.org/10.1007/978-3-319-71279-6_15
- Lebreton L and Andrady A. (2019). Future scenarios of global plastic waste generation and disposal. Palgrave Communications, 5(1): 1-6. https://doi.org/10.1057/s41599-018-0212-7
- Lechthaler S, Dolny R, Spelthahn V, Pinnekamp J and Linnemann V. (2019). Sampling concepts for microplastics in combined sewage-affected freshwater and freshwater sediments. Fundamental and Applied Limnology, 194(1): 37-48.
- Meijer LJJ, van Emmerick T, van Der Ent R, Schmidt C and Lebreton L. (2021). More than 1000% rivers accounts for 80% of global riverine plastic emission into the ocean. Science Advances, 7(18): 1-13. https://doi.org/10.1126/sciadv.aaz5803
- Minami M, Onoi T, Nihei Y, Nishjima H, Hotta T, Funamoto Y, Kaneko H, Otani A, Kataoka T and Hinata H. (2015). An automatic and continuous monitoring system for floating-litter transport in river and its application to field survey in Mogami River. Journal of Japan Society Civil Engineers, 69(4): 769-774. https://doi.org/10.2208/jscejhe.69.1_769
- Moore CJ, Lattin GL and Zellers AF. (2011). Quantity and type of plastic debris flowing from two urban rivers to coastal waters and beaches of Southern California. Journal of Integrated Coastal Zone Management, 11: 65-73. https://doi.org/10.5894/rgci194
- Sajorne RE, Bacosa HP, Cayabo GDB, Ardines LB Jr, Sumeldan JDC, Omar JM and Creencia LA. (2021). Plastic litter along sandy beaches in Puerto Princesa, Palawan Island, Philippines. Marine Pollution Bulletin, 169: 112-520. https://doi.org/10.1016/j.marpolbul.2021.112520
- Schmidt C, Krauth T and Wagner S. (2017). Export of plastic debris by rivers into the sea. Environmental Science and Technology, 51(21): 12246–12253. https://doi.org/10.1021/acs.est.7b02368
- Statista (2020). Plastic waste worldwide-statistics and facts. https://www.statista.com. Accessed on 17 August 2021.
- Sumeldan JDC, Ritcher I, Avillanosa AL, Bacosa HP, Creencia LA and Pahl S. (2021). Ask the locals: A community-informed analysis of perceived marine environment quality over Time in Palawan, Philippines. Frontiers in Psychology, 12: 661810. https://doi.org/10.3389/fpsyg.2021.661810
- Thompson RC, Olsen Y, Mitchell RP, Davis A, Rowland SJ, John AW and Russell AE. (2004). Lost at sea: Where is all the plastic? Science, 304(5672): 838–838. https://doi.org/10.1126/science.1094559
- van Calcar C and van Emmerik T. (2019). Abundance of plastic debris across European and Asian rivers. Environmental Research Letters, 14: 124051. https://doi.org/10.1088/1748-9326/ab5468
- van Emmerik T and Schwarz A. (2020). Plastic debris in rivers. WIREs Water, 7(1): e1398. https://doi.org/10.1002/wat2.1398.
- van Emmerik T, Kieu-Le T-C, Loozen M, van Oeveren K, Strady E and Bui X- T. (2018). A methodology to characterize riverine macroplastic emission into the ocean. Frontiers in Marine Science, 5: 372. https://doi.org/10.3389/fmars.2018.00372
- van Emmerik T, Loozen M, Van Oeveren K, Buschman F and Prinsen G. (2019a). Riverine plastic emission from Jakarta into the ocean. Environmental Research Letter, 14: 084033. https://doi.org/10.1088/1748-9326/ab30e8
- van Emmerik T, Strady E, Kieu-Le T-C, Nguyen L., and Gratiot N. (2019b). Seasonality of riverine macroplastic transport. Scientific Reports, 9: 1–9. https://doi.org/10.1038/s41598-019-50096-1
- van Emmerik T, van Calcar C, Tramoy R, Alligant S, Treilles R, Tassin B and Gasperi J.( 2019c). Seine plastic debris transport tenfolded during increased river discharge. Frontiers in Marine Science, 6: 642. https://doi.org/10.3389/fmars.2019.00642
- van Emmerik T, Seibert J, Strobl B, Etter S, den Oudendammer T, Rutten M, bin Ab Razak MS and van Meerveld I. (2020a). Crowd-Based Observations of Riverine Macroplastic Pollution. Frontiers in Earth Science, 8: 298. https://doi.0rg/10.3389/feart.2020.0029
- van Emmerik T, van Klaveren J, Meijer LJJ, Krooshof JW, Palmos DAA and Tanchuling MA. (2020b). Manila river mouths act as temporary sinks for macroplastic pollution. Frontiers in Marine Science, 7: 545812. https://doi.org/10.3389/fmars.2020.545812
- World Bank Group. (2021). Market Study for the Philippines: Plastic Circularity Opportunities and Barriers, East Asia and Pacific Region plastic Series, World Bank Washington, DC. https://openknowledge.worldbank.org/handle/1098. Accessed on 25 August 2021