Monitoring the Shoreline Dynamics of Manamoc Island, Cuyo, Palawan
Abstract
Anthropogenic activities have an impact on the coastal environment, even on small islands with little economic activity. This is evident in Manamoc Island, Cuyo, Palawan. Knowledge and understanding of these impacts will enable policymakers to formulate policies arresting the problem. This study focused on establishing shoreline trends using sand boundary as a proxy and determining specific physical or natural processes and anthropogenic activities affecting coastal conditions on Manamoc Island. Key informant interview (KII), beach profiling, longshore drift direction and velocity determination, and time series analysis of shoreline were carried out. Manamoc Island coastline retreated at an average of 38–64.5m from 1989 to 2016. These were attributed to the compounding effect of natural processes, hydrometeorological events, and anthropogenic activities. The anthropogenic activities led to the destruction of natural barriers e.g. sand, rocks, coral reefs, seagrass, mangroves, and other coastal vegetation resulting in coastal erosion. With impending threats of climate change and sea-level rise, locals should consider long-term relocation. Furthermore, intensive IEC campaigns on coastal resource protection and reframing the coastal resource management plans are imperative.
Keywords
anthropogenic activities, beach profile, coastal erosion, monsoon, natural barriers
Introduction
Anthropogenic activities will always have the potential to harm the coastal environment. The Philippines is archipelagic and major cities are located in coastal areas (Bayani-Arias et al., 2012) where the majority of the population is concentrated. Because of the high population density in major coastal cities, it is expected that anthropogenic activities in these cities will greatly impact the overall health of the coastal environment. Moreover, the effects of anthropogenic activities are aggravated by land conversion triggered by major economic activities.
Aside from coastal cities, the Philippines has many sparsely populated small islands with little economic activity. However, the effects of the anthropogenic activities of these island communities on the shoreline are unclear. The question then arises, will the anthropogenic activities in small island communities significantly affect the shoreline?
Manamoc is one of these small islands inhabited by a small population and with few economic activities that are mostly conventional. The major source of livelihood is seaweed farming and fishing. Fishing has been a major livelihood on the island since time immemorial. Seaweed farming on the other hand was introduced on Manamoc Island around the 1980s (personal communication with a local elder) as an alternative livelihood for fishing. As of the conduct of the study, seaweed production is low due to diseases and the price is cheap.
This study sought to (a) describe the meteorological and topographical setting; (b) establish shoreline trends using time-series analysis of three beach sections of the island, and (c) determine the socio-economic factors affecting the shoreline evolution. This study may serve as a basis for policymakers in formulating and refining existing policies related to coastal protection as well as in the formulation of the coastal resource management plans.
Methods
Study area
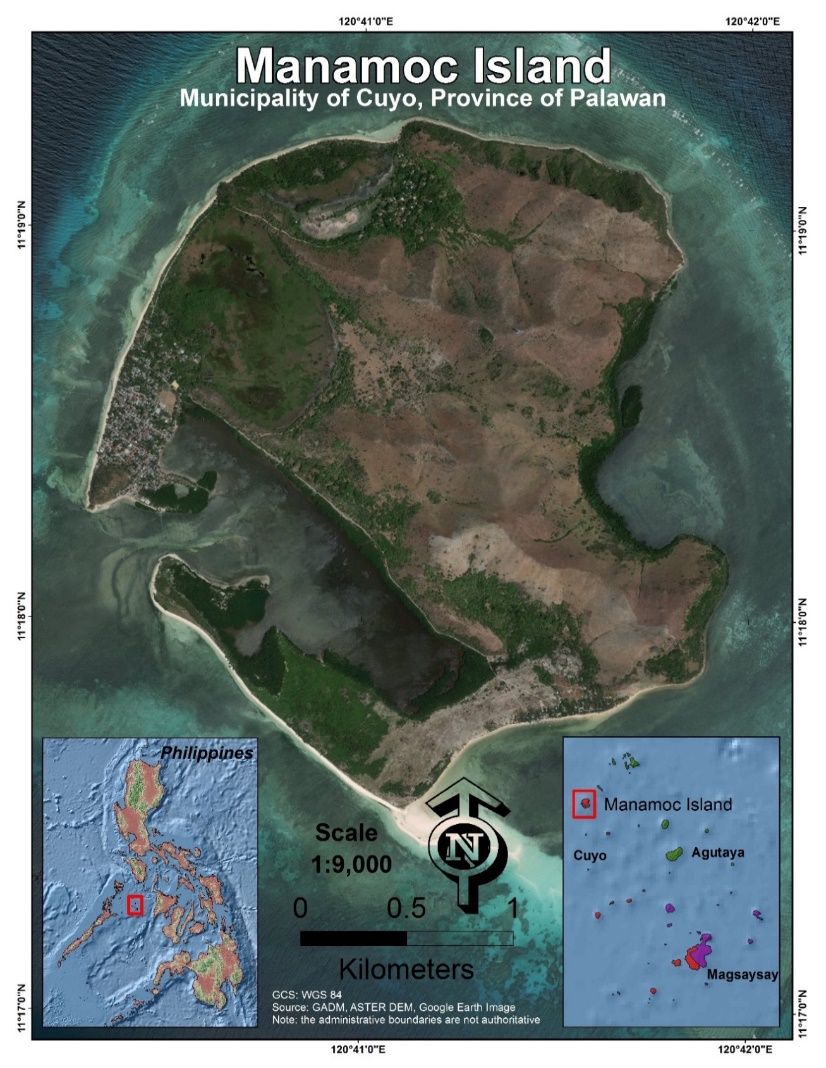
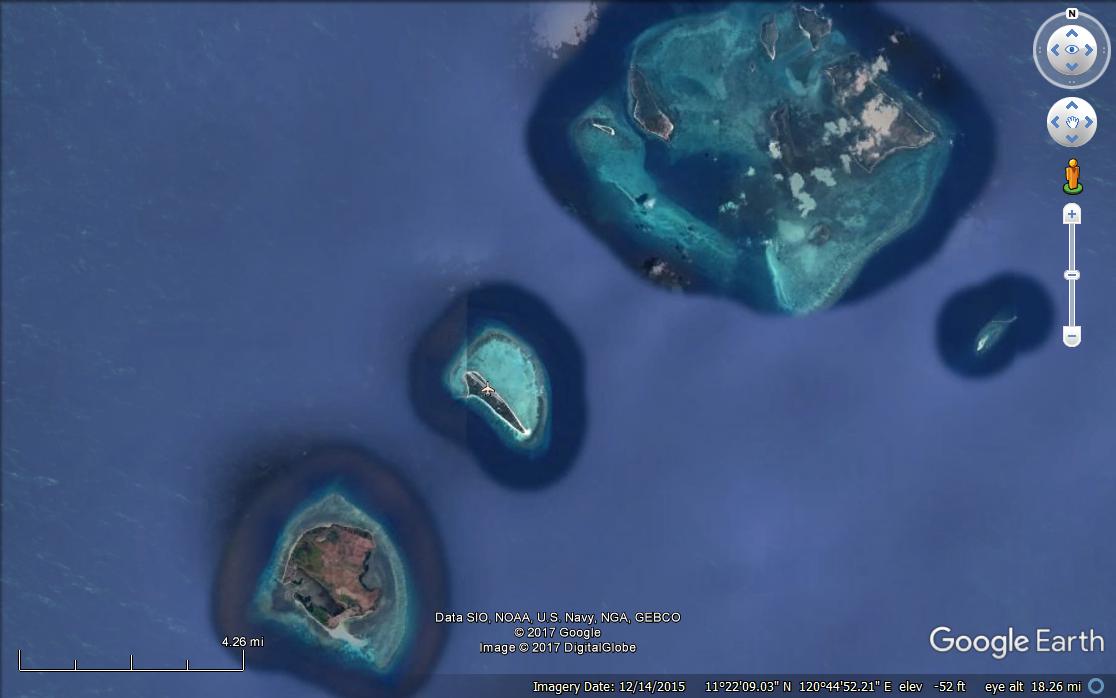
Manamoc Island is part of the Quiniluban Group of Islands (see Figure 1 inset map lower right) in the northeast of Palawan, Philippines. The island is circular and characterized by long beaches, thin mangrove forests cover, low hills covered with grasses and a few stands of ironwood, a marshland, and an 80-hectare coastal lagoon.
Time-series analysis of the shoreline change of Manamoc Island
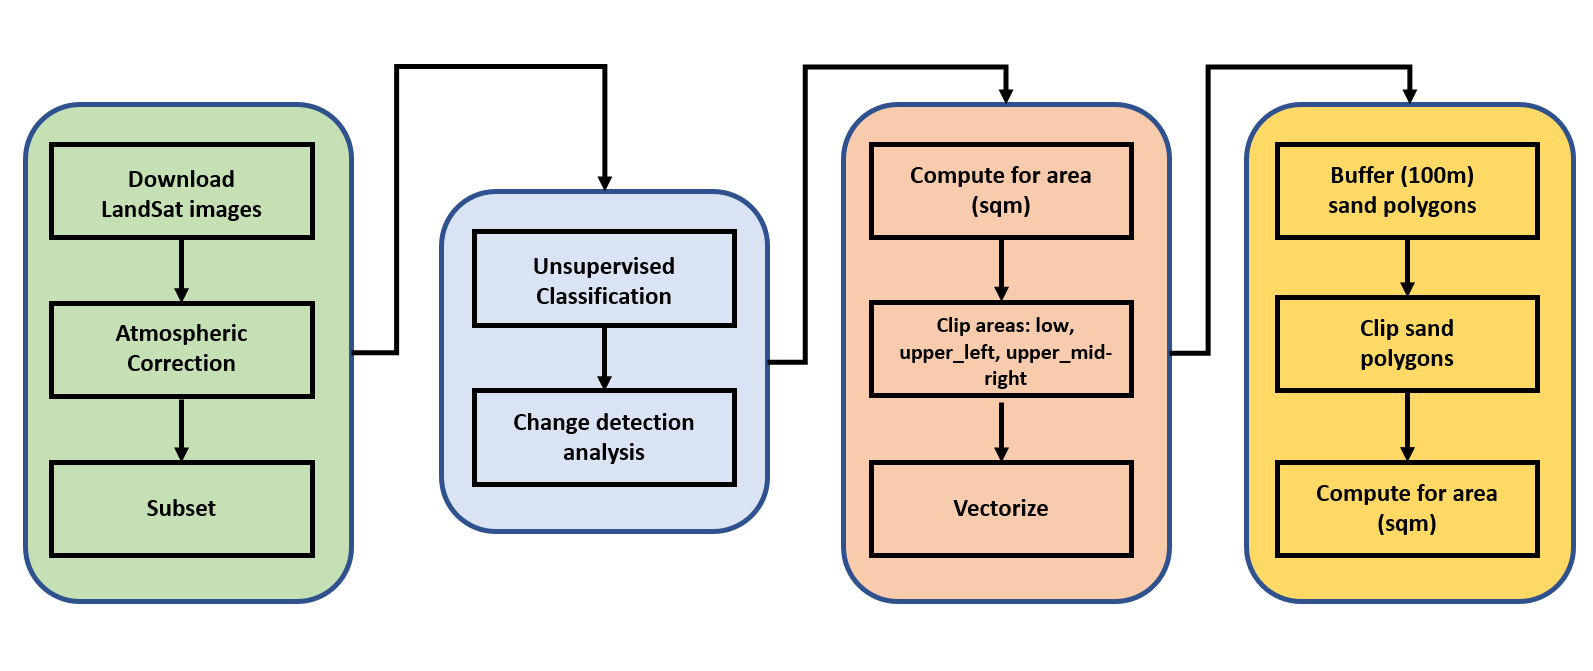
Satellite images for the years 1989, 1997, 2003, 2006, and 2016 were downloaded from the USGS website. The images selected have 10% cloud cover and/or less with a resolution of 30 meters per pixel. These images were then atmospherically corrected to minimize the effect of atmospheric distortions in the pixel values. After this, a subset of each image that covered the area of interest was extracted to limit the extent of the data to be processed.
This methodology utilized an unsupervised classification method to produce a land cover map of the island. Classes extracted in each image were the following: a.) Built-up/Soil; b.) Sand; c.) Vegetation; and d.) Water using various thresholds. After the classification procedure, the respective outputs were then compared to each other to assess the land-cover change across time. The area of these pixels was also computed (in square meters).
The classification produced for each image and the results for the change detection analysis done were further divided into three parts for ease of analysis: northeast, northwest, and south.
These classification maps for each detected change were then vectorized (transformed from “raster” data type to “vector” data type) and produced polygon shapefiles for paired years for comparison. At this point, we extracted those polygons classified as “Sand” since this is the highlight of this study. Using a process called Buffer, another set of shapefiles for each area that extended 100 meters from their boundaries was produced. The buffered polygons were then used as clippers to capture areas within that limit to capture the land-cover changes within that vicinity that may contribute to the possible receding or increase in the extent of the shoreline areas.
Other land-cover changes that involved this class (such as Water-Sand, Sand-Built-up/Soil, Vegetation to Sand) were also noted and computed for their areas. From this, assumptions were drawn to the possible dynamics that played part in the land-cover change in the shorelines of Manamoc Island in Palawan. Figure 2 shows the summary of the workflow for shoreline trend analysis.
Describing the meteorological, oceanographic, and geographic setting of Manamoc Island
The average monthly rainfall, average monthly temperature, and wind data for 1989 to 2016 were retrieved from the Philippine Atmospheric Geophysical and Astronomical Services (PAG-ASA), Quezon City. Data were analyzed using descriptive statistics and plotted using Microsoft Excel.
Beach profiling
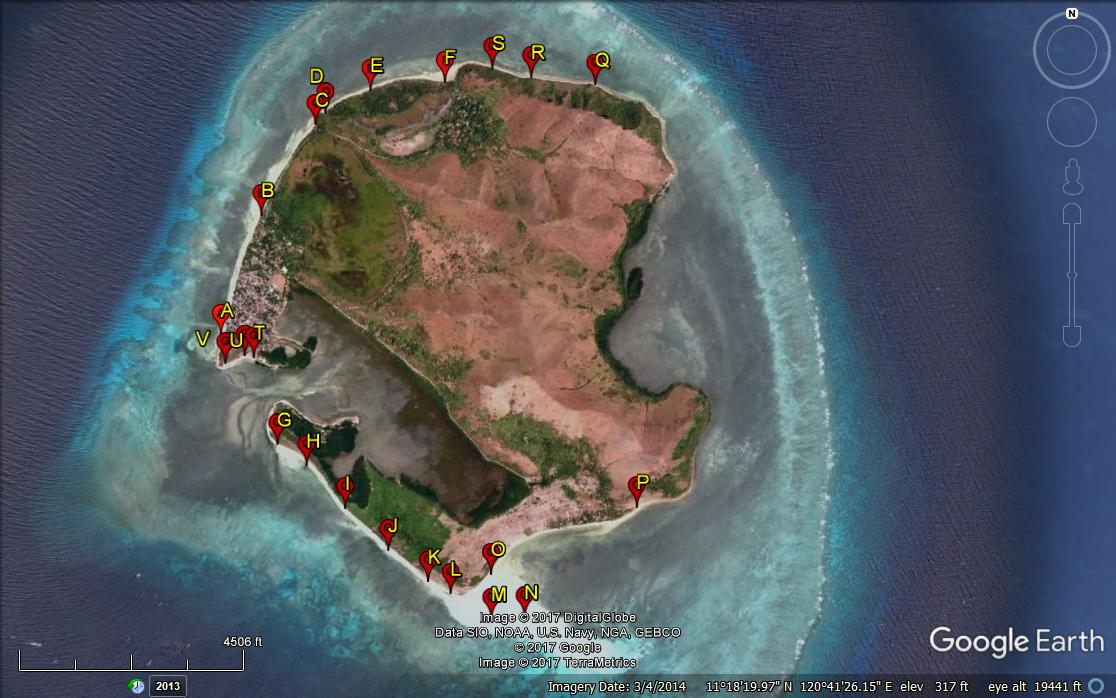
Beach profiling was done following the principle of the stadia method or differential survey or leveling described in the book of La Putt (1987). Figure 3 shows the sampling points. The following instruments were used: a GPS, stadia rod, Abney-hand-level, and Stanley Fatmax portable laser level instrument. Beach profiling was done during low tides. Time, coordinates, initial elevation per sampling point, height, and distances were recorded. Succeeding elevations were computed and plotted in a graph using Microsoft Excel.
Determination of longshore drift
In determining the longshore drift, a simple experiment was performed using the float method as employed in several studies of longshore transport e.g. Esteves (2009), and streamflow measurement e.g. Dyer (1970). The following materials and instruments were used: an orange weighing 200 grams, a cellphone as a timer, GPS, and a meter tape. The experiment was done a few meters away from the shoreline and away from boats and other obstructions. The experiment started by letting the orange float into the water for 1 minute. The time of the experiment, distance from the shoreline, water depth, velocity, and coordinates of the areas were noted and recorded. The experiment was replicated 5 times per location and carried out in 5 locations (see Figure 13). The drift was obtained by getting the average distance covered by the orange in 1 minute.
Determining socio-economic factors affecting coastal conditions using key informant interview (KII)
To determine the socio-economic factors that have affected the coastal condition of Manamoc Island, 15 key informants were interviewed. The key informants include the following: housewives (with houses directly affected by the shoreline retreat), a youth, elders, seaweed farmers, a People’s Organization (PO) officer, a Barangay Council member, a teacher, a non-government (NGO) representative, an MPDO (Municipal Planning Development Office) representative, a DRRMO (Disaster Risk Reduction Management Office) representative, and personnel from KALAHI (Kapit-Bisig Laban sa Kahirapan) — CIDDS (Comprehensive and Integrated Delivery of Social Services).
Permits and consents were secured before the actual conduct of the activity. A recorder was used to facilitate ease of recording. Results were transcribed using the free trial version of NVivo 11 and analyzed using the thematic analysis described by Braun (2006). Hypothetical names were used to protect the personalities involved.
Results
Meteorological, oceanographic, and geographic setting of Manamoc Island
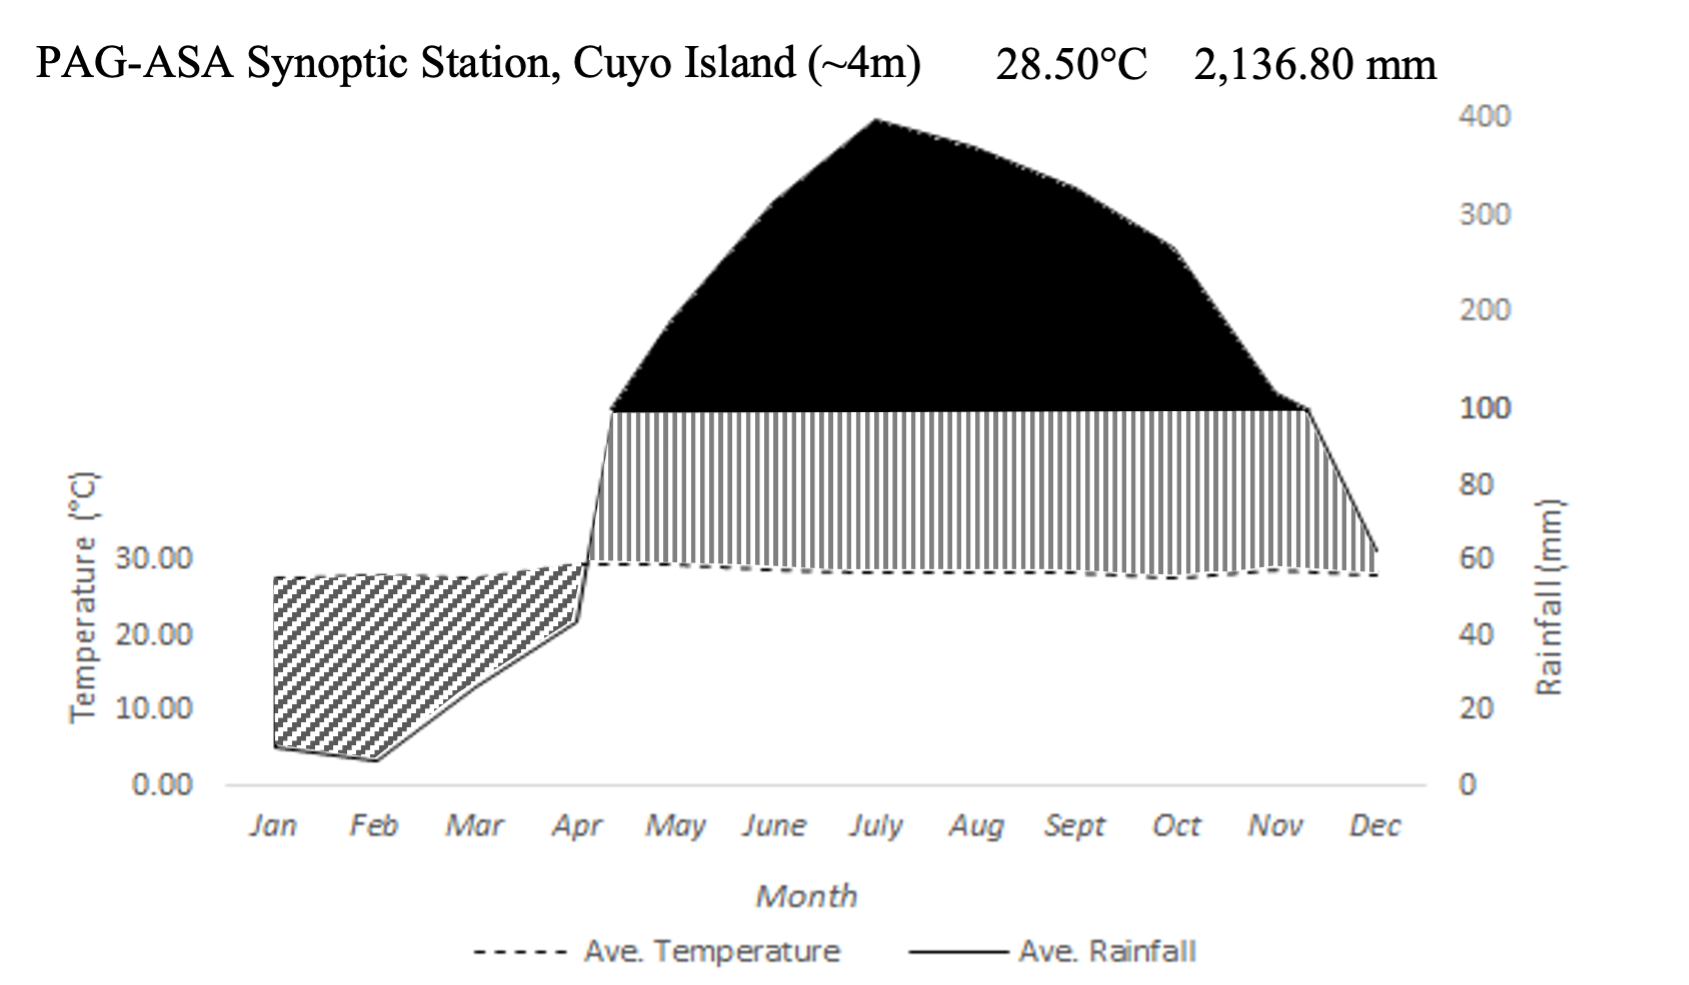
Analysis of 29-year rainfall data of the nearest PAG-ASA station in Manamoc Island shows Climate Type 1 which was characterized by a distinct dry period from November to April and the wet season from May to October as shown in Figure 4. Annual precipitation was 2,136.8mm and the average temperature was 28.5°C. Since typhoons rarely visited this part of the country, most of the precipitation on the island was brought by the southwest monsoon. The wettest month was July and the driest month was February. The hottest month was during April.
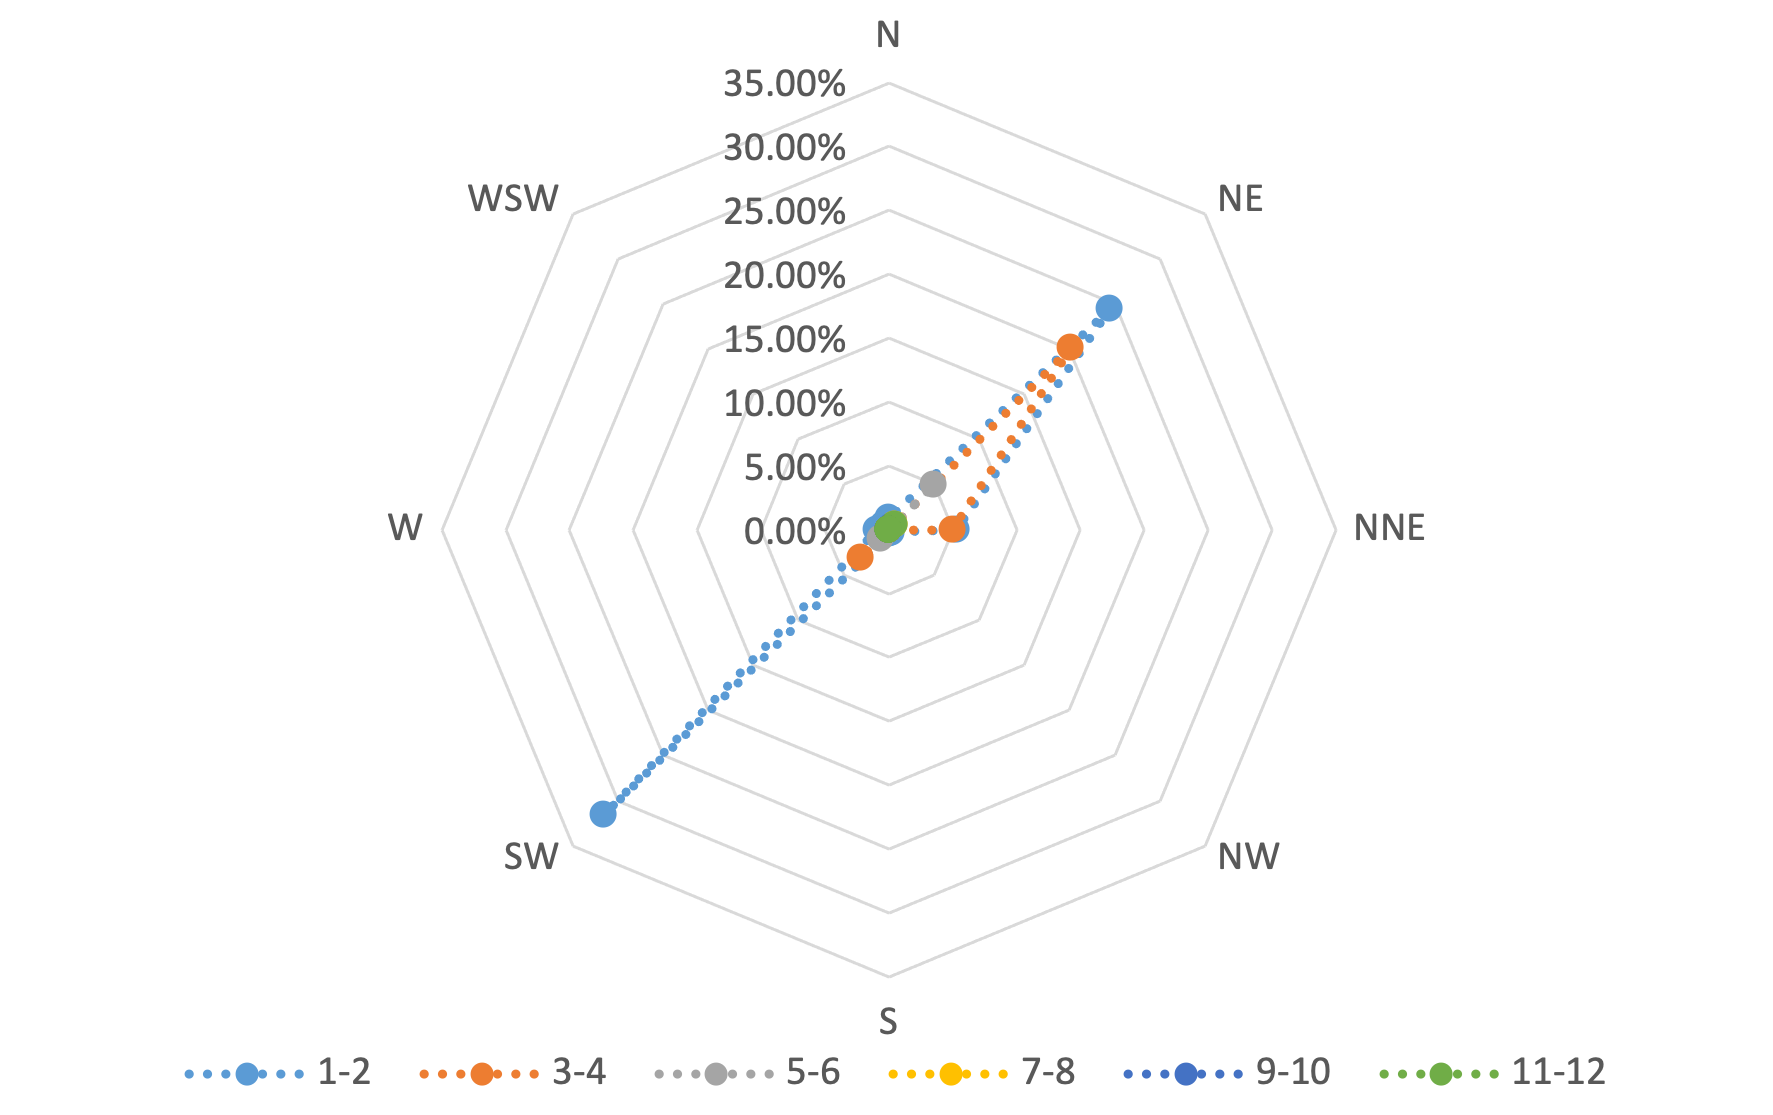
The 29-year wind data revealed that three dominant wind systems prevailed on the island: northeast, southwest, and north-northeast wind (Figure 5). Northeast was the most prevalent among the three (50.15%). Other directions of winds recorded were north-northeast (NNE) and west (W). Generally, the wind velocity ranges from 1mps to 12mps.
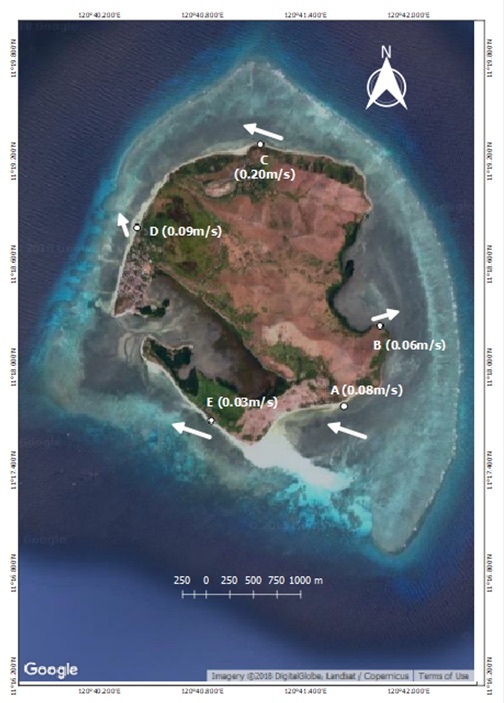
Longshore drift affecting the shoreline of Manamoc Island
One of the physical processes affecting the dynamics of the Manamoc shoreline was longshore drift. During sampling, the prevailing wind was from the northeast and the tide level was 1.07–0.24m. Results revealed that the longest average drift was in Calampisao with 0.20ms-1 going in the N-NW direction and the shortest was in Luyo with 0.03ms-1 in the same direction (Table 1 and Figure 6). This was due to the location of each site. Since Calampisao (C) was exposed to (northeast monsoon) NEM, longshore currents were also strong in this section and moving in the same direction as NEM. The implication of this was that the longshore current strengthened by NEM caused the sands in this section to be transported in the direction of NEM. Whereas Luyo was relatively hidden from the influence of NEM hence longshore current was weak in this section. Therefore, the retention time of sands was longer resulting in sand deposition in this area. Points B and D did not follow the direction of the prevailing wind which is unusual. This was due to refraction, the bending of sea waves because of the change in the water depth. As waves approach the shallow water in the nearshore area, both the speed and magnitude of the waves decrease resulting in to change in direction or bending.
| Site | Coordinates | Time | Beach orientation | Wave direction | Water depth | Average longshore drift (ms-1) |
|---|---|---|---|---|---|---|
| Paciondo (A) | 11.29587N | 7:34 am | S-SE | N-NW | 40cm | 0.08 |
| 120.6937E | ||||||
| Kanika (B) | 11.32132N | 8:17 am | E | N-NE | 53cm | 0.06 |
| 120.6856E | ||||||
| Calampisao (C) | 11.30368N | 9:22 am | N | N-NW | 45cm | 0.20 |
| 120.6972E | ||||||
| Maliwanag (D) | 11.3132N | 10:07 am | N-NW | NE-N | 25cm | 0.09 |
| 120.6736E | ||||||
| Luyo (E) | 11.29447N | 10:53 am | S-SW | N-NW | 30cm | 0.03 |
| 120.6808E |
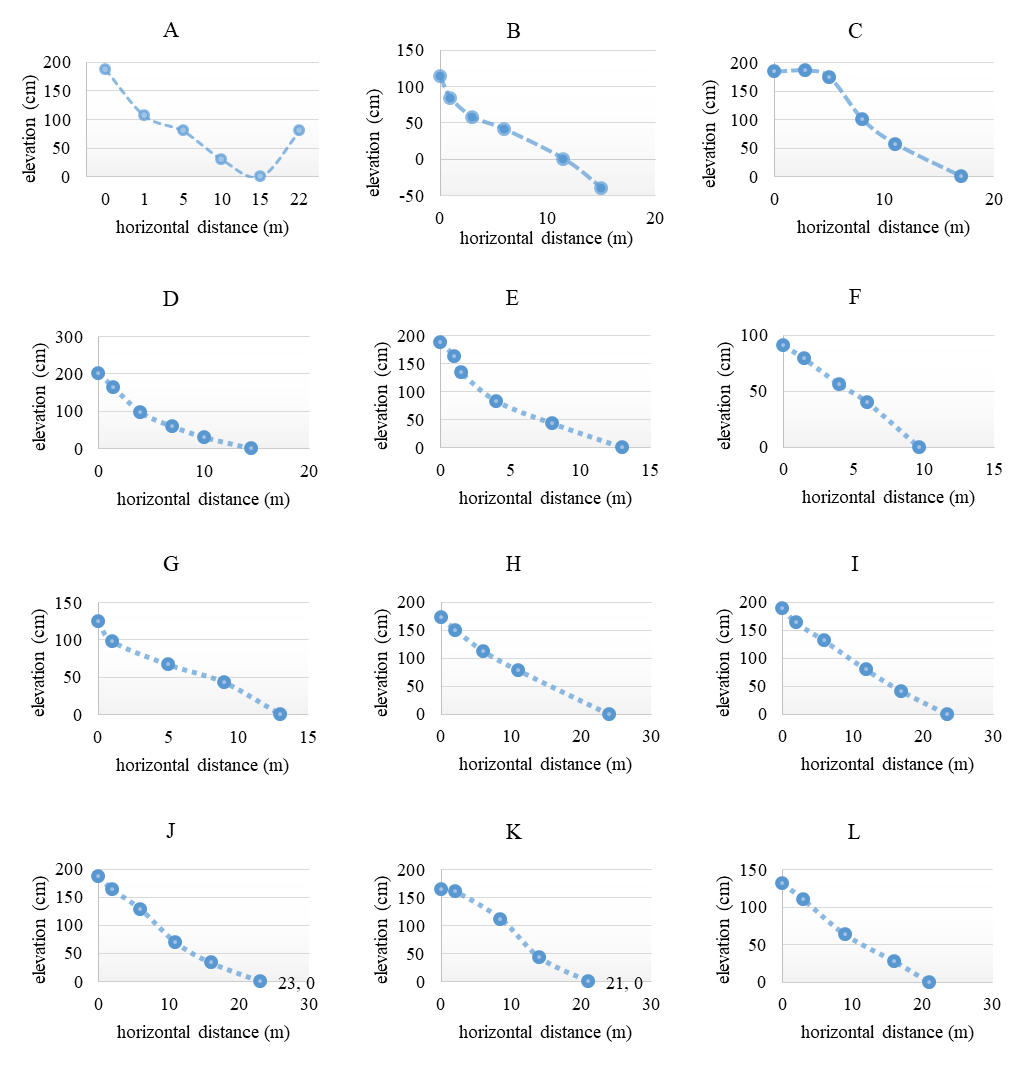
Beach profile of Manamoc Island
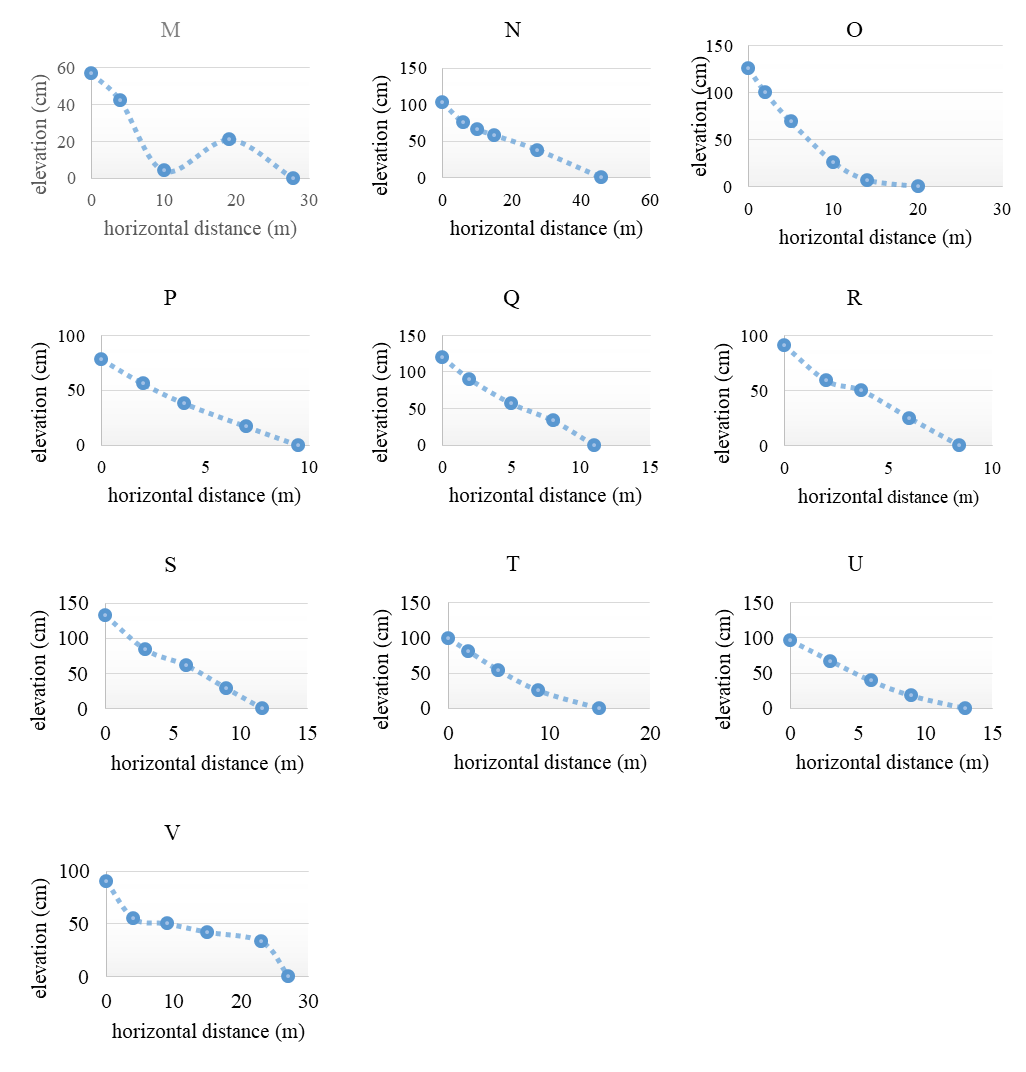
More than half of the ca. 13km shoreline of Manamoc Island is a sandy beach (Figure 7). The steepest slopes were found in Sites E and D at 14.5% and 13.8% slope respectively (see Table 2). Steep slopes indicate sand erosion. Sites D and E are facing NEM, the prevailing wind during the profiling. These sections of the beach were eroding and the sands were transported and accreting at the opposite side of the island. Most of the sites with above 8% slope (sites C, D, E, F, P, Q, R, and S) were likewise facing NEM. The remaining sites were relatively hidden from the influence of NEM. Meanwhile, the lowest slope was 2.05% found in Site M. This is a sand bar located at the southern tail-end of the island where most of the sands were deposited during NEM. Sites facing the NEM regressed during this period while the opposite sides accreted. The reverse occurred during the period of the southwest monsoon (SWM), sustaining the balance on the island’s sand budget.
| Site | Beach width (m) | Slope height (m) | % Slope |
|---|---|---|---|
| A | 22 | 1.88 | 8.55 |
| B | 15 | 1.14 | 7.60 |
| C | 17 | 1.84 | 10.82 |
| D | 14.5 | 2 | 13.79 |
| E | 13 | 1.88 | 14.46 |
| F | 9.7 | 0.91 | 9.38 |
| G | 13 | 1.25 | 9.62 |
| H | 24 | 1.72 | 7.17 |
| I | 23.5 | 1.89 | 8.04 |
| J | 23 | 1.865 | 8.11 |
| K | 21 | 1.64 | 7.81 |
| L | 21 | 1.32 | 6.29 |
| M | 27.8 | 0.57 | 2.05 |
| N | 46 | 1.03 | 2.24 |
| O | 20 | 1.26 | 6.30 |
| P | 9.5 | 0.78 | 8.21 |
| Q | 11 | 1.2 | 10.91 |
| R | 8.4 | 0.91 | 10.83 |
| S | 11.7 | 1.33 | 11.37 |
| T | 15 | 0.99 | 6.60 |
| U | 13 | 0.96 | 7.38 |
| V | 27 | 0.9 | 3.33 |
Time-series analysis of Manamoc Island sand boundary
There was a coastal retreat in the three sections of Manamoc Island: northeast, northwest, and southern beaches as revealed in the displacement of the sand boundaries from 1989 to 2016. The highest average sand boundary retreat was 64.50m at the northeast section. This beach section of the island is exposed to NEM. The lowest was 38.24m found in the northwest section. A detailed discussion follows below in the following order: northwest, northeast, and southern beach section of Manamoc Island.
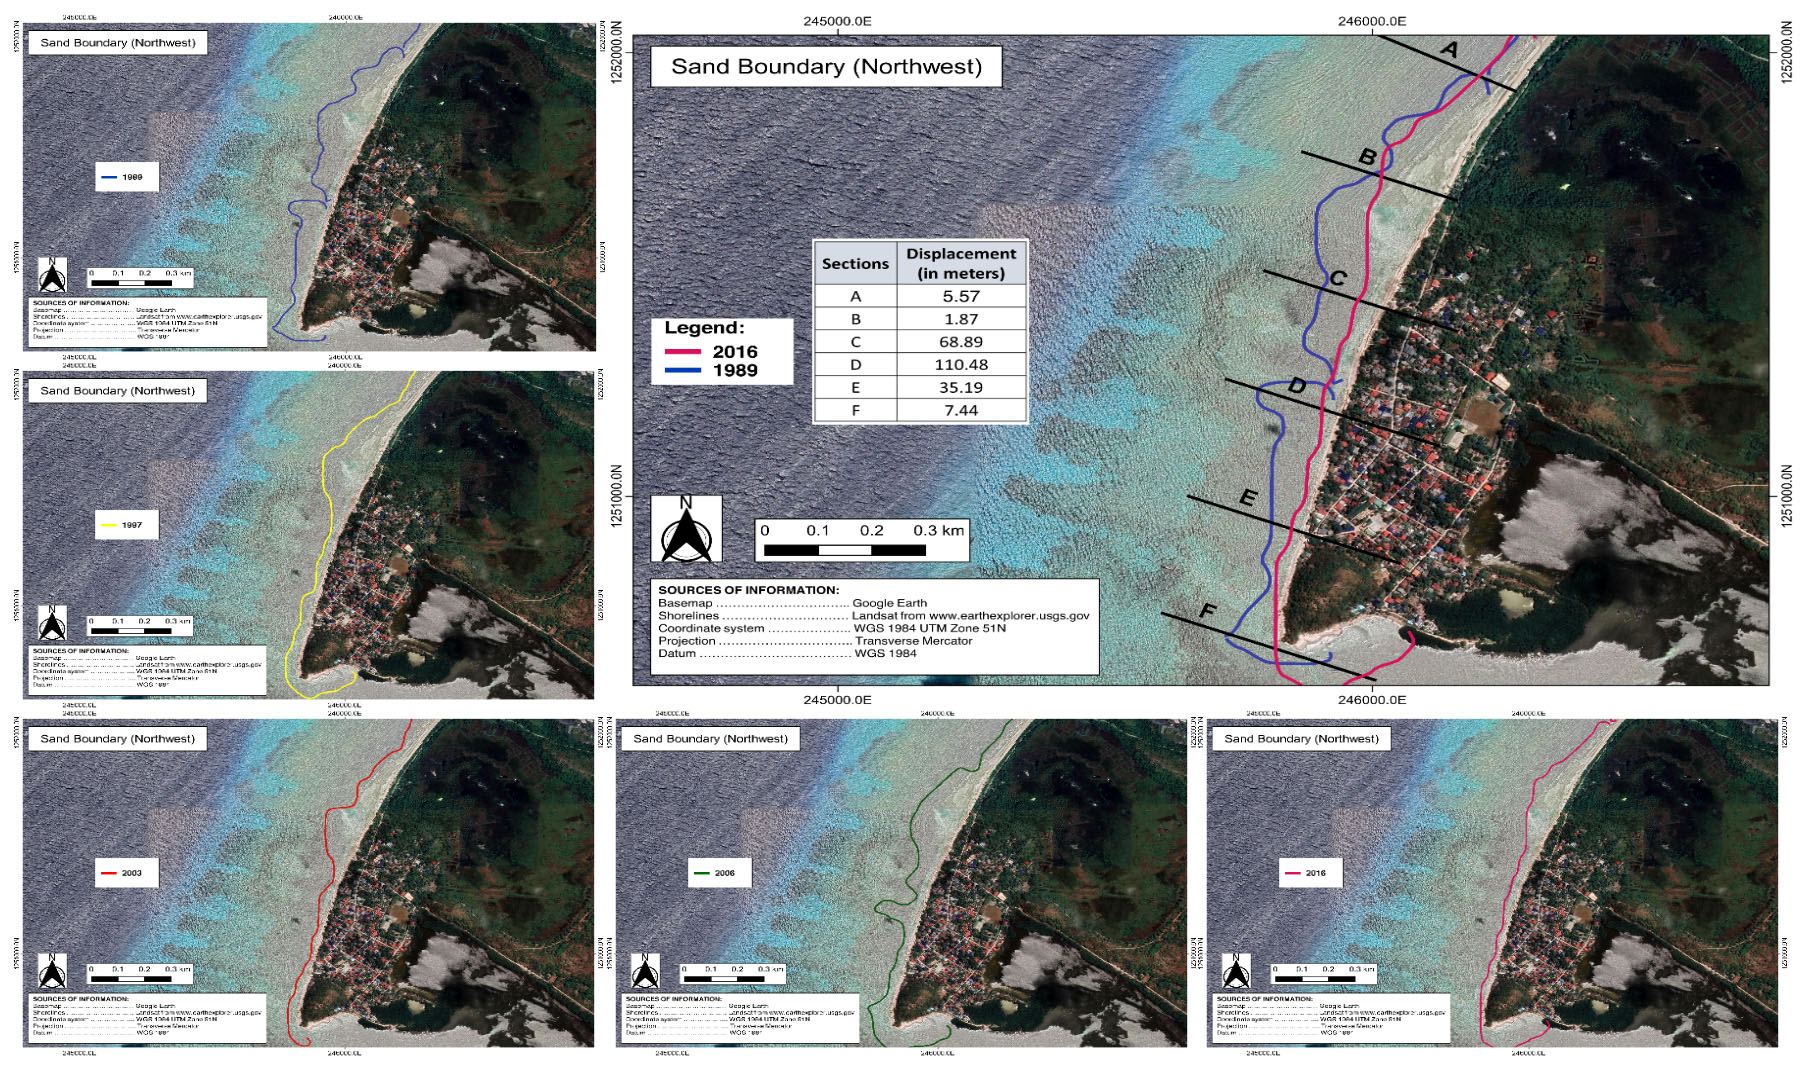
Northwest Beach of Manamoc Island
Time series analysis of the northwest beach of Manamoc Island revealed an average of 38.24m sand boundary retreat in this section of the island from 1989 to 2016 (Table 3 and Figure 7). Note that the trend from 1989 to 2016 was a mix of retreat and advanced sand boundary. From 1989 to 1997, there was an average retreat of 38.32m concerning the 1989 sand boundary (Table 3). In 2003, the average sand boundary displacement was 32.42m which means that the sand boundary advanced in 1997. In 2006, the displacement was 13.03m. This means that the sand boundary also advanced from 2003 but in 1989, it was a retreat. It was observed that 2006 had the shortest displacement from 1989 which implied the greatest advance of sand boundary in just three years. This could be attributed to the difference in time of image acquisition. Probably, the 2006 Landsat image was taken during low tide and therefore more sands were exposed hence during analysis more pixels were classified as sand resulting in the seeming advancement of the sand boundary. There may be an actual advancement of the sand boundary but the magnitude was probably lesser. Other images may have been captured during high tide therefore more pixels were classified as water. Figure 7 shows how the sand boundary advanced and retreated through the years.
| Section | 1997 | 2003 | 2006 | 2016 |
|---|---|---|---|---|
| A | 8.01 | 12.86 | 14.31 | 5.57 |
| B | 26.30 | 19.75 | 44.46 | 1.87 |
| C | 35.86 | 8.59 | 2.56 | 68.89 |
| D | 106.73 | 97.98 | 2.15 | 110.48 |
| E | 19.34 | 23.87 | 12.76 | 35.19 |
| F | 33.66 | 31.49 | 1.96 | 7.44 |
| Average | 38.32 | 32.42 | 13.03 | 38.24 |
Further analysis showed that from 1989 to 2016 there were six notable land cover changes observed involving sand (Table 4). Changed from sand to water was the highest with a staggering 81,900m2 indicative of coastal retreat. This means that 8 hectares of beach in 1989 are now submerged underwater. It can also be observed that 2006–2016 had the highest sand to water change. This was maybe due to the tides. Probably the 2006 image was captured during low tide hence more pixels were counted as the sand when compared to the 2016 image, it appeared that 12 hectares of sand became submerged underwater. Other land cover changes observed that involved sand are shown below in Table 4.
| Land Cover Changes | 1989–1997 | 1997–2003 | 2003–2006 | 2006–2016 | 1989–2016 |
|---|---|---|---|---|---|
| Water-Sand | 23,400 | 41,400 | 58,500 | 18,000 | 18,000 |
| Built-up/Soil-Sand | 11,700 | - | 6,300 | 4,500 | 17,100 |
| Sand-Water | 60,300 | 21,600 | 34,200 | 118,800 | 81,900 |
| Sand-Built-up/Soil | - | 3,600 | 2,700 | - | - |
| Sand-Vegetation | 1,800 | 9,000 | 1,800 | 8,100 | 3,600 |
| Vegetation-Sand | 12,600 | 2,700 | 15,300 | 24,300 | 16,200 |
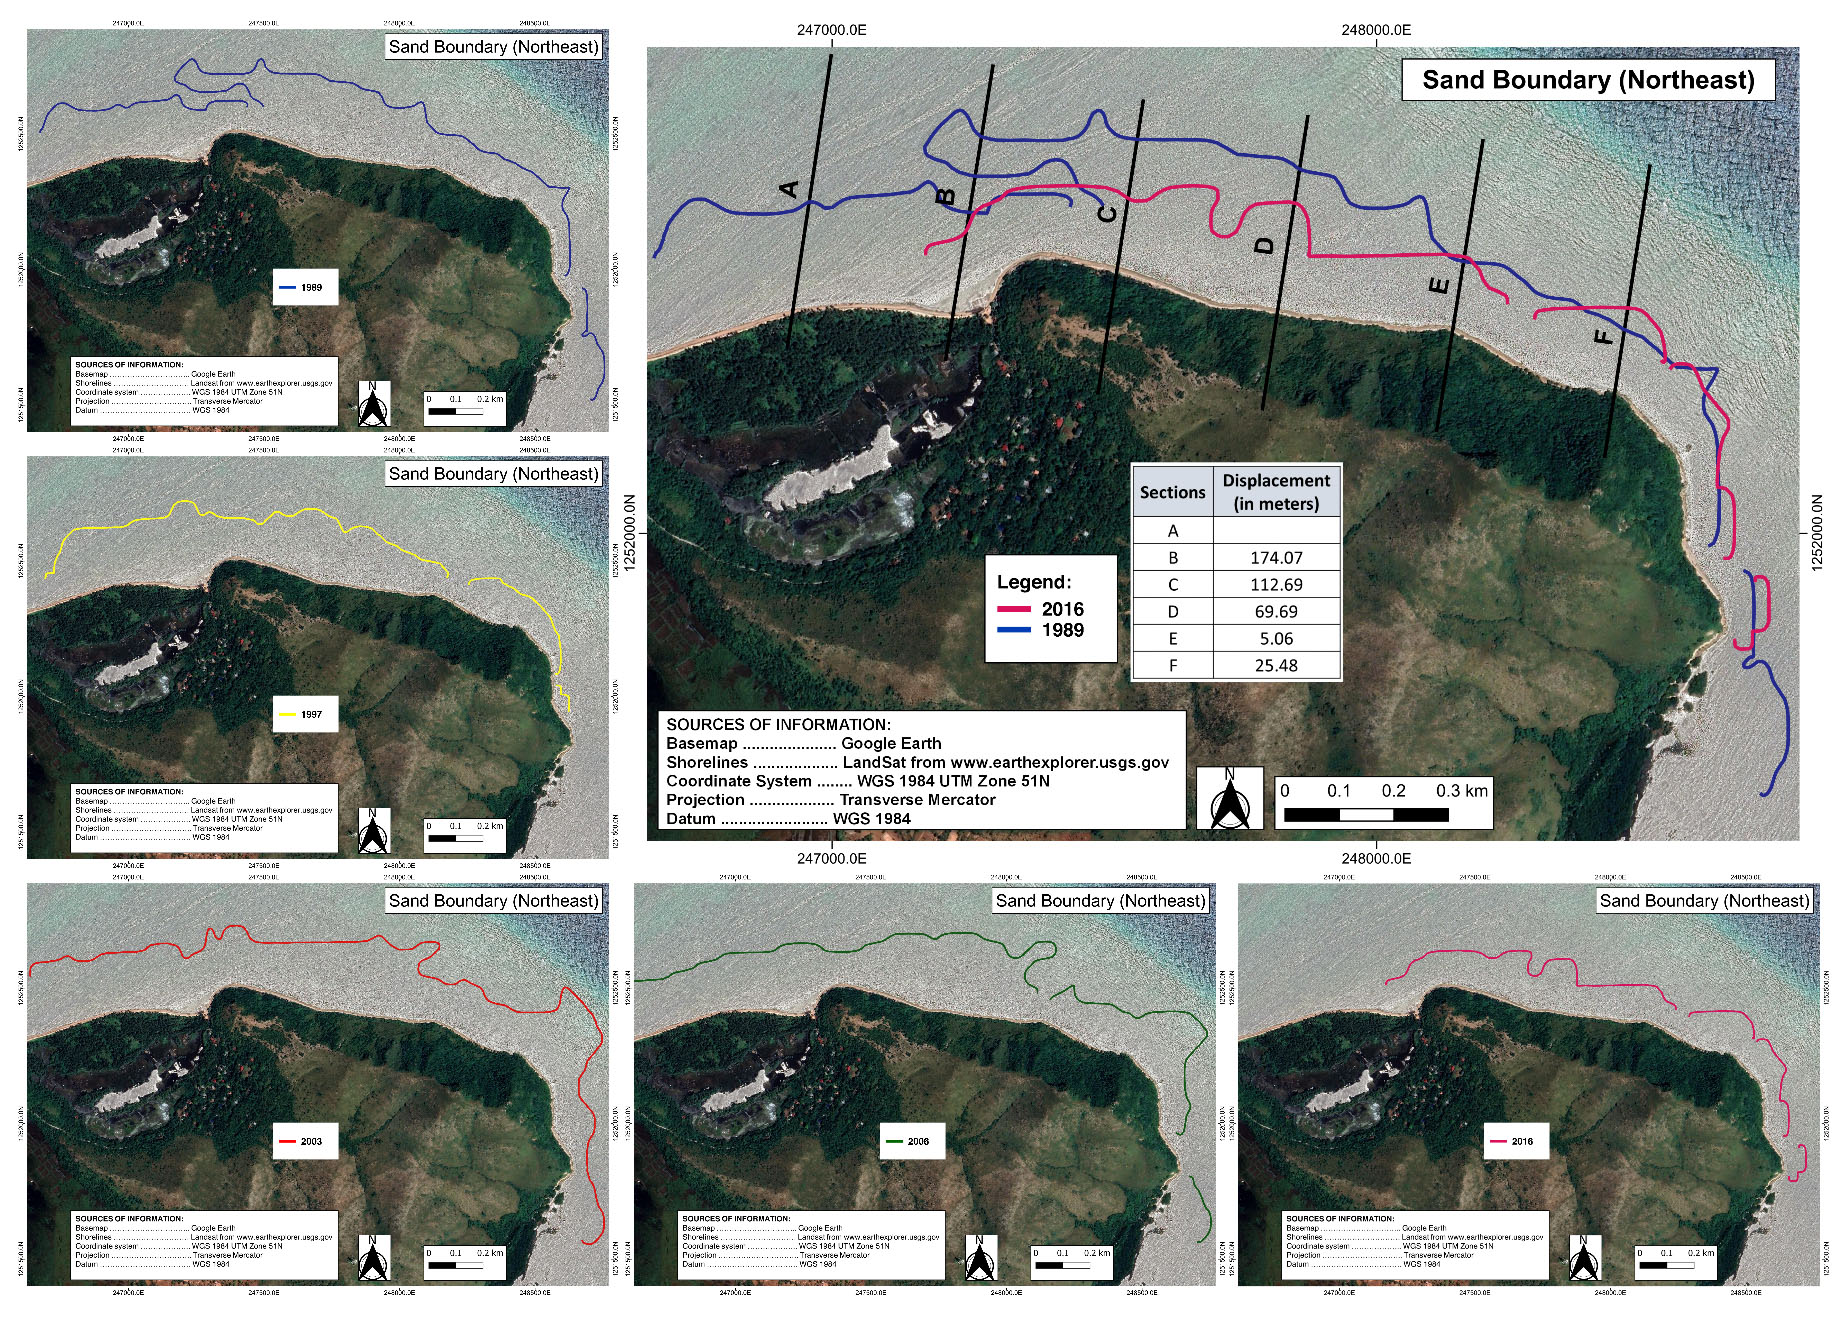
Northeast beach of Manamoc Island
An average of 64.50m sand boundary retreat was observed on the northeast beach of Manamoc Island from 1989 to 2016 (Table 5). Sand boundaries during 1997, 2003, and 2006 were all relatively closer compared to 2016 which was almost doubled. Generally, from 1989 to 2016, the trend was retreating. However, upon examining each section, the trend was a retreat and advanced sand boundary as illustrated in Figure 8.
| Section | 1997 | 2003 | 2006 | 2016 |
|---|---|---|---|---|
| A | 11.42 | 9.78 | 4.40 | 0.00 |
| B | 53.91 | 96.82 | 67.19 | 174.07 |
| C | 41.71 | 62.36 | 52.79 | 112.69 |
| D | 40.57 | 6.47 | 21.81 | 69.69 |
| E | 18.80 | 8.58 | 42.18 | 5.06 |
| F | 0.49 | 25.20 | 17.06 | 25.48 |
| Average | 27.81 | 34.87 | 34.24 | 64.50 |
Results of the land cover change analysis for 1989 to 2016 show that the largest change was from sand to water with 181,800m2 indicating coastal retreat (Table 6). This means that 18 hectares of sand in 1989 had submerged underwater 27 years later. However, the highest change observed in the sand to water was from 2006 to 2016 with 213,300 m2. This was also due to tides. The 2006 land sat image used in the analysis was probably taken during low tide therefore more pixels were classified as sand. When compared to the 2016 image, it resulted in a staggering 21 hectares of sand that seemingly submerged underwater in just 3 years. Other interesting land cover changes observed in the sand are shown in Table 6. Row without values means that such type of land cover change was not observed in that particular period.
| Land Cover Changes | 1989–1997 | 1997–2003 | 2003–2006 | 2006–2016 | 1989–2016 |
|---|---|---|---|---|---|
| Water-Sand | 26,100 | 143,100 | 66,600 | 8,100 | 11,700 |
| Sand-Water | 115,200 | 19,800 | 67,500 | 213,300 | 181,800 |
| Sand-Built-up/Soil | 900 | 900 | - | 4,500 | 6,300 |
| Sand-Vegetation | 11,700 | 1,800 | - | 45,900 | 19,800 |
| Vegetation-Sand | 4,500 | 16,200 | 17,100 | 900 | 11,700 |
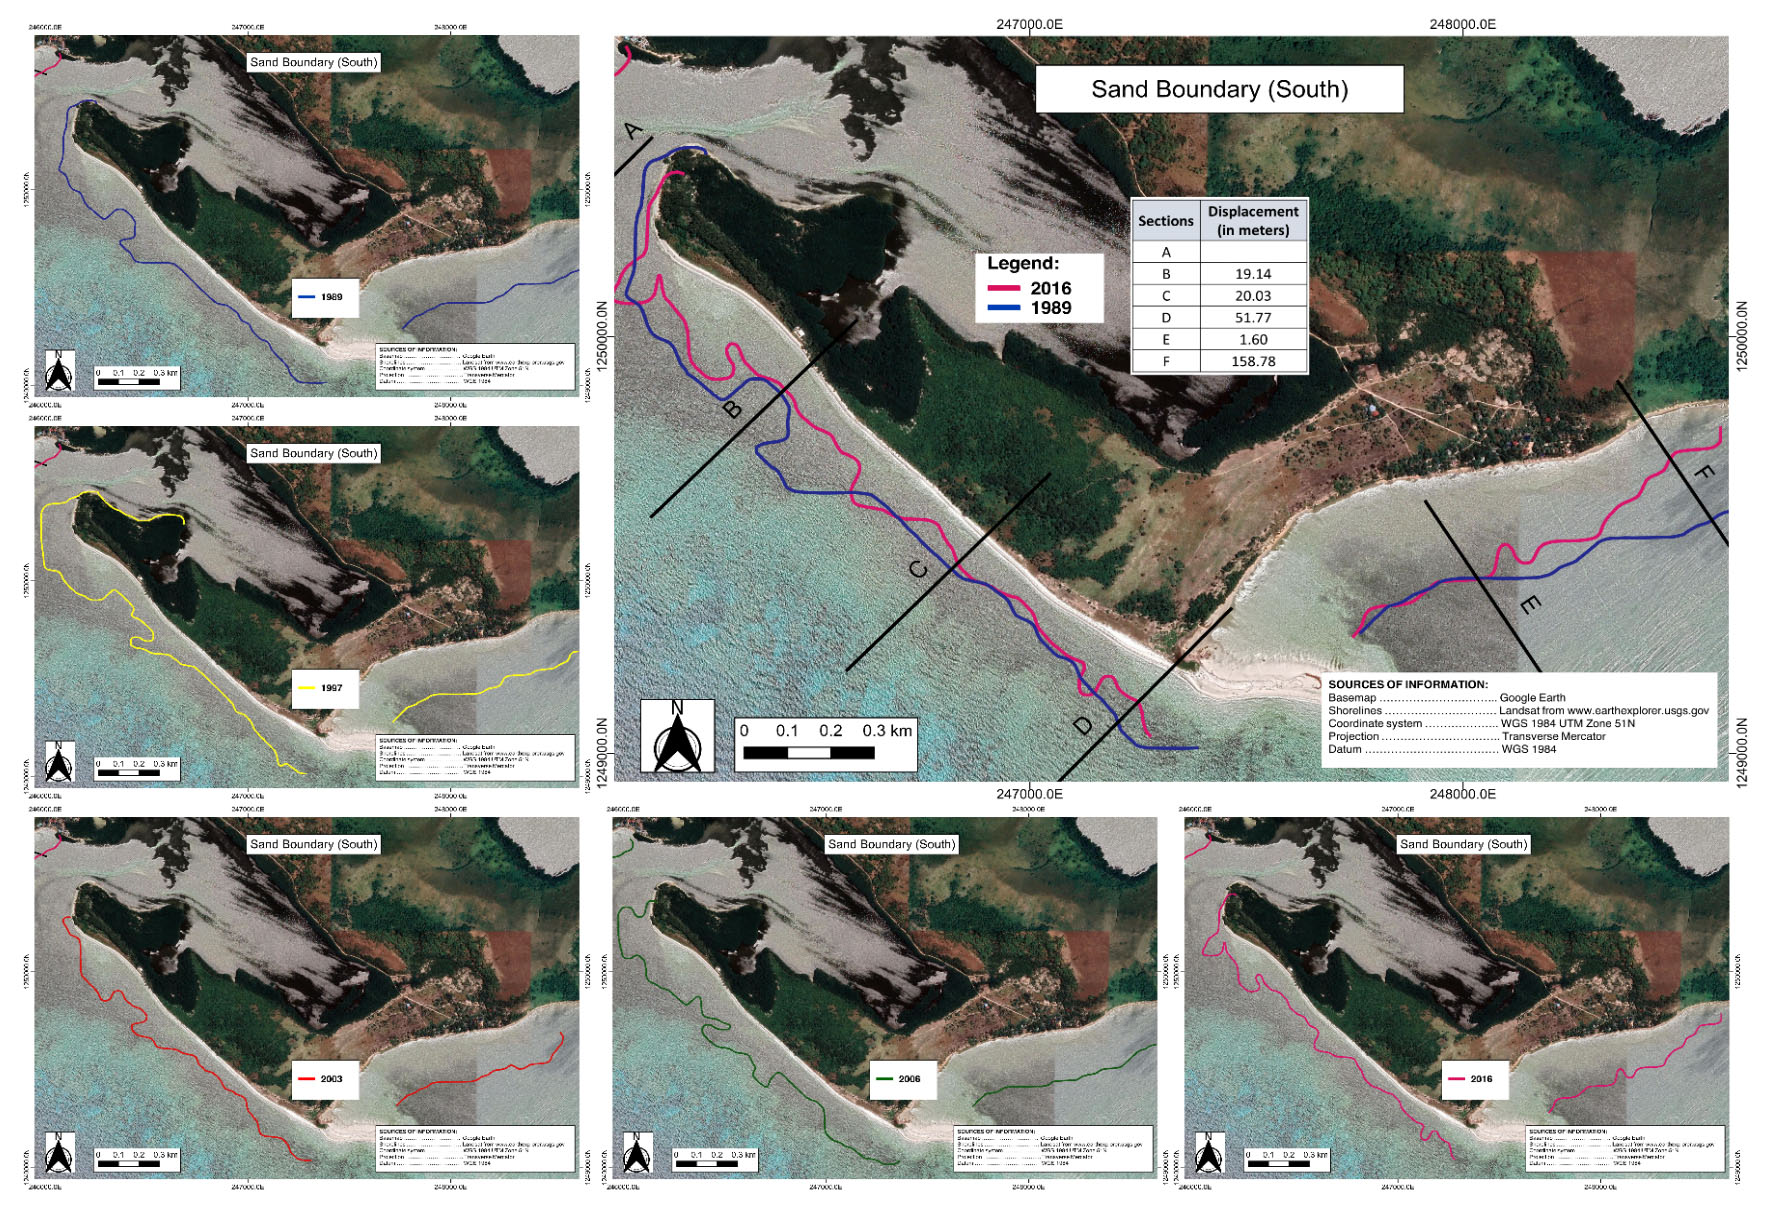
Southern beach of Manamoc Island
At the southern beach, an average of 50.3m sand boundary retreat was observed from 1989–2016 (Table 7 and Figure 9). The trend for the average sand boundary displacement implied that there was a retreat. However, similar to other sections, the sand boundary displacement oscillated implying a dynamic coastal area. This was illustrated in Figure 9. The sand bar area was not included in the analysis since sand bars are naturally dynamic.
| Section | 1997 | 2003 | 2006 | 2016 |
|---|---|---|---|---|
| B | 10.49 | 25.68 | 56.74 | 19.14 |
| C | 31.29 | 31.48 | 0.16 | 20.03 |
| D | 12.29 | 15.04 | 5.34 | 51.77 |
| E | 0.16 | 1.96 | 18.26 | 1.60 |
| F | 3.10 | 12.07 | 7.37 | 158.78 |
| Average | 11.46 | 17.25 | 17.57 | 50.26 |
Analysis of the land cover change from 1989 to 2016 revealed that sand to water change was the most remarkable with 158,400 m2 (Table 8). However, this was relatively lower compared to 2006–2016 with 353,700 m2. This was due to the difference in the time of acquisition of land sat image as explained above. Notable also was the land cover change from water to sand and the vegetation to sand. The former implied deposition of sand and the latter may imply either removal of vegetation or the deposition of sand to the vegetation. Most of the sand to vegetation land cover changes observed were attributed to the increase in mangrove cover. There was a mangrove forest dominated by the Rhizophora species located at the mouth of the lagoon colonizing the sand area. This was advantageous for Manamoc Island since mangroves trapped sands encouraging accretion. Another notable land cover change, although very small, was the sand to built-up/soil indicating encroachment in the area. Rows with no values indicated that no such conversion occurred during such period.
| Land Cover Changes | 1989–1997 | 1997–2003 | 2003–2006 | 2006–2016 | 1989–2016 |
|---|---|---|---|---|---|
| Water-Sand | 119,700 | 15,300 | 240,300 | 14,400 | 50,400 |
| Built-up/Soil-Sand | - | 900 | 900 | 14,400 | - |
| Sand-Water | 23,400 | 159,300 | 10,800 | 353,700 | 158,400 |
| Sand-Built-up/Soil | 6,300 | 3,600 | 18,900 | 1,800 | 6,300 |
| Sand-Vegetation | 19,800 | 12,600 | 23,400 | 17,100 | 42,300 |
| Vegetation-Sand | 18,000 | 9,000 | 6,300 | 32,400 | 9,000 |
Perceived natural processes and socio-economic factors affecting coastal dynamics of Manamoc Island
Results of the key informant interview (KII) were summarized into two themes: (1) Natural processes shaped the shoreline of Manamoc; and (2) Socioeconomic factors contributed to the shoreline retreat (Table 9).
Natural processes shaped the shoreline of Manamoc
This theme summarized the observations of the participants based on their experiences about how the natural physical processes changed the beach profile and the shoreline. The participants identified the various natural processes such as coastal erosion and accretion to affect the shoreline and the beach profile. These earth’s natural processes are the results of the interactions of the beach with the prevailing winds, waves, tides, and currents. These natural processes dictated the sand cycle and shaped the beach profile and the shoreline. Under this main theme are the following sub-themes: (1) seasonal change of coastline as dictated by the monsoons; and (2) hydro-meteorological hazards that caused coastal erosion.
Seasonal change of coastline as dictated by the monsoons
The sub-theme encapsulated the ideas of the informants of how the shoreline changes in shape and elevation with the monsoon. Mr. Atong, a teacher who grew up on the island, described it as follows:
“Pabagu-bago ang itsura ng baybay, dala ng panahon; kapag amihan, habagat, paiba-iba.”
(The shoreline changes frequently with seasons; as the season changes from northeast monsoon to southwest monsoon, so does the shoreline)
| Themes | Sub-themes | Key statements |
|---|---|---|
| 1. Natural processes shaped the shoreline of Manamoc | a. seasonal change of coastline as dictated by the monsoons | “The beach profile changes according to the season, northeast monsoon, southwest monsoon” |
| b. hydrometeorological hazards caused coastal erosion | “During typhoons, the impact of the sea waves are too strong; it carried away the sands offshore” | |
| 2. Socio-economic factors contributed to the shoreline retreat | a. Livelihood activities of the locals led to the destruction of natural barriers | “In live fishing, the stones along the shores that serve as barriers protecting the sands were being extracted” |
| b. Sand and rock mining propelled by improved finances | “Due to the financial improvement brought by stable income from the resort and the seaweeds, there was mass construction of concrete houses” | |
| c. physical intervention i.e. breakwater exacerbated coastal erosion | “One of the residents who built improvised breakwater experienced erosion at one end and deposition at the other end but eventually washed during a typhoon event” | |
| d. weak enforcement of laws of natural resource protection and the lack of policy to arrest coastal erosion aggravated the problem | “None were caught in action but there were plenty of mangroves illegally cut using saw” |
Like the rest of the Philippines, northeast monsoon and southwest monsoon also prevailed in Manamoc Island affecting the shape of its coastal area in particular the beach profile. During NEM, the beach profile facing NEM including those partly exposed to NEM was relatively steep because of erosion. NEM greatly influenced the longshore transport that transfers eroding sands to the opposite side of the island resulting in accretion mostly at the sand bar. At the turn of the southwest monsoon, sand transport movement also reverses.
Hydro-meteorological hazards caused coastal erosion
This sub-theme summarized the informants’ perceptions regarding how the past typhoons had affected the shoreline of Manamoc Island. Aside from monsoons, typhoons and strong waves greatly affected the sand along the beaches. Mr. Bong, a Tanod and fisherman said that:
“Lalo't pag may bagyo, malakas yung impact ng dagat. Inaagay nya yung buhangin”
(The impact of the sea waves was stronger, especially during typhoons. It carried the sands off the shore.)
Storms or typhoons generated strong waves with immense energy. The resulting backwash caused the sand to drift away offshore losing portions of the beach. In November 2013, Typhoon Haiyan (locally known as Typhoon Yolanda), the strongest typhoon of the century that had ever hit the country also passed by the Northern Palawan affecting the Calamianes and Quiniluban Group of Islands. Luckily, it was low tide when the typhoon passed by, sparing the island from greater damage. Mr. Chito, a council member, recalled his experience during Haiyan:
“Kung nagkataon na dumating yung Yolanda ng alas singko y media at malalim ang dagat, baka nagkaroon siguro ng storm surge”
(If by any chance Typhoon Yolanda hits Manamoc Island around 5:30 am, coincides with high tide, a storm surge will surely have occurred.)
Sometimes, typhoons coincided with high tides resulting in storm surges. Even if the typhoon was not very strong, it caused coastal erosion. Mr. Atong, the school teacher, recalled that:
“Kasi yung bagyong Lando hindi naman masyadong malakas ang hangin, ang alon lang talaga yung waiting shed na iyan, wasak iyan eh.”
(During Typhoon Lando, though the wind was not very strong, the waves were, destroying the concreted waiting shed.)
Sometimes about in 2010, a low-intensity typhoon hit Manamoc. The event coincided with high tide causing a storm surge and affecting all the houses and structures within the 20-30m from the shoreline.
Socio-economic factors contributed to the shoreline retreat
Another factor affecting the coastal condition of Manamoc Island was the socio-economic factor. Four subthemes arise from this main theme. These include: (1) Livelihood activities of the locals led to the destruction of natural barriers; (2) Sand and rock mining propelled by improved finances; (3) Physical intervention such as breakwater exacerbated coastal erosion; and (4) Weak enforcement of laws on natural resource protection and the lack of policy to arrest coastal erosion aggravated the problem. Some of the social and economic activities of the locals significantly interrupted the natural processes resulting in unwanted change: coastal retreat.
Livelihood activities of the locals led to the destruction of the natural barriers
This theme encapsulated the perceptions of the informants on how the social and economic activities affected the shoreline of Manamoc Island. The following economic activities have been identified to have directly or indirectly contributed to coastal erosion: fishing using different methods, gleaning, seaweed farming, and salt production.
One of the informants, Mr. Dodong, a fisherman and seaweed farmer, explained how live fishing affected the shoreline of Manamoc Island:
“yung pagbuhay-buhay, hinahakot yung mga bato sa baybay; dahil dito nawawala ang mga bato na tumutulong sa pagsangga upang hindi madala ng alon ang mga baras”
(In live fishing, stones along the shores were extracted, removing rocks and stones that served as barriers protecting the sands from being washed out by strong waves.)
Live fishing used stones and rocks collected along the shores as weights. Rocks and stones are barriers that buffer and shield the beach against strong waves. Aside from live fishing, the use of spears in fishing had an impact on coastal erosion. Mr. Chito explained how spearfishing destroyed the corals, the natural barriers against strong waves:
“halimbawa pagtilador, ag erek, hihilahin ang palaso, basag talaga. Mas importante sa kanila ang pana”
(For example, a spear shot stuck into the corals or rock crevices will be pulled forcibly, breaking the corals or rocks; the spears are more important for them.)
Another fishing method that contributed to coastal erosion was the use of fishnet. Mr. Dodong explained how even the use of fishnet damage corals:
“ang lambat kapag sumabit iyan, titirahin na lang yung corals para makuha ang lambat”
(When the fishnet got entangled with corals, they will break the corals to retrieve the fishnet)
Spearfishing and the use of fishnets can break corals making them susceptible to disease and eventually may lead to the death of corals. In addition to spearfishing and the use of fishnets were blast fishing and cyanide fishing. Although almost nobody uses these two methods nowadays, their negative impact still manifested. Fragments of dead corals washed up and piled up forming several sandbar-like on the beachfront. The locals called it napgas. Mr. Atong explained that the pile of rubbles or dead corals formed in some parts of reef flats were the result of using both legal and illegal methods of fishing, particularly dynamite fishing:
“Yun na yung pinisa-pisa ng manigpanirador, manig cyanide, manigpanti, dynamite, buhay-buhay, galing sa laot”
(Those piled rubbles were the coral fragments caused by spearfishing, cyanide fishing, using fishnet, dynamite, live fishing that were brought by the current and waves from off-shore)
Mr. Bong had a different perspective regarding the use of dynamite fishing:
“Para sa akin, mas maige pa yung dinamita pa noon ang hanapbuhay, kasi sa laot lang iyon. Hindi kagaya ng sodium na kung saan yun umabot, papatayin nya yung bato”
(For me, dynamite fishers were better, because the impact of the blast was off-shore and not near the shore. Unlike sodium cyanide which can kill corals as far as it goes.)
This may be true but all the same, both blast fishing and cyanide can kill corals. Corals were very critical for the islands’ natural defense. Corals buffer incoming strong waves generated by storms and monsoons. The loss of corals allows strong waves to directly hit the shores in full blast resulting in coastal erosion. Mr. Fred, a fisherman and seaweed farmer summarized how the destruction of corals could lead to the erosion of the shoreline:
“Kasi pagkamatay ng bahura, isa ra sa nakacontribute sa pagkabkab, pagkankan.. kasi pag wala ng bahurang haharang doon, paghampas ng alon sa baybay didiretso na lang…”
(Death of coral reefs was also one of the contributors to coastal erosion. Without the coral reefs to buffer, strong waves directly hit the shores.)
The high level of awareness and understanding of the locals on the role of natural barriers was clear. In addition to fishing, gleaning also contributed to the destruction of natural barriers and consequently to coastal erosion. Gleaning refers to the process of collecting seashells and other marine products such as sea cucumbers, sea urchins, and fishes feeding on the seagrass in reef flats during low tide. Ka Anton, as one of the leaders in the community, explained how gleaning activities damaged corals and seagrasses:
“Kapag nanginginas ka, yung iba may naapakan ka na corals, syempre marurunot iyan.. may tinabtab kang baligok, yung baryaw baryaw nasisira din, nawawala yung roots ng seagrass, isa iyan sa maagnas din yung lupa kung magkaroon ng malakas na agos”
(Other people stepped on the corals while gleaning, of course, it will break. If you cut a sea cucumber, some seagrass will be destroyed too and that is one of the causes of coastal erosion when a strong current comes in)
During the gleaning activity, corals were stepped on and seagrasses were inevitably destroyed. Seagrass, like the corals, are buffers against strong waves. Seagrass traps sediments and sand.
Aside from fishing and gleaning, salt production also contributed to shoreline regression. Mr. Atong shared his opinion on how salt production resulted in clearing patches of mangroves for salt ponds:
“Meron diyang bakaw, kaya lang nung magstart na yung seran, pinutol”
(There were mangroves in that portion, but when salt production started, they cut it.)
In salt production, patches of mangrove forest were cleared and replaced with salt pans. Mangroves help in stabilizing the shores by controlling coastal erosion and trapping sediments through their complex root system. Ms. Dina, the elementary school teacher, shared her thoughts on how the mangroves help in mitigating coastal erosion:
“Yung bakaw, siya din kasi ang kumokontrol nang pag-agnas ng lupa…”
(The mangroves also control coastal erosion)
Similarly, seaweed farming also impacts negatively the natural barriers specifically mangroves and seagrass. Mr. Fred as a seaweed farmer shared his knowledge of how the seaweed farming activities destroyed seagrasses:
“Ang kabaryaw-baryawan ay inalis para gumanda ang sibol ng tambalang; kasi pag yung tambalang, nagkakaron ng sugat yung tambalang..”
(The seagrasses were removed so that seaweeds will grow healthy. Because seagrass can cut seaweeds and this may lead to diseases.)
In seaweed farming, the seabed that provides support is softened due to constant digging for posts and stakes used in seaweed farming. In addition, some seaweed farmers illegally used mangroves as stakes or posts for their mainline. In areas with tall seagrass, seagrasses were manually removed to prevent seaweeds from getting cut or wounded by seagrass blades. Both mangroves and seagrass are natural barriers against strong waves and storm surges.
Sand and rock mining are propelled by improved finances
This theme summarized the ideas of the informants of how the improved financial capability of the community had contributed to the changes in the coastal condition of Manamoc. Improved finances changed Manamoc, physically and socially. Physical changes pertain to the building of infrastructures such as houses, a powerhouse, and roads while social changes refer to the provisions of basic social services such as schools, daycare centers, a health center, barangay hall, plaza, multi-purpose hall, and a water tank. Both of these changes demanded sand and rock mining.
Chito, the council member shared his observations when coastal erosion began to manifest:
“Napansin namin ang erosyon, matapos magbukas ang resort at nagkapera ang mga tao; kasabay nito ang pagtaas ng presyo ng tambalang. Madami ang nagpagawa ng bahay”
(We noticed coastal erosion after the establishment of the resort. The people earned much money coinciding with high seaweeds price. Many locals built concrete houses)
The financial improvement resulted from two significant economic activities: the establishment of a five-star luxury resort and the growing seaweed farming industry. In 1993, a world-class resort commenced its operation on Pamalican Island, a neighboring island under the political jurisdiction of Barangay Manamoc. This provided job opportunities and stable income to the locals and the community as a whole through the internal revenue allotment (IRA). This was followed by the growing seaweed farming industry in the area. From the mid-1990s to early 2000, seaweed farming was a growing industry in the country because of the high income generated from it. Back then, there was a high demand for seaweeds in the international market. Stable income and improved finances paved way for development not only in the local economy but in the physical and social components of the community. People improved their abode by building concrete houses. Roads and other infrastructures e.g. school buildings, a health center, a daycare center, a barangay hall, and a barangay plaza were also built. All of these developments were at the cost of the environment. Sand and rocks had to be mined and extracted from the environment and used in the construction. Due to its nature and practicality, raw materials such as sand and rocks were extracted locally. These put pressure on the natural resources that serve as natural barriers against strong waves and storm surges. As of the conduct of the study, the barangay had ongoing road concreting and seawall projects. Ironically, the seawall was meant to mitigate coastal erosion, but the construction itself aggravated the problem. The sand and rocks used for the construction were mined on the coastline of the island. Mr. Chito further explained how coastal erosion was aggravated by the development projects of the government:
“Ngayon grabe ang patrabaho, kalsada, seawall kaya nga pag may development, may kaakibat na disadvantage. Gusto nating gumanda kalsada natin, kukuha ka ng buhangin.”
(We have plenty of construction going on, road concreting, seawall; if there’s development, there is a disadvantage. We wanted concrete roads, then we have to mine our sand.)
Though the locals understand the negative repercussion of sand and rock mining, the needs of the community left them no choice. Mr. Bong explained his understanding of the role of the rocks in coastal erosion:
“Yung bato ay kumbaga suporta sa buhangin para hindi siya madala ng agos kapag high tide. Kapag wala na yung bato syempre yung buhangin patuloy na sa laot.”
(Rocks support the sand so that it will not be carried away by the ocean current during high tide. With the rocks gone, of course, the sand will be drifted offshore.)
Understanding alone the problem and mechanics of nature did not spare the environment from being exploited. The needs of the people were prioritized over the environment. The balance had been tipped over to the side of human needs without realizing that these two are coupled.
Physical intervention such as breakwater aggravated coastal erosion
This theme encapsulated the statements of the informants that physical engineering and interventions such as breakwater had temporarily held the sand but eventually aggravated coastal erosion. Mr. Chito imparted the experience of one of the residents in the barangay who built an improvised barrier to protect their house from strong waves:
“May naglagay ng bato sa palibot ng bahay pero mas lalong nakankan ang sa kabila; kay Inday Timot, breakwater, nung bagyong Lando, nasira pero ligtas naman ang bahay”
(One resident installed riprap around their house but one side eroded; Inday Timot built a breakwater, but Typhoon Lando destroyed it, although the house was safe)
The people had been experiencing coastal retreat and were threatened by it, especially the residents with houses near the shore. To save their houses and properties, the community built a riprap of about 30–50m in length on the beachfront. They observed that although sands stabilized at the backshore, the slope in front of the riprap became steep. Further, on one end of the seawall, sand is eroding and the riprap is slowly disintegrating due to the strong waves. Another resident also built a breakwater in front of their house. During an event of a strong typhoon, everything was washed out except the house. Another resident also built a different style of a breakwater. Through time, piles of sand amassed on one side but eroded on the other side. Sometime in 2014 or 2015, the barangay received assistance from the Department of Social Welfare and Development (DSWD), a government institution through its KALAHI-CIDDS program. The program aimed to provide immediate assistance to areas stricken by Typhoon Haiyan. Based on their assessment, the source of water was the most priority need of the community hence the source of water shall be protected.
From their analysis, the marshland serves as the watershed therefore it should be protected. With climate change and rising sea levels, it will just be a matter of time before the strip of land that separates the marshland from the sea will be washed out allowing the seawater to infiltrate. From this hypothesis, a seawall has become a necessity for the community. A 1.5km seawall project was implemented of which only 1km was finished as of the conduct of the study. The seawall had helped the residents in protecting their houses and properties against the strong waves and storm surges.
Weak enforcement of laws on natural resource protection and the lack of policy to arrest coastal erosion aggravated the problem
This theme summarized the opinion of the informants that the weak enforcement of laws on natural resource protection and the lack of institutional policy against coastal retreat aggravated coastal erosion. Mr. Bong shared his knowledge of the illegal cutting of mangroves happening in their barangay:
“hindi maaktuhan; nangahoy ako noong isang araw, bakaw din pero yung tuyo yung kinuha ko; marami akong nakuhang pinutol ng kabig.”
(Violators were not caught in action; yesterday, I went to gather dried mangroves for firewood. most of those I gathered were cut using a saw)
Despite the enforcement of the laws and the campaigns against the illegal cutting of mangroves, still some residents cut mangroves. There was lax implementation of the law against the illegal cutting of mangroves. There were pieces of evidence of illegal cutting and yet no apprehension was recorded. Aside from the illegal cutting of mangroves, the unregulated micro sand mining on the island was persistent. Mr. Atong explained that the unregulated micro sand mining in the barangay had aggravated coastal erosion:
“Kasi almost araw-araw kumukuha tayo ng buhangin doon, araw-araw tapos syempre nababawasan yung amount nila…”
(Almost every day, we extracted sand, of course, the sand decreases)
In an effort to lessen the impact of sand mining, the Barangay Council designated an area for sand extraction. Mr. Chito, the council member explained the side of the Barangay Council of Manamoc regarding sand extraction:
“Ang ginawa na lang, nagdesignate sila ng area na kung saan kukuha, kaya lang may mga pasaway hindi natin mahuli nag-iismug pa rin diyan.”
(What the Council did was we designated a specific area for sand mining, however, some delinquents mined sand in non-designated areas)
Aside from the sand, rocks are also being mined and used for construction. Decades ago, when the rocks were still abundant on the island, people just picked up the rocks and stones they needed for construction. However, recently, the people had to excavate big rocks for the construction. Without any other source, the people carved out the rocks on the hills. This was a dangerous move for the people as it will aggravate the problem. Ka Anton expressed his dismay over the unregulated rock extractions uphill:
“Kinukuha ang bato sa bukid, ginagamit sa seawall; samantala noon pinupulot lang, ngayon ang bukid na ang binabakat”
(Rocks are mined uphill for the seawall; Before, we used to pick up rocks but now we had to cut the hills to extract the rocks)
The illegal cutting of mangroves, the use of illegal methods in fishing e.g. sodium cyanide and dynamite, the unregulated sand and rock mining, the unregulated cutting and removal of coastal vegetation, and the unregulated use of marine resources led to the degradation or loss of the natural barriers which consequently led to coastal erosion. Regulating sand and rock mining by designating areas for sand and rock mining should be passed into an ordinance. Since the regulation was a simple agreement among the people, violators were not sanctioned. Therefore, the problems persisted.
Sand boundary displacement versus socio-economic activities and natural events
This study tried to determine the cause of the displacements observed through the historical timeline (Figure 10). The year 1989 was used as the baseline because this was the earliest available image with relatively better quality. Before this year, the following activities have occurred on the island: conversion of some parts of the mangrove forest for salt ponds; Typhoon Titang struck Manamoc Island; and the commencement of concrete construction in 1987. In 1997, over 8 years, there was a net sand boundary retreat ranging from 11m to 38m. The highest displacement was observed in the northwest section which was next to the built-up area. Within that 8 years, significant events occurred. A world-class resort started operating on the neighboring island employing the locals, therefore, improving their financial capability, in particular, building concrete houses. This resulted in intensive small-scale rock and sand mining on the island not only for concrete houses but as well as the infrastructure development in the community. Incidentally, according to the locals, the site for sand extraction was also in the northwest section of the island. By this, it seemed that the small-scale sand extraction had an impact on the sand budget resulting in an average of 38m retreat. Six years later, there was again a net retreat in the sand boundary in all three sections ranging from 17m to 35m, with the highest displacement observed again at the northwest section. Between 1997 and 2003 two crown-of-thorns (COT) outbreaks occurred. This was very significant since COT killed hard corals that served as a buffer against high energy waves. In the reef check monitoring carried out by the locals, there was a dropped in the coral cover after the event. During this period, the locals recognized the severity of the negative impact of coastal retreat. As a result, the community initiated annual mangrove planting activity and construction of the 30m riprap at the northwest beach. The sand boundary displacement in this period was relatively smaller by 4m compared to the previous displacement however note that this happened in 6 years only. It appeared that retreat was still significant since sand extraction was still not regulated and that the natural barriers have reduced. The mangrove planting in 2000 covered only a portion of the northwest section. The constructed riprap may have helped mitigate retreat in the northwest section of the island as indicated by the decrease in the sand boundary displacement from 38mdown to 34m. Note that the other two sections show retreat.
In 2006, three years later, there was a net sand boundary retreat in all three sections ranging from 13m to 34m concerning 1989. Concerning the previous year, there was accretion. Within the three years, no significant events have been reported by the locals (Figure 10). However, the previously mentioned anthropogenic activities were still on and the lost buffers have not recovered. In addition to all of these was the natural process of erosion. This was the shortest observation among the periods. For just three years, the southern section retreats at less than a meter. However, the other two sections demonstrated accretion. Partly maybe the riprap and the mangroves planted at the northwest section enhanced the sand deposition resulting in accretion.
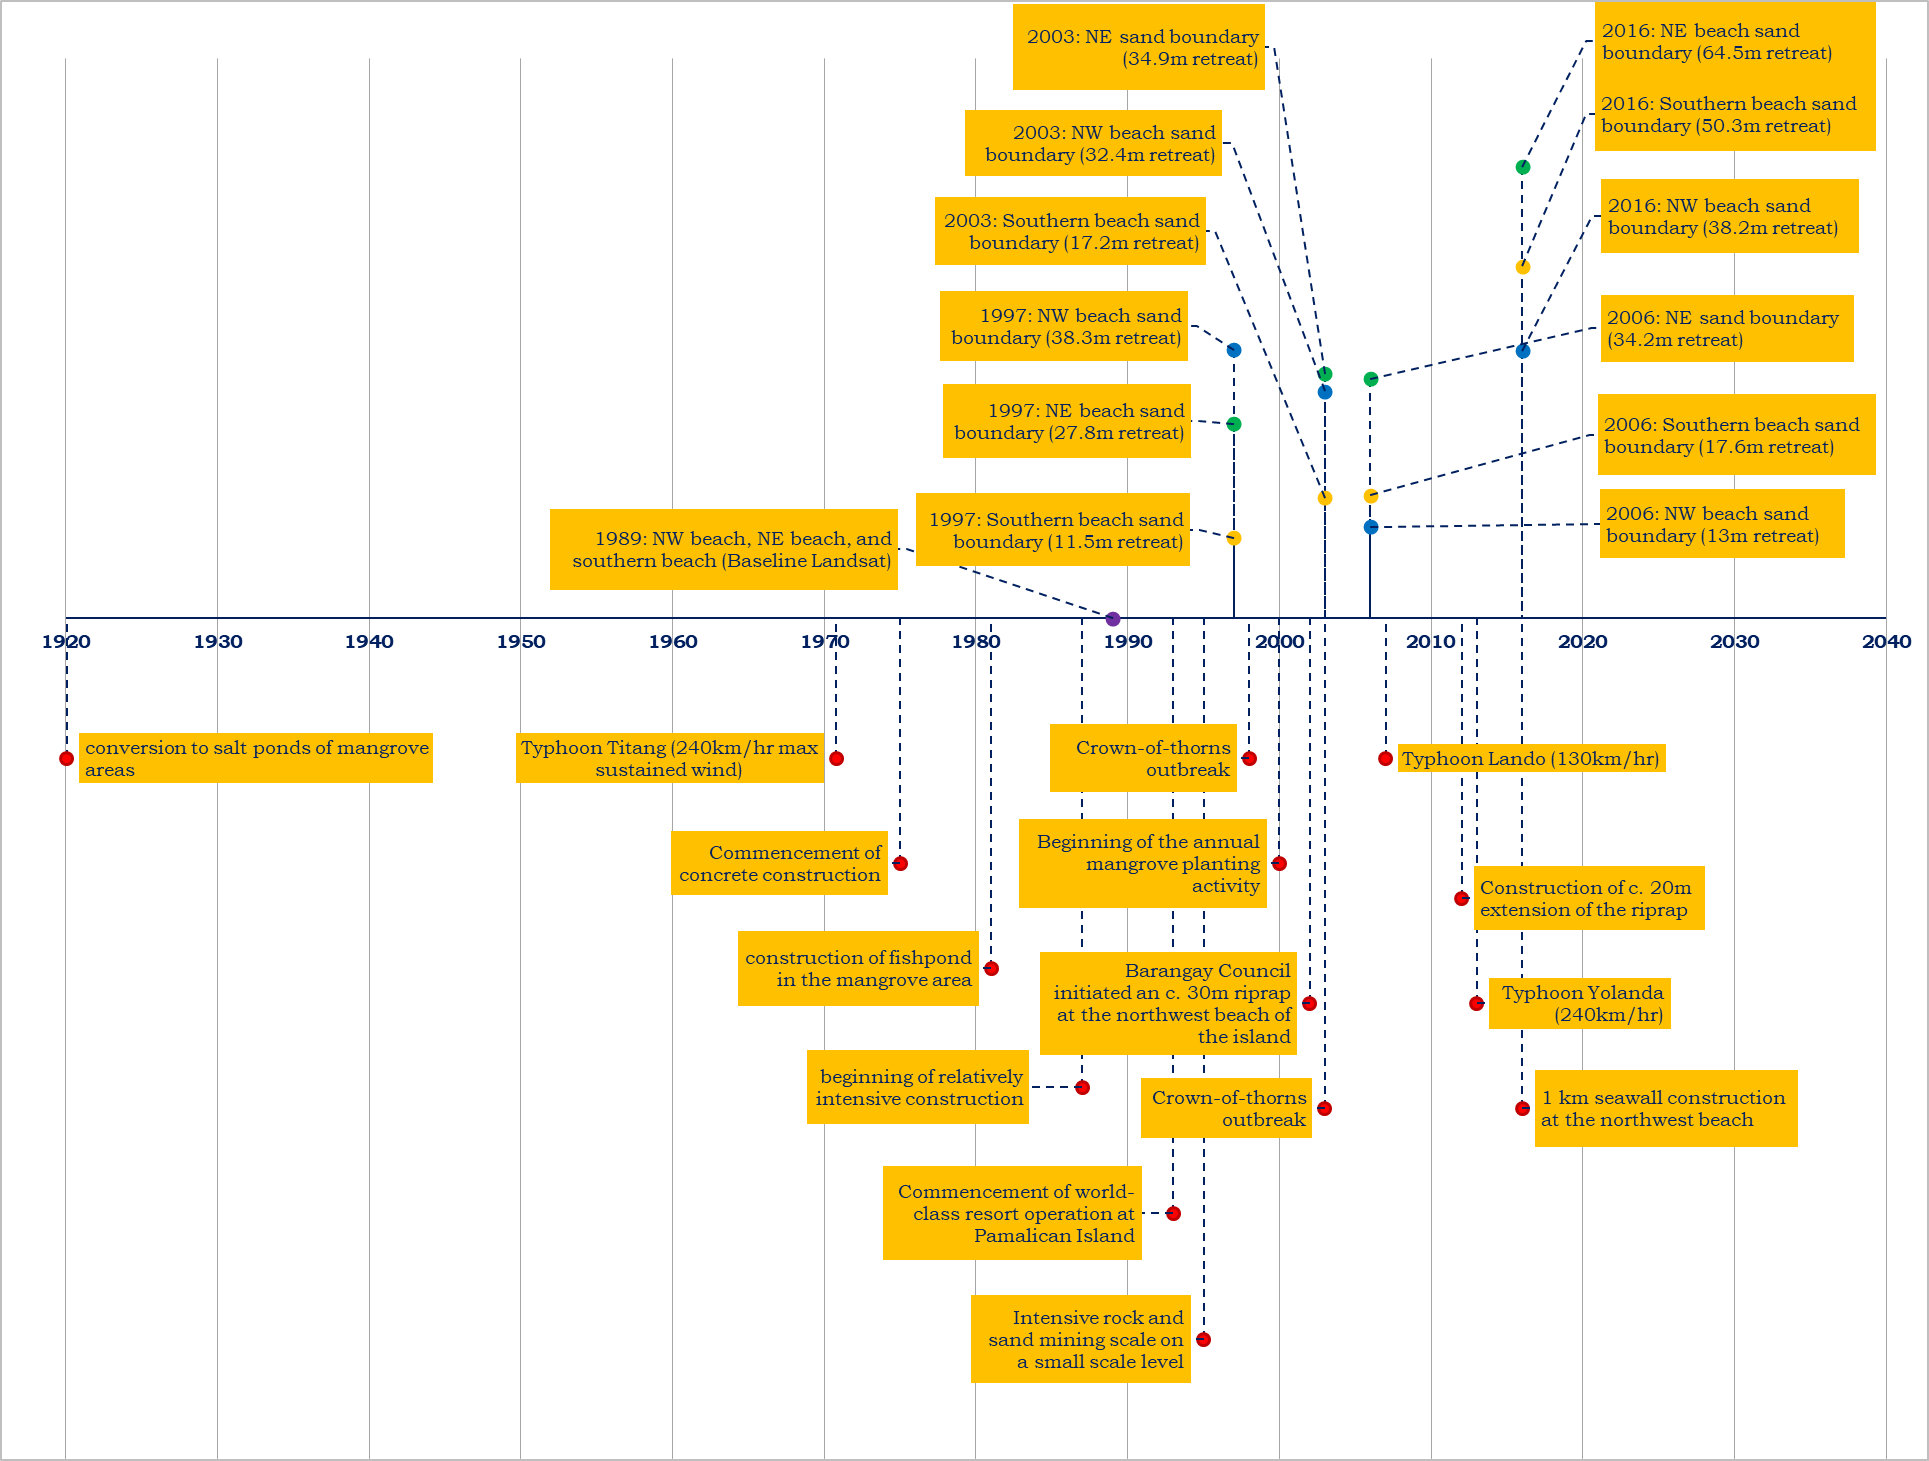
In 2016, there was a net sand boundary retreat ranging from 38m to 65m in 1989. Even without comparing to the previous period of observation, it was apparent that there was a very huge retreat. Within ten years, two typhoons hit Manamoc Island, one of which was considered the strongest to hit the country in the century. The aftermath of Typhoon Yolanda triggered the community to prioritize the protection of the shoreline. As a result, an additional 1.5km seawall was constructed in the northwest section in early 2016. The extreme events had a great impact on the stability of the sand as pointed out by Duvat (2009). Compared to other typhoons, Typhoon Lando was just average. However, during landfall on Manamoc Island, it coincided with the high tide resulting in a storm surge. Many houses were affected during that time. Typhoon Haiyan, on the other hand, generated strong winds affecting all the houses however no storm surge occurred since it was low tide therefore the beach was not affected that much.
Discussion
Shoreline retreats in Manamoc Island for a period from 1989–2016
The net displacement in the sand boundary from 1989 to 2016 indicated shoreline retreat in Manamoc Island (Tables 3–8 and Figures 7–9). However, examining further the sand boundary over a shorter period, it was apparent that the sand boundary oscillated. At some point in time, the sand boundary retreated, and at some point, it advanced just as a natural process. Maybe at some point in time, given the conditions favorable for the accretion, the sand boundary may reach or even surpass the sand boundary in 1989. Thom & Hall (1991) in their study of the behavior of beach profile in Australia observed that erosion was a more rapid process than accretion. This implied that more retreat was observed. This could explain perhaps why the Manamoc coastline retreated.
Change in the coastline is part of the geologic process and this could be either short-term which is from a few years to decades or long-term which could be hundreds of years or more (Siringan & Ringor, 1996). This study was limited only to the observation of short-term change. Among the three sections, the northwest section had the lowest net sand boundary retreat for the period 1989–2016. This seems to be better however note that this portion is also where the majority of the population on the island was concentrated. Therefore, among the three sections, this portion was also the most critical for the locals. A few meters retreat had a significant impact on the community. The locals estimated a 30m retreat in this section of the island which was coherent with the computed average displacement in the time-series analysis. Several houses were affected by the retreat. According to the locals, the lost portion used to be an area planted with coconut trees and there were few houses erected. The highest sand boundary displacement was at the northwestern beach (Table 3 and Figure 7). The retreat was almost double that on the northwest beach. Only a few households were in this area. Among the three sections, this was the most exposed to the NEM, a predominant wind in this area. It was observed that during this season the waves were relatively higher and with high energy that is capable of eroding sands. Wind speed during this time ranges from 1 to 12 mps (Figure 5). Scientific studies have already established that wind speed, wind duration, and fetch directly affect the wave height and direction. Kumar et al. (2016) reported that in the Arabian Sea, the average wave height during monsoon was 2m, while c. 0.7m during the non-monsoon period, c. 0.8m during pre-monsoon (February–May), and c. 0.6m during post-monsoon (October–January). In Southern La Union, Philippines it was observed that the predominant winds were coming from the northwest and that the dominant ocean circulation was southerly currents (a wind-driven) (Berdin et al., 2004). This clearly shows how prevailing winds affect the waves and ocean currents.
The southern beach also shows retreat (Table 7 and Figure 9). This portion of the island was relatively hidden from the influence of NEM. The mouth of the lagoon was also located in this area. According to the locals, there used to be a small sand bar adjacent to the mouth of the lagoon decades ago. Recently it was observed to be slowly disappearing due to several natural and/or anthropogenic factors (see Figure 9). Probably, this disappearing sandbar was a former spit produced from the deposition of sediments from the lagoon through the action of longshore drift, similar to Sto. Tomas spit in La Union, Philippines (Berdin et al., 2004). Probably the sand supply was cut-off and through constant actions of waves, tides, and currents it slowly eroded. Further, according to the locals, the right end (Figure 9 Section F) was also retreating which was in agreement with the results of the shoreline trend analysis. Only a few households live in this part of the island. However, this is where most of the seaweed farms are concentrated. Some seaweed farm practices include the removal of the seagrasses as these were distractive to the seaweeds’ growth. Seagrass help dampen the impact of the wave energy and therefore assisted in retaining the sand similar to the role of the corals.
Parallel to Manamoc Island is the neighboring island of Pamalican (Figure 11) which was also reported to be retreating. In the Environmental Performance Report and Management Plan (EPRMP) prepared by Seastems, Inc. (2007) for Amanpulo Resort in Pamalican Island, Barangay Manamoc, Cuyo, Palawan, the island experienced a retreating coastline as early as 1990. However, it was observed that the southern tip was accreting. It has been estimated that about 280m has been added to the length of the island due to accretion from 1990 to 2007. It was suspected that the sand deposited at the southern tip was from the other sides of the island specifically from areas exposed to the NEM. These were the same observations as in Manamoc Island.
The influence of the longshore current as affected by the prevailing winds in shaping the shoreline of Manamoc Island was very clear. This was also observed in the neighboring Pamalican Island. Since coastal dynamics is a pattern relative to geological time, the observed retreats may be part of shoreline evolution. However, the coastal retreat accelerated due to the compounding effect of anthropogenic activities in the area.
Compounding effects of natural and socio-economic factors contributed to the coastal retreat
The sand boundary displacements in Manamoc Island were due to the combined effect of natural and socio-economic factors as shown in the historical timeline analysis (Figure 10). This was also similar to the reports of Berdin et al. (2004) on the southern coast of La Union, the Philippines wherein both natural (wind, ocean current, and longshore drift)) and anthropogenic forcings (sand mining and coastal development) caused changes in the shoreline.
Natural factors include longshore currents, tides, monsoons, typhoons, and storm surges. Longshore drift is one of the natural processes responsible for sand transport. Seymour (2005) described longshore drift as the cumulative movement of beach and nearshore sand parallel to the shore resulting from the combined action of tides, winds, and waves and the shore-parallel current produced by them. The longshore drift in Manamoc was greatly influenced by the predominant wind (NE) and the shape of the island similar to La Union, Philippines (Berdin et al., 2004). This was manifested in the beach profile (Figures 12–13). The steeper profile observed in the northeast and northwest sections indicates erosion. Both sections are facing NEM. Conversely, the lower the slope, the smoother the profile indicates accretion as observed in the southern beach profile in particular the sandbar. The reverse occurred during SWM. Moreover, the accretion in the sand bar at the southern tip of the island strongly suggested that predominant wind greatly influenced the longshore drift. The experiment on longshore drift validated these claims (see Figure 6). All points in Figure 6 were exposed to NEM except point E hence the extremely slow velocity. The velocity indicated the speed and direction of the drifting sands. In this case, sands from these areas were transported downdrift towards the sandbar. Although points B and D were both also exposed to the NEM, the longshore current was affected by the refraction explained earlier. Further, the longshore current follows the contour of the island as in the case of point B where the orange moved in the northeast direction following the curve. For point D, noticed that in Figure 6, the seabed facing the northwest beach was uneven an indication of differences in depth or bathymetry. These features act like underwater headland that reduces the speed and magnitude of the wave while the waves at the deeper channel approach the beach at a faster rate causing it to bend in the northwest direction. These observations adhered to the report of Barut et al. (2004), that the influence of monsoon on water circulation was very pronounced on the western side of the Philippines.
Other natural processes affecting the beach are tides. This was best explained by the unusual observation in the longshore drift experiment in Site B (Table 1 and Figure 6) wherein the orange moved opposite to the wind-driven current. Aside from wave refraction, the retreating tide also influenced the longshore current at point B. The upper sea surface appeared to be moving along with NEM, the sea current moved opposite. Also, since the sampling area was at the near end of the embayment, the longshore current trailed the contour of the island. So generally, on high tides, more sands were subjected to longshore drift, the opposite is true during low tides.
Another natural phenomenon affecting the shoreline evolution was typhoons. Manamoc Island was relatively not frequented by typhoons compared to other parts of the country. However, when typhoons passed by, the island was greatly affected due to its small size. Passing typhoons created large waves beating the coastline of Manamoc Island and sometimes causing storm surges as have been experienced by the locals in the past years. Even with just a low-intensity typhoon or just a passing storm, if it coincides with high tide, the probability of storm surge is high and the impact was disastrous as what happened during Typhoon Lando (Figure 10). In small islands in the Indian Ocean, Duvat (2009) reported that sand drifting and sand budgets were greatly affected by the increase in storm frequency and intensity. With climate change, this is the new normal and Manamoc Island is vulnerable.
Together with the physical processes, the socio-economic factors had a compounding effect on the shoreline aggravating coastal retreat. In Manamoc, the major livelihoods were seaweed farming and fishing. Other livelihood activities include gleaning and salt production. Each of these livelihood activities had an impact on the environment in particular to the natural barriers of the island: the mangroves, seagrass, coral reefs, sand or beach, and rocks.
Mangroves were the most effective at protecting the coast under non-storm and storm conditions (Guannel et al., 2016). Fully-grown mangroves provide natural protection by acting as buffer zones during typhoons and storm surges, mitigating the erosion of shorelines and riverbanks (Cruz et al., 2011). This was similar in Manamoc Island as revealed in KII. The people had planted mangroves to mitigate coastal retreat and protect their cemetery. Even the mangrove forest that was not directly adjacent to coastal areas helped mitigate coastal erosion (Mazda, et al., 2002). Seagrasses regulate water flow and wave energy as coral reefs and mangroves do (Barut et al., 2004). However, the efficiency of protection was better when together with the two ecosystems (Guannel et al., 2016). Rocks act as natural barriers against storms and waves (Bayani-Arias et al., 2012). Sand and rocks are both natural barriers against waves and current (Berdin et al., 2004). Removal of rocks and other materials from the coast equates to the removal of natural barriers exposing the sand to waves and wind forces as what happened in San Fernando, La Union (Bayani-Arias et al., 2012). This is also happening on Manamoc Island as revealed in the KII (Table 9). Sand extraction was one of the causes of beach erosion in small island developing states (Duvat, 2009). Manamoc Island has also the same fate. The sand absorbs the impact of waves and currents and therefore removing it is tantamount to the removal of a shield. Meanwhile, coral reefs act as natural wave buffers (Berdin et al., 2004; McLean, et al., 2001) providing natural protection to shorelines (Israel, 2004). In the entire municipality of Cuyo, only Manamoc Island has a good coral cover. But based on standard criteria, its health is not in good condition and therefore not sufficient to buffer strong waves. Therefore, the removal of these barriers on Manamoc Island is disastrous as evidenced in the past (see Table 9).
Aside from the economic activities, the improved financial status of the locals triggered sand and rock mining activities. Seaweed farming and the establishment of a world-class resort on the neighboring island paved the way to the improved social and economic status of the community. Both of these increased the financial capacity of the locals. Sievanen et al., (2005) reported that seaweed farming in some areas in the Philippines and Indonesia resulted in an improvement in the quality of life. Local economic development also brought improvement of social services such as the building of schools, a barangay hall, a health center, a plaza, and road concreting, Construction is everywhere increasing sand and rock mining activity in the barangay which as mentioned previously undermines the protection of the island.
Another social activity that contributed to the coastal retreat was the construction of hard structures to mitigate coastal erosion. Some households directly affected by the shoreline changes constructed riprap and similar hard structures. These resulted to further local coastal erosion as observed by the locals. Studies (e.g. Addo et al., 2008; Bayani-Arias et al., 2012; Kermani et al., 2016; and Kobayashi et al., 2015) have shown that man-made structures such as seawalls, groins, breakwater, jetties, revetments, and the like contribute to coastal erosion. However, Tait & Griggs (1990) argued there was not sufficient evidence showing that seawalls caused erosion and that beach response to seawalls is variable and appears to be influenced by several interdependent factors. Furthermore, a review of Comfort & Single (1997) on the effects of seawalls on beaches, showed that there is no consensus on whether a seawall can actively increase or decrease shoreline recession rates. However, there are end effects of seawalls. This is when a seawall acts like a groin. There is some accretion on the updrift side but more often erosion or beach displacement on the downdrift side in the direction of wave approach (Comfort & Single, 1997). In the case of Manamoc, one end of the seawall was slowly being destroyed by the waves and tides and serving as an outlet for sand previously hold by the seawall. Breakwaters show a similar response to the end effect of seawall as mentioned by one of the informants. There is sediment accretion on the updrift side of the breakwaters and erosion on the downdrift (Sane et al., 2007).
In addition, the rock extraction propelled by the seawall construction has resulted in the overexploitation of limited rocks on the island. The people started to tear down hillsides to extract rocks for the construction exposing the soil. With the projected increase in rainfall due to climate change (Eslava et al., 2013) the locals had just increased their risk of erosion.
Coastal retreat in Manamoc Island is a complex problem emanating from different factors of different natures. Apparent here was the relationship of man to its environment. Various theories of man-environment interactions could explain the events on Manamoc Island and one of these is the Theory of Poverty, Population, and Environment (PPE). PPE asserts that population growth increases the demand and competition for resources and basic services resulting in an increasing poverty rate and eventually environmental degradation. In the case of the Manamoc community, the population was very small, but resources were relatively scarce due to its nature as an island. Since the island was geographically isolated, basic services were also scanty including government support therefore poverty was also rampant in the area. As a result, the environment was under pressure for its resources. This is where Collective Theory comes in. The tragedy of the commons explains how natural resources are being exploited. However, as complex as it is, there will be no single theory of man-environment that best explains the events. Therefore, coastal retreat should be addressed holistically. Many factors have not been included in the study such as the properties of waves, beach profile, and longshore drift during the southwest monsoon, sea-level rise, tides, and the soil parent material of Manamoc Island among others. These factors are equally important in addressing coastal retreat.
Conclusion and Recommendation
Coastal erosion is occurring in Manamoc Island as a natural process and as stated by Thom & Hall (1991), erosion was a more rapid process than accretion therefore retreat is expected as a natural process. However, due to the compounding effect of natural processes (longshore drift, monsoon, typhoons) and socio-economic activities (livelihood activities, physical development, weak enforcement of law, lack of policies addressing coastal retreat), the coastal retreat has accelerated. This posed threat not only to those living near the shoreline but to the whole community as well. The protection that the seawall provides is temporary. Through time, it can just collapse and the entire island can succumb to dreaded disaster. The island needs a long-term solution to the problem of coastal retreat, especially with the threats of climate change and sea-level rise.
For the time being, the locals may resort to soft engineering as a means to mitigate coastal retreat. Mangroves and other coastal vegetation should be planted in areas with records of coastal retreat and wherever suitable. However, with the threats of climate change and sea-level rise, it is strongly recommended that the locals should go for long-term planning of relocation to much bigger islands. Likewise, intensive IEC campaigns on coastal resource protection and reframing of the coastal resource management plan are also needed to protect the natural barriers. It is also recommended that another study be conducted with a focus on other geologic processes such as the effect of sea-level rise and tectonic activities.
Acknowledgments
The authors wish to acknowledge the support in the completion of this study of the following: DOST-ASTHRDP; UPLB Graduate School; UPLB-SESAM; Western Philippines University; Palawan Center for Sustainable Development (PCSD); LGU of Cuyo; Barangay Manamoc; The Andres Soriano Foundation, Inc.; Dr. Decibel F. Eslava and Dr. Carmelita M. Rebancos for comments; and For. Lester Ryan P. Mojica for coastal retreat analysis.
References
- Addo, K. A., Walkden, M., & Mills, J. P. (2008). Detection, measurement, and prediction of shoreline recession in Accra, Ghana. ISPRS Journal of Photogrammetry and Remote Sensing, 63 (2015) 543:558. https://www.elsevier.com/locate/isprsjprs; date accessed: August 22, 2016.
- Barut, N., Santos, M., & Garces, L. (2004). Overview of Philippine Marine Fisheries, In DA-BFAR, In turbulent seas: The Status of the Philippine-Marine fisheries. Coastal Resource Management Project (p. p. 22.31. ). Cebu City: In DA-BFAR (Department of Agriculture — Bureau of Fisheries and Aquatic Resources).
- Bayani-Arias, J. K., Dorado, M. A., & Dorado, R. A. (2012). Economic Vulnerability and Analysis of Adaptation Options to Coastal Erosion in San Fernando, La Union. JESM, 15(2): 35–49.
- Berdin, R. D., Remotigue, C. T., Zamora, P. B., & Sacat-Sta. Maria, M. Y. (2004). Coastal erosion vulnerability mapping along the southern coast of La Union, Philippines: Philippines. ResearchGate, 51-67.
- Braun, V. a. (2006). Using Thematic Analysis in Psychology. Qualitative Research in Psychology, 3, 77-101.
- Comfort, J., & Single, M. (1997). Literature review on the effects of seawall on beaches. Wellington, New Zealand: Department of Conservation Head Office.
- Cruz, E., Primavera, J., & Santos, J. C. (2011). Engineering Analysis for a mangrove planting site — towards a sustainable community-engaged coastal protection program in the Philippines. Retrieved from www.irbnet.de: https://www.irbnet.de/daten/iconda/CIB_DC26751.pdf Date accessed: August 2016
- Duvat, V. (2009). Beach Erosion management in Small Islands Developing States: Indian Ocean case studies. Coastal Processes. WIT Transactions on Ecology and the Environment, 126:149-160.
- Dyer, A. (1970). River discharge measurement by the rising float technique. Journal of Hydrology, 11, 201-212.
- Eslava, D. F., Dimalanta, C., Yumul, G. J., Servando, N., & Cruz, N. (2013). Geohazards, Tropical Cyclones and Disaster Risk Management in the Philippines: Adaptation in a changing climate regime. Journal of Environmental Science and Management, 84-96.
- Esteves, L. S. (2009). Quantifying Shoreline Changes along the Sefton Coast (UK) and the Implications for Research-Informed Coastal Management. Journal of Coastal Research, 602–606. http://www.jstor.org/stable/257.
- Guannel, G., Arkema, K., Ruggiero, P., & Verutes, G. (2016). The Power of three: coral reefs, seagrasses, and mangroves protect coastal regions and increase their resilience. PLoS ONE, 11(7): e0158094. doi:10.1371/journal.pone.0158094.
- Israel, D. (2004). Economics and environment in the fisheries sector. In DA-BFAR, Turbulent seas: The status oF Philippine marine fisheries. Coastal Resource management project (pp. 90-95). Cebu City, Philippines: Department of Agriculture-Bureau of Fisheries and Aquatic Resources.
- Kermani, S., Boutiba, M., Guendouz, M., Guettouche, M. S., & Khelfani, D. (2016). Detection and analysis of shoreline changes using geospatial tools and automatic computation: Case of Jijelian sandy coast. Ocean and Coastal Management, 132 (2016) 46–58. www.elsevier.com/locate/ocecoaman date accessed: August 22, 2016.
- Kobayashi, A., Uda, T., & Noshi, Y. (2015). Shoreline devastation of Hota coast by man-made causes. Procedia Engineering, 116 (2015) 171-178. https://www.elsevier.com/locate/procedia. Date accessed: August 22, 2016.
- Kumar, V. S., Glejin, J., Amrutha, M. M., & Singh, J. (2016). Characteristics of long-period swells measured in the nearshore regions of the eastern Arabian Sea. International Journal of Naval Architecture and Ocean Engineering 8, 312–319.
- La Putt, J. P. (1987). Elementary Surveying. Baguio City: Baguio City Research & Publishing Center.
- Mazda, Y., Magi, M., Nanao, H., Kogo, M., Miyagi, T., Kanazawa, N., & Kobashi, D. (2002). Coastal erosion due to long-term human impact on mangrove forests. Wetlands Ecology and Management, 1-9.
- McLean, R., Tsyban, A., Burkett, V., Codignott, J., Forbes, D., Mimura, N., … Ittekkot, V. (2001). Coastal Zones and Marine Ecosystems. In Climate Change 2001: Impacts, Adaptation, and Vulnerability. Contribution of Working Group II to the Third Assessment Report of the Intergovernmental Panel on Climate Change. Edited by James J. McCarthy, Osvaldo F. Cambridge, UK: Cambridge University Press, 343–379.
- Sane, M., Yamagishi, H., Tateishi, M., & Yamagishi, T. (2007). Environmental impact of shore-parallel breakwaters along Nagahama and Ohgata, District of Joetsu, Japan. Journal of Environmental Management, 399-409.
- Seastems, Inc. (2007). EPRMP Report of Pamalican Island, Cuyo, Palawan. Quezon City: Unpublished.
- Sievanen, L., Crawford, B., Pollnac, R., & Lowe, C. (2005). Weeding through assumptions of livelihood approaches in ICM: Seaweeds farming in the Philippines and Indonesia. Ocean and Coastal Management, Vol. 48 297-313.
- Siringan, F. P., & Ringor, C. L. (1996). Change in the position of the Zambales shoreline before and after the 1991 Mt. Pinatubo eruption: Controls of shoreline change. Science Diliman, 1–13.
- Tait, J. F., & Griggs, G. B. (1990). Beach response to the presence of a seawall. Shore and Beach, 11-28.
- Thom, B., & Hall, W. (1991). Behaviour of beach profiles during accretion and erosion-dominated periods. Earth surfaces and landforms, 113–127.