Using Social Network Analysis to Study Marine Protected Areas on Penghu Islands
Abstract
A major challenge for fisheries management lies in how to strike a balance between the livelihoods of fishermen and sustainable operation of the fishing industry under the impact of climate change. In the long term, important marine habitats need to be designated as marine protected areas and prevent destructive man-made activities through appropriate legislation and law enforcement to promote marine resource conservation and ecological protection.
Furthermore, marine protected areas have been recognized as the simplest, cheapest and most effective way in which to restore fishery resources and protect marine biodiversity in the future. However, the competent authorities have been unable to achieve co-management of the environment and partnerships for many years, and continue to rely on extensive integration and collaboration between governments and non-governmental organizations or individuals due to implementation-related factors such as the island society, the multiple social relationships of fishermen or residents in fishing villages, the closely related place attachment, and general xenophobia. The National Penghu University of Science and Technology established marine protected area community patrols in 2018. The patrols not only protect marine resources but also allow community residents and fishermen to build consensus among communities and reduce class discrimination against fishermen, which is in line with the sustainable planning and management strategy in fisheries of the blue economy and with the spirit of sato-umi. Sato-umi is a coastal area where biological productivity and biodiversity has increased through human interaction.
In this study, social network analysis was used to systematically analyze the process of stakeholder engagement in the co-management of conservation areas, link cross-domain recreational resources amongst fishing villages, and cultivate regional revitalization in fishing communities through the visualization of participants’ locations, interactions, and relative influence.
Keywords
MPA, Social Network Analysis, Sato-umi, Penghu
1. Introduction
Extreme climates have caused catastrophic losses in aquacultural fishery, leading to huge changes in fishery resources and Ecosystem changes. Since the 1970s, global fisheries have been affected by overfishing, environmental pollution, and habitat destruction and gradually declined, and the threat of climate change has accelerated. The depletion of fishery resources has a major impact on global fishery production, mainly through the reduction of marine primary productivity, changes in marine food webs, and changes in the distribution of fish (FAO, 2009; Sumaila et al., 2011).
Marine spatial planning (MSP) is a public procedure that analyzes and configures the temporal and spatial distribution of humans in the marine environment to implement ecological, economic and social marine governance goals (Ehler & Douvere, 2009). Under the influence of global climate change, MSP is regarded as a rational planning method with which to promote sustainable development of the marine environment. In 2014, the framework of MSP was also constructed through EU Directive 89, which requires EU member states to implement “ecosystem-based” and “stakeholder engagement” policies. Based on the comprehensive evaluation of various behaviors of the environment, industry, and human society, the conservation and the utilization of marine resources are balanced (Directive 2014/89/EU). Relevant research also emphasizes that in the MSP implementation process, in addition to the need for spatial analysis based on evidence resulting from scientific investigation, more attention should be paid to the participation of stakeholders in the public decision-making process, and the early participation and suggestions of stakeholders can be implemented, with the development, implementation, and continuous review of spatial management plans (Ehler & Douvere, 2009; Santos et al., 2016). The current management concept of the reserve has changed from the traditional top-down approach to the bottom-up policy orientation of multiple participation (Lu, 2004a).
In the past, the impression that fisheries gave to ordinary people was nothing more than the 4D factors of Dirty, Danger, Difficulty and Distance, which has long affected people’s willingness to access fisheries and work on fishing boats. Moreover, it leads to a shortage of manpower in the demand for fishery labor, which, in turn, affects the sustainable development of fishing villages. Since 107, the Department of Fisheries and the National Penghu University of Science and Technology have established a marine resource conservation area patrol team to encourage fishermen and residents to have a platform for dialog and, through the development of urban–rural exchanges in fishing villages, to increase the participation of the Penghu patrol team and move toward a protected area jointly managed by residents’ operational management goals.
This research attempts to discover the interactions and needs among the stakeholders through social network perspectives. Furthermore, it can help to clarify the social network structure, the roles of actors, and their respective opinions among the stakeholders, as well as reflecting the network’s information exchange status and its important actors. Therefore, in order to realize the ocean governance goals of MSP, it should be able to help the management organization to understand the similarities and differences between the actors in the network, their personal preferences, and action strategies from the perspective of understanding, so as to adopt more efficient discussion methods and management measures, improving the output of policies and measures and the effectiveness of partnership operations. At the same time, through sustainable fishing village development strategies, we can take root in the characteristic industrial culture of the fishing villages, promote the economic transformation of the fishing villages, as well as the urban–rural exchange and development of the fishing villages, inherit the traditional skills of the fishing villages, improve the visibility of local fishery products, encourage the return of young people from the fishing villages, and gather the consensus of the residents of the fishing village community, improving the aging and economic vitality of the fishing villages and helping them to discover local creativity.
2. Literature Review
2.1 Blue economy
The term “blue economy” originated from the concept of “blue economy” proposed by Gunter Pauli, the founder of Zero Emissions Research and Initiative (ZERI), in the book entitled “Blue Revolution” in 2010, who defined it as a kind of “blue economy department” that not only pays attention to conservation and cares about regeneration but also does not leave any waste or cause energy consumption and creates a better society with limited resources so that Earth’s ecology can achieve an environmental balance of zero waste gas and sustainable utilization and zero emissions. The economic cycle model of “Goal” is also a model of sustainability and innovation that imitates the ecosystem and reconstructs the current business model. In 2011, the Pacific Small Island Developing States (PSIDS) defined the blue economy as a new technology based on the foundation of green growth, and which applies to the oceans. In 2012, the Partnerships in Environmental Management for the Seas of East Asia (PEMSEA) defined the blue economy as a type of application of “new technologies based on the foundation of green growth in the oceans” with innovative financing mechanisms and forward looking. The economic model of institutional arrangement is aimed at protecting coasts and oceans and, at the same time, strengthening the potential contribution to sustainable development, including enhancing human well-being and reducing environmental crises and ecological scarcity. Compared with the green economy, which is a new economic form that is market-oriented (based on the traditional industrial economy), developed for the purpose of harmony between the economy and the environment, and is produced and manifested by the industrial economy to meet the needs of human environmental protection and health — a state of development, the blue economy is a sustainable circular economy constructed on the basis of environmental sustainability. At the same time, it further extends and emphasizes symbiosis, sustainable growth, high-quality society, and recycling within the ocean — the spiritual meaning.
The blue economy is based on the marine recreation industry, supplemented by the developmental foundation and advantages of primary and secondary industries such as fishery and aquatic processing. Tourism is currently an important sector in many small island developing states, accounting for approximately 30% of the total employment and up to 50% of the GDP. Coasts and oceans have considerable economic potential, but climate change and ocean pollution are their potential threats. If the tourism industry continues to grow, it will rely more on sustainability of the environment. For this reason, the United Nations Conference on Trade and Development (UNCTAD) supports that small island developing states and other developing countries can use ecotourism to obtain more economic benefits from the sustainable use of natural resources. Because Taiwan is surrounded by seas, it has the conditions and value with which to develop a blue economy. It hopes to increase local development and improve regional economic benefits.
2.2 Marine Spatial Planning
In the context of the increasing impact of global climate change and the rapid growth of human demand for marine space, e.g., energy, transportation, fishery, recreation and aquaculture, marine spatial planning (MSP) is defined as a set of applications used in marine governance. The planning method of marine governance takes into account the two aspects of “ecosystem-based” and “stakeholder engagement,” and plans for the spatial suitability of natural resources in the marine environment and human use behavior to coordinate existing or future conflicting use behaviors (Ehler & Douvere, 2009). A connotation of MSP is that of understanding the operation of the ecosystem through scientific investigation, as well as incorporating the positions and expectations of stakeholders through the process of political participation. Following the participation of stakeholders, the power and management measures for the protection and utilization of different marine resources are coordinated to achieve the ecological goal of economic and social sustainability (Young et al., 2007; Ehler & Douvere, 2009; Halpern et al., 2012).Coastal management has invariably been a key feature of various countries’ ocean policies, and is mostly that of long-term promotional work, with the overall developmental direction being guided by policies. With the current fierce competition among countries in the maritime economy, countries are actively accelerating the promotion of MSP-related activities to ensure their competitiveness and status in international maritime development. In 2006, the United Nations Educational, Scientific and Cultural Organization (UNESCO) organized the first international seminar on marine spatial planning and mentioned that MSP is a necessary tool for marine management based on the marine ecological environment system (Douvere & Ehler, 2007; UNESCO, 2006).
2.3 Stakeholders
In order to systematically analyze the process of stakeholders’ participation in the co-management of conservation areas, it is first necessary to understand the development of fishing villages and the concerns of local residents, rather than the “top-down” planning and management methods. The promotion of sustainable local development requires various joint participation, planning and management of “interested parties” such as governments, agencies, businesses, private organizations, tourists, and local communities.
A stakeholder refers to an individual, group or organization that has an interest in and appeal toward a plan during planning or implementation. “Important stakeholders” refer to those who have influence or importance with regard to the success or failure of the implementation of a plan. “Stakeholder analysis” is concerned with identifying important stakeholders, evaluating their interests and interest claims, and evaluating whether these interest claims have a positive or negative impact on the success or failure of a project. The purpose of stakeholder analysis is to provide a systematic framework with which to help planners or managers to design and establish appropriate stakeholder participation models and partnerships (Li and Wang, 2003).
The results of stakeholder analysis can allow reviewing the deficiencies of an existing public participation mechanism and serve as a reference for the further design of new public participation forums. The final results of “stakeholder analysis” are based on the “importance” and “influence” of each stakeholder.
The so-called “influence” of a stakeholder refers to the power that the stakeholder possesses in promoting or obstructing the achievement of an activity or project goal; the so-called “importance” of a stakeholder refers to the granting of the rights — the priority of the related person to satisfy his interests and interest demands.
2.4 Data Analysis and Benefit Evaluation
“Common planning theory” was mainly established by British environmental planning theorist Patsy Healey. In recent years, it has been widely discussed and criticized by the British planning and geographical circles. Healey’s joint planning theory is a normative planning theory whose purpose is not only to help us to analyze the current situation but also to guide the future. Its main argument comes from Giddens’ (1984) theory of structuration and Habermas’ (1984) theory of communicative action. It regards the environmental planning and management process as a way in which to promote partnerships, establish new institutional forces (social processes of institutional capacity), strengthen the resilience of all stakeholders in the face of new environmental challenges, and promote sustainable development of the overall environment. Healey (1998) used the three elements of establishing institutional power — intellectual capacity, social capacity and mobilization capacity — as the three criteria for evaluating the improvement of institutional power.
3. Research Methods
Social Network Analysis (SNA) is a method of further analyzing and explaining relevant data collected by researchers to clarify the relationship structure between various actors. Therefore, social network analysis can quickly and clearly describe the location and influence of the actors in a network. This study intends to use SNA to first explore the relationship between the sources of innovation in the industrial innovation system and then construct the blue ocean economic industry innovative system network architecture.
Since SNA is used to analyze the relationship between actors in a network, the data collected by the researcher must concern the relationship between the members of a network. This research is intended to be conducted via a focus group approach. Therefore, the arrangements must be made through the interviewees confirming all members in the network, and through collecting information on the relationship between each member.
In order to achieve the purpose of this research, the network density index in social network analysis will be used to measure the degree of interaction between the sources of innovation in the blue economy industrial innovation system. The calculation method of network density is such that if D represents the average strength of connections in the network, then \(\sum Zij\) refers to the total number of connections between \(i\) and \(j\), and \(N*(N-1)\) refers to the number of all possible connections in the network. The closer the value obtained is to 1, the closer the relationship between each other.
$$ Density = \sum Zij/N*(N-1) $$
In addition to using the network density to measure the degree of interaction between the sources of innovation, this study will use the degree centrality index to calculate the degree of connection between the sources of innovation in the network to measure the status and power of the sources of innovation in the network. As for the formula with regard to degree centrality, take \(C_D(n*)\) to represent the largest degree of centrality in the network, subtract the sum of the values of the centrality of each member (\(C_D(n_i)\)), and divide by the maximum possible degree of centrality of this network immediately. The higher the value of the degree of centrality, the higher the position of the source of innovation and the greater the power that it possesses.
$$ Degree\ Centralization = \sum_{i=1}^{g} [C_D(n*)-C_D(n_i)] / Max \sum_{i=1}^{g}[C_D(n*)-C_D(n_i)] $$
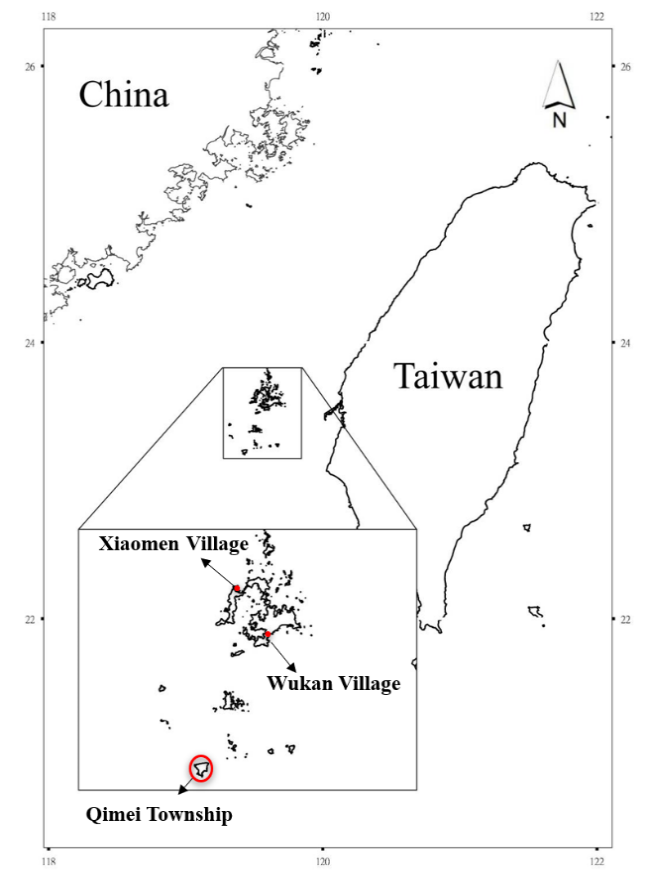
This study uses the focus group method as the method of data collection. There are seven interviewees from the patrol team leader and members of Xiaomen Village, eight interviewees from Qimei Township, and six members of Wukan Village. Collaborative meetings were undertaken to discuss different topics between December 2018 and December 2019 to examine the relationship among the subjects. Moreover, social network analysis was used to convert the interview data into matrix relationships, using analytical indicators to calculate them and then graphic theory concepts to analyze them, in order to explore the actual implementation of the protection area and the blue ocean following the formation of the patrol team, as well as the direction of economic creation.
4. Results and analysis
This research uses the concept of social networks, adopts UCINET 6 software, integrates the Net Draw program and draws a social network diagram to measure the strength of the network connection relationship between the patrol team members in the Xiaomen, Qimei and Wukan Resource Conservation Areas, as well as cluster analysis results and each information transmission direction in order to understand the opinion leaders in the group and the direction of future development. The following is a network diagram of related topics throughout the matrix table.
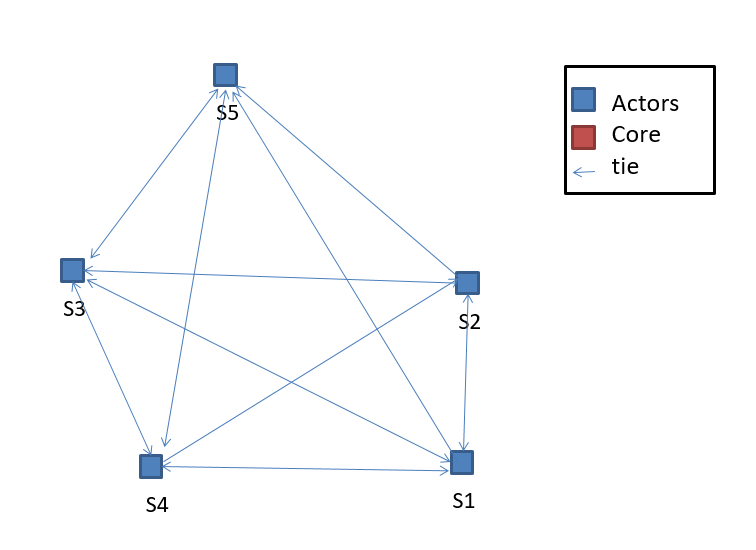
As shown in Figure 2, the patrol team members have arrows pointing toward one another, and the network density is 1. This may be because several of them are relatives who live together. S2 has a relatively close relationship with them, and is more thoughtful. S5 and S3 can also present ideas about the future of the conservation area. S1 is a short-term member but can also discuss with other members. It is shown that the relationships among them are well; therefore, the network is relatively decentralized.
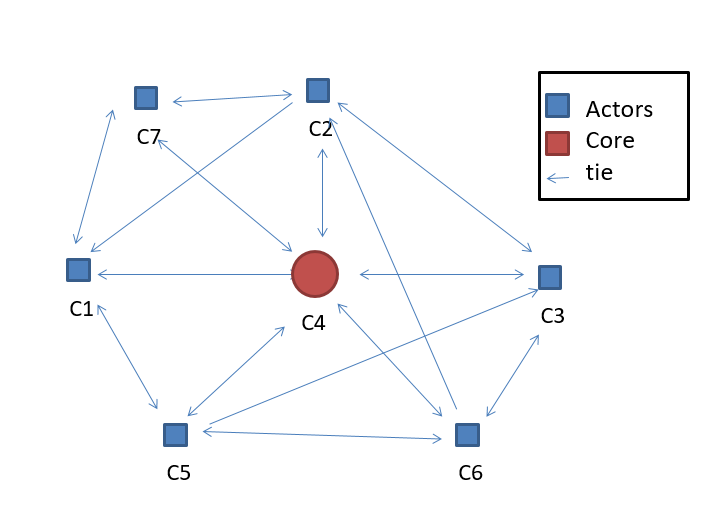
It is shown in Figure 3 that the issue surrounding future development of the blue economy of the Marine Resource Patrol in Qimei was initiated. The metropolis triggered responses from other members and formed multiple mesh cores, i.e., a multi-core mesh structure. At the same time, the matrix table was further penetrated. The social network indicators were analyzed to understand the degree of influence among the members. The network density is 0.6429. As shown in Figure 3, most of the members share with C4 and discuss their ability to take care of Qimei’s blue economy. With regard to ideas for the conservation area, C4 will also convey information or opinions to other members, and the diagram shows that each member of Qimei interacts quite frequently with the others, with almost all members’ ideas being exchanged amongst one another. The degree of network centralization is 13.33%, and the number of times that C1, C2 and C3 receive and send messages is also very high. Therefore, it can be shown that the degree of centralization of the team is low, which also means that the opinions or ideas of each member in Qimei are different. The need for a separate leader to lead everyone may be due to the difference in the nature of the original work, with each having expectations and an imagination in relation to the patrol team. What is more, the higher the network density of the team, the higher the degree of interaction that each member has with the others.
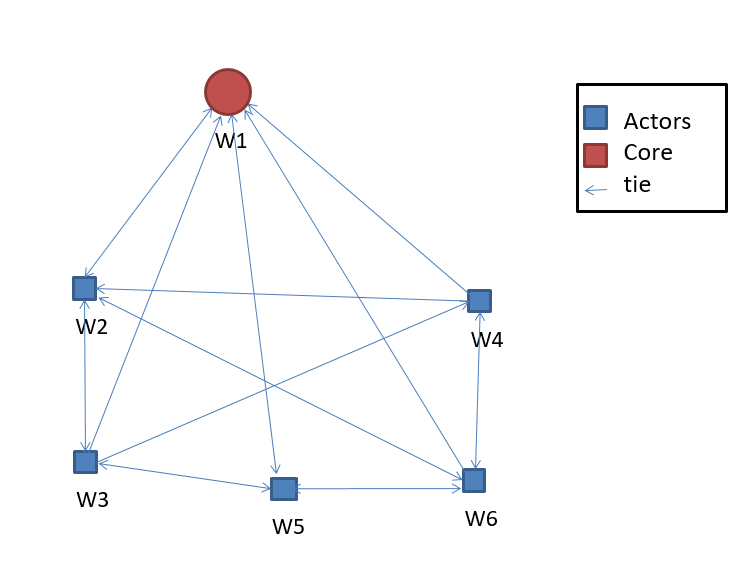
As shown in Figure 4, it can be observed from the social network of the Wukan Patrol Team that the network density is 0.8. This team has a high degree of discussion surrounding the current implementation effectiveness of the protected area and the future direction. From Figure 4, it seems that they may be long-term, familiar partners, communicate well with one another, and have an opinion leader (W1) who can integrate everyone’s opinions, and that everyone is connected to one another, trusts one another, supports one another’s arguments, and there is no individual or only individual connection, individual to individual. They all appear to have connections and cooperate with one another.
5. Conclusion and Suggestions
Regarding the community patrol team’s suggestions for improving the current results, for the future direction, and for the areas that need to be improved, the content is explained as follows:
- Strengthen the organization: all of the patrol team members agree that this work item is voluntary and unpaid, but hope that they will be commended and rewarded based on the number of services or on special performance. The winners can visit Taiwan to communicate with the conservation patrol community. More community activities should be organized in order to improve the concept of conservation of community residents or attract more people who agree to join the patrol team.
- Strengthen functions: training for underwater personnel, license training and legal training, and guiding patrol team members to obtain the relevant tourism licenses to facilitate the transformation of the community into a tourism industry in the future.
- Governmental actions: there should indeed be the advocacy of marine knowledge and concepts for the intertidal zone, the combination of natural landscapes and professional knowledge, and an educational nature and tourism development. This will also assist the growth trend of post-conservation rehabilitation, strict controls, an increased frequency, quantity and rehabilitation of releases, starting with local residents and school children, enriched knowledge of marine life, and the maintenance and management of the conservation area.
- Improve the economy of the local community: the income from sightseeing activities should be given back to local residents, and the conservation area should be assisted in increasing the restoration of species so that the conservation area can expand its scope, increase the diversity of species, and continue the sustainable development of marine ecology.
This study suggests that the establishment of community patrol teams in Xiaomen Village, Qimei Township, and Wukan Village to protect fishery resources can not only effectively bring about habitat conservation and maintain biodiversity but also take into account the economy of the fishing villages and gradually bring youth back to the villages. Through the building of knowledge and technology regarding the tourism industry in the blue economy, community residents, tourism experts, marine tourism operators, etc. interact through the mechanism of social networks to form a sustainable management network of marine resources, gradually developing island ecotourism and pesca-tourism to achieve sustainable development of the blue economy.
6. References
- Cheung, W. W. L., Sarmiento, J. L., Dunne, J., Frölicher, T. L., Lam, V. W. Y., Palomares, M. L. D., Watson, R., Pauly, D. 2013. Shrinking of fishes exacerbates impacts of global ocean changes on marine ecosystems. Nature Climate Change 3: 254-258. https://www.nature.com/articles/nclimate1691
- Dai, C.-F., 2017, Impact of climate change on Taiwan’s marine environment and corresponding strategies, National Development Blueprint under Climate Change, National Taiwan University Publishing Center, 163-176.
- Douvere, F. M., A. Vanhulle and J. Schrijvers. 2007. The Role of Spatial Planning in Sea Use Management: The Belgian Case. Marine Policy 31:182–191.
- Ehler, C. and Douvere, F. 2009. Marine spatial planning: a step-by-step approach. Paris, France, Unesco, 2020/6/2 doi.org/10.25607/OBP-43
- FAO , 2009. Climate change implications for fisheries and aquaculture: Overview of current scientific knowledge. FAO Fisheries and Aquaculture Technical Paper 530, 2020/6/20 https://e-info.org.tw/node/223513
- Habermas J. and McCarthy T, 1984. The theory of communicative action. Reason and the rationalization of society 1: 457-465.
- Halpern, B. S., Diamond, J., Gaines, S., Gelcich, S., Gleason, M., Jennings, S. & Napoli, N. 2012. Near-term priorities for the science, policy and practice of Coastal and Marine Spatial Planning (CMSP). Marine Policy, 36(1), 198-205.
- Healey, P. 1998. Collaborative planning in a stakeholder society. Town planning review, 69(1), 1-21.
- Giddens, A. 1984. The Constitution of Society. Cambridge: Polity Press.
- Li, G.-Z and Wang X., 2003, Action Research Framework for Establishing a Community Participation Mechanism for Sustainable Management of Natural Resources, Hualien: Environmental Education Symposium.
- Lu, D., 2004. The development of community conservation in Taiwan-an analysis of three domestic cases in recent years. Geographical Journal of National Taiwan University 37: 1-25.
- Santos, C. F., Agardy, T., Andrade, F., Barange, M., Crowder, L. B., Ehler, C. N., Orbach, M. K. & Rosa, R. 2016. Ocean planning in a changing climate. Nature Geoscience, 9(10), 730.
- Shao, G.-Z., Marine Protected Area-Current Situation and Challenges in Taiwan, 2020, Environmental Information Center, 2020/6/5, taken from: https://e-info.org.tw/node/223513.
- Sumaila, U.R., W. W. L. Cheung, V. W. Y. Lam, D. Pauly, S. Herrick, 2011. Climate change impacts on the biophysics and economics of world fisheries. Nature Climate Change, doi:10.1038/NCLIMATE1301
- UNESCO & Intergovemnmental Oceanographic Commission(IOC), 2006, Report of the First International Workshop on Marine Spatial Planning,: VISIONSFOR A SEA CHANGE. https://www.mspglobal2030.org/resources/key-msp-references/visions-for-a-sea-change/
- Young, O. R., Osherenko, G., Ekstrom, J., Crowder, L. B., Ogden, J., Wilson, J. A., ... & Halpren, B. S. (2007). Solving the crisis in ocean governance: place-based management of marine ecosystems. Environment: science and policy for sustainable development, 49(4), 20-32.