Optimizing mangrove conservation efforts with improved understanding of phytosociology-ecology synergy in Sri Lanka
Department of Convergence Study on the Ocean Science and Technology, Korea Maritime and Ocean University, Busan, Republic of Korea.
Department of coastal and marine resources management, Ocean University of Sri Lanka, Colombo, Sri Lanka.
ahalyaa@ocu.ac.lk
Department of Convergence Study on the Ocean Science and Technology, Korea Maritime and Ocean University, Busan, Republic of Korea.
School of Earth and Environmental Sciences & Research Institute of Oceanography, Seoul National University, Seoul, Republic of Korea.
Abstract
The study aimed to understand the forest structure and ecological factors influencing mangrove distribution in eight mangrove forests across three climatic zones in Sri Lanka. We studied mangrove diversity and vegetation structure with 10m wide belt transects laid of different lengths (n=96) across the land-water gradient. Mangroves along the transect were identified, enumerated, and measured diameter at breast height (DBH). Subsurface water samples were taken in the adjoining lagoon/estuary to assess the environmental parameters (n=144), and water quality parameters were measured. Site-dependent spatial changes in the community structure were depicted through cluster analysis (CA). The forest survey revealed a heterogeneous mixture of 20 true mangrove species across the sites dominated by Avicennia, Rhizophora, and Sonneratia spp. Among the several environmental parameters analyzed by the distance-based redundancy ordination analysis (dbRDA), salinity, dissolved oxygen, and precipitation were found to be controlling factors in mangrove community structure. In addition, discriminant analysis confirmed the presence of ecological-phytosociological influence on mangrove assemblages identified through CA. The significant structural parameters tree density, and taxonomic diversity when tested using the canonical analysis of principal coordinates (CAP), altered the species abundance across the sites surveyed. The results suggest that there is a strong linkage between phytosociology and ecology with the mangrove forest distribution and this relationship needs to be considered wisely to fortify successful restoration practices.
Keywords
Mangroves, Sri Lanka, Ecology, Phytosociology, Restoration, Conservation
Introduction
Mangroves are tropical, salt-tolerant forests inhabiting the intertidal zone at the interface between the land and sea, (Duke, 1992) that tolerate high salinities of seawater and high concentrations of interstitial bio toxins (Li & Lee, 1997) and are resilient along the coastline. Salinity is among a series of factors (e.g., stand age, nutrients, and oxygen levels) determining the occurrence of individual mangrove species, assemblages, and species abundance in the mangrove forests (Sandilyan & Kathiresan, 2012). As such, a species zonation pattern emerges. Inhabiting the saline environment, mangroves have different morphological and physiological characteristics to cope with harsh environmental conditions (Hilaluddin et al., 2020). Mangrove species are uniquely adapted to existence in the intertidal zone, with specialized root, leaf, wood and reproductive morphology and physiology to cope with and exclude salt, and for stabilization in unstable sediments under tidal action (Jones et al., 2014; Perera et al., 2013; Reef et al., 2010). Mangrove species are phylogenetically diverse (Cheng & Hogarth, 2001; Lavieren et al., 2012), and despite inhabiting a narrow, stressed niche space, species exhibit greater functional diversity in these traits than may be expected (Rodríguez-Rodríguez et al., 2018). Even though mangroves are well known for their wider variety of ecosystem services, their range that benefit coastal communities and mangrove-associated biodiversity depends on patterns of productivity, biomass and forest structure (Morrisey et al., 2010) which is related to external variables including climate, geomorphology, topography, and hydrology (Chen & Twilley, 1999). Organism-level traits and interactions, such as physiological processes and competition, have profound effects on community composition and dynamics (Feller et al., 2010) however, this approach has rarely been used to explain structure and function of mangrove forests (Berger et al., 2008). Despite their ecosystem services, they face massive threats with increasing human population growth that results in increased reliance on mangrove products and loss of mangrove area for human habitats, industrial and urban development, puts their future at risk (Ellison, 2001; Dahdouh-Guebas, Van Pottelbergh, Kairo, Cannicci, & Koedam, 2004).
Sri Lanka enjoys a wide array of coastal ecosystems such as mangroves, coral reefs, salt marshes, and sea grasses, since it covers a total brackish water area of about 158,016 ha (Prasanna et al., 2019). Sri Lankan mangroves are unique yet are not distributed evenly throughout the island. As the tidal amplitude is as low as 75 cm (Katupotha, 2016), (Karunathilake, 2003), mangrove distribution tends to exhibit a narrow and seldom displays a scattered forest patch (Ellepola & Ranawana, 2015). Sri Lankan mangroves are often understudied and underrepresented in the conservation agenda (Arulnayagam, 2020). Wider scope of the knowledge on Sri Lankan mangrove flora and fauna species composition and distribution has not been documented cohesively, despite great that progress has been achieved during the past decades. But with the past decadal influence on shrimp farming (Jayasindera et al., 1999) and urbanization (IUCN, 2010) mangroves are being lost at an unprecedented rate in Sri Lanka (Kaleel and Nijamir, 2017; Katupotha, 2016). Hence potential science-based studies are required to promote conservation and drafting policy briefs to ensure their sustainability.
Materials and methods
Study area
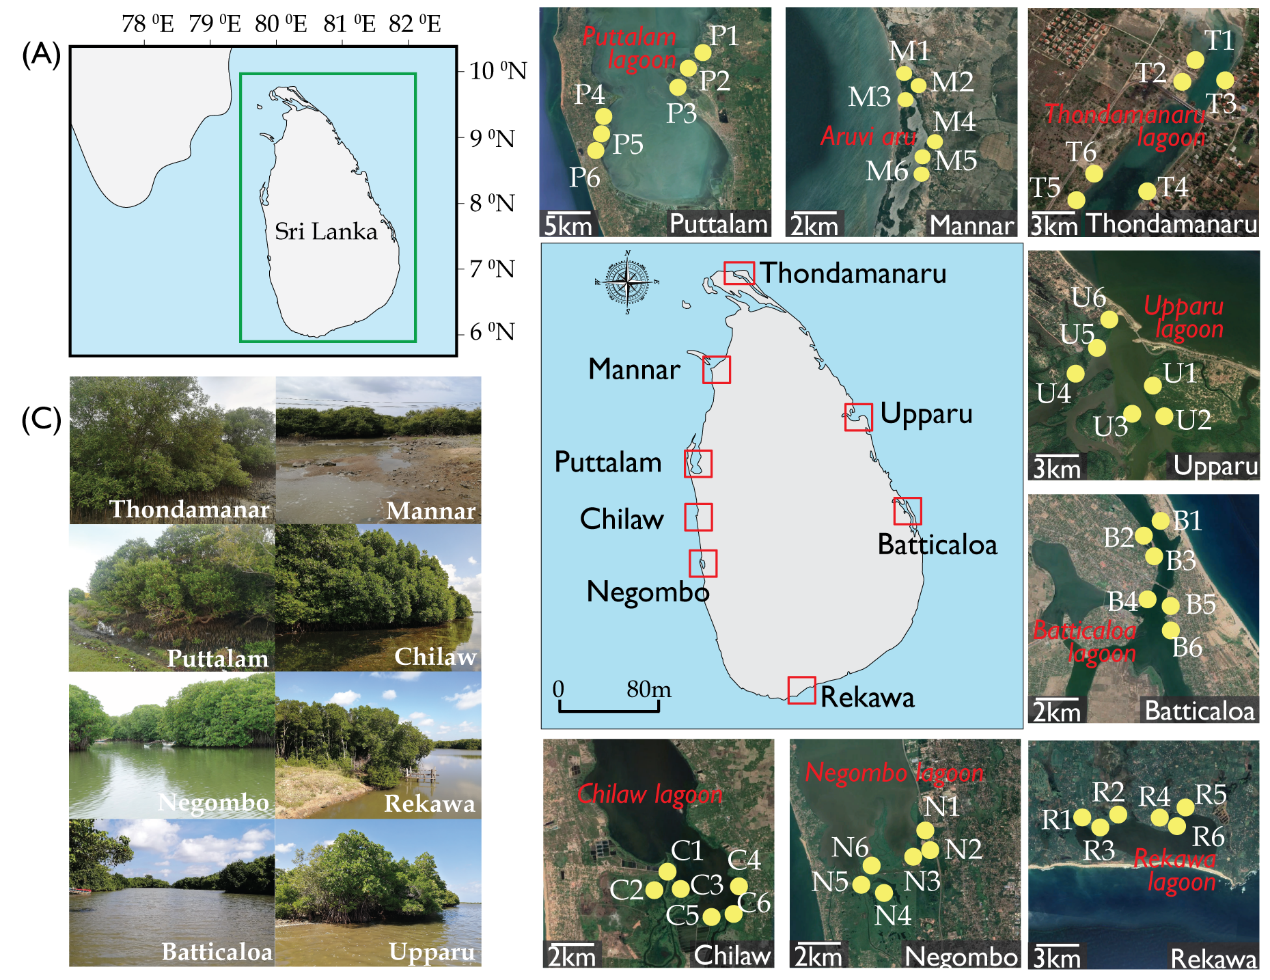
Eight mangrove forests across the island were chosen for the purpose of the study; namely Thondamanaru, Mannar, Puttalam, Chilaw, Negombo, Rekawa, Batticaloa and Upparu (Fig. 1). The mangroves forests selected were located adjacent to primary lagoons/estuaries to be precise Thondamanar lagoon, Aruvi Aru, Puttalam lagoon, Chilaw lagoon, Negombo lagoon, Rekawa lagoon, Batticaloa lagoon and Upparu lagoon, respectively. The field survey and experimental analysis was carried out in the late December of 2019. A salinity gradient exists due to the different climatic zones and the frequent discharge of fresh water into the estuary. Altogether, the sites chosen are very estuarine, dynamic ecosystems with extensive mangrove stands of varying ecosystem ecology. The detailed information on the study site is given in the Table 6.
Forest structure assessment and structural analysis
The forest survey carried out in the eight selected sites at six representative points (1–6). The locations were selected based on the representativeness, diversity and accessibility. Table 1 gives details of the survey locations, their climatic conditions and brief summary of the environmental setting. The present study followed Pinto, 1986 for mangrove species identification and nomenclature. Fixed plot measurement was used for the characterization of the structural attributes of true mangroves based on the methods suggested by Snedaker, 1986. Mangrove floral vegetation was studied using 10m wide belt transects in randomly selected points. Quadrat method was used for the structural analysis of true mangrove flora. Two transects per station were placed across the High Tide Line (HTL); from the estuarine zone towards the landward margin. All the plots were installed at least 20m away from adjacent plot to avoid spatial autocorrelation. Within each transect, three quadrats (10m x 10m) placed for the purpose of species identification. Each species in the quadrate were identified, enumerated and then recorded. Zonation pattern of each species was also examined along the transects (10m width) across the land-water margin.
Diameter at breast height (DBH) was recorded for stand of trees with DBH>5 cm in each subplot. Diameters were measure to the nearest 0.1 cm using the diameter tape. The forest inventory has only considered the alive standing biomass for the calculation and values for the dead or decayed logs have not been taken into account. Diameter measurements were adjusted to accommodate mangrove morphology as necessary; measurements were taken just above buttresses or the highest prop root, exactly 1.3 m from the ground (Kauffman & Donato, 2012).
Ecological parameters
Subsurface water samples were collected from the sites at the points of transects. A minimum of three samples were taken from each transect line and hence 54 samples altogether. The water temperature was recorded in the field using a standard degree centigrade thermometer. The water pH was measured with digital pH probe (Voniry make, Model No. 8541957750), electric conductivity by laboratory Eh meter (ECscan20 conductivity tester), dissolve oxygen (DO) with a digital DO meter (JPB-607A dissolved oxygen meter/Analyzer) and salinity by a portable refractometer (BIOBASE make, Model No. Bk-Pr32).
Statistical analysis
Biodiversity of the mangrove stands was analyzed with the use of various indices including Shannon diversity (H’) (Muhammad et al., 2010), Pielou’s evenness (J’) (Ricotta & Avena, 2003), and Margalef species richness (d’) (Gamito, 2009). Taxonomic diversity (Δ) (Sreelekshmi et al., 2020) was calculated for comparing the biodiversity among sites. All diversity indices were directly computed from PRIMER v6.
Community structure, spatial variation of mangrove assemblages and influence of ecological factors on mangrove carbon potential were studied with cluster analysis, and a Distance based Redundancy Analysis. Cluster analysis (CA) and similarity percentage (SIMPER) were performed based on Bray-Curtis dissimilarity matrix. Multiple response permutation procedure was applied to check for significant difference between the clusters. Non-metric Multi-Dimensional Scaling (nMDS) was used to place the sampling stations in two-dimensional space based on the same similarity matrix used for CA to provide information on dominant species. Permutational multivariate analysis of variance (PERMANOVA) was applied with the Monte Carlo test to investigate whether the mangrove assemblage significantly differed across the sites using the location as a fixed factor.
To understand the relationship between the mangrove assemblages and environmental variables we performed a distance-based redundancy ordination analysis (dbRDA). Significant representative relationships highlighted by dbRDA were then tested using canonical analysis of principal coordinates (CAP), to place mangrove assemblages along the environmental gradient. Community structure was analyzed with PRIMER v6 (Clarke and Gorley, 2006; Anderson et al., 2015) while other quantitative data were analyzed using IBM SPSS 17.0.
Results
Spatial distribution of mangrove flora
We identified 20 true mangrove species from 10 families in the forest survey. The nomenclature was revised with the Mangrove Reference Database and Herbarium created by the Universite Libre de Bruxelles (U.L.B.) and the Vrije Universiteit Brussel (V.U.B.).
All the sites consisted of a heterogeneous mixture of mangrove structure with clear zonation attributes (Fig. 3). Of them, Avicennia marina, Avicennia officinalis, Brugueira cylindrica, Excoecaria indica, Rhizophora mucronata, and Sonneratia alba were observed to be dominant and abundantly distributed in all the sites. Total number of species was high in Chilaw (15) followed by Negombo (11) and Rekawa (10) (Table 4). Comparatively, of the dry zone sites, Upparu has the least number of species (n=3). Some species were observed to be restricted to only one site. Species such as Nypa fruticans and Xylocarpus granatum were observed only in Negombo while Pemphis acidula was only recorded in Thondamanar and Scyphiphora hydrophyllacea was observed in only Puttalam (Fig. 2).
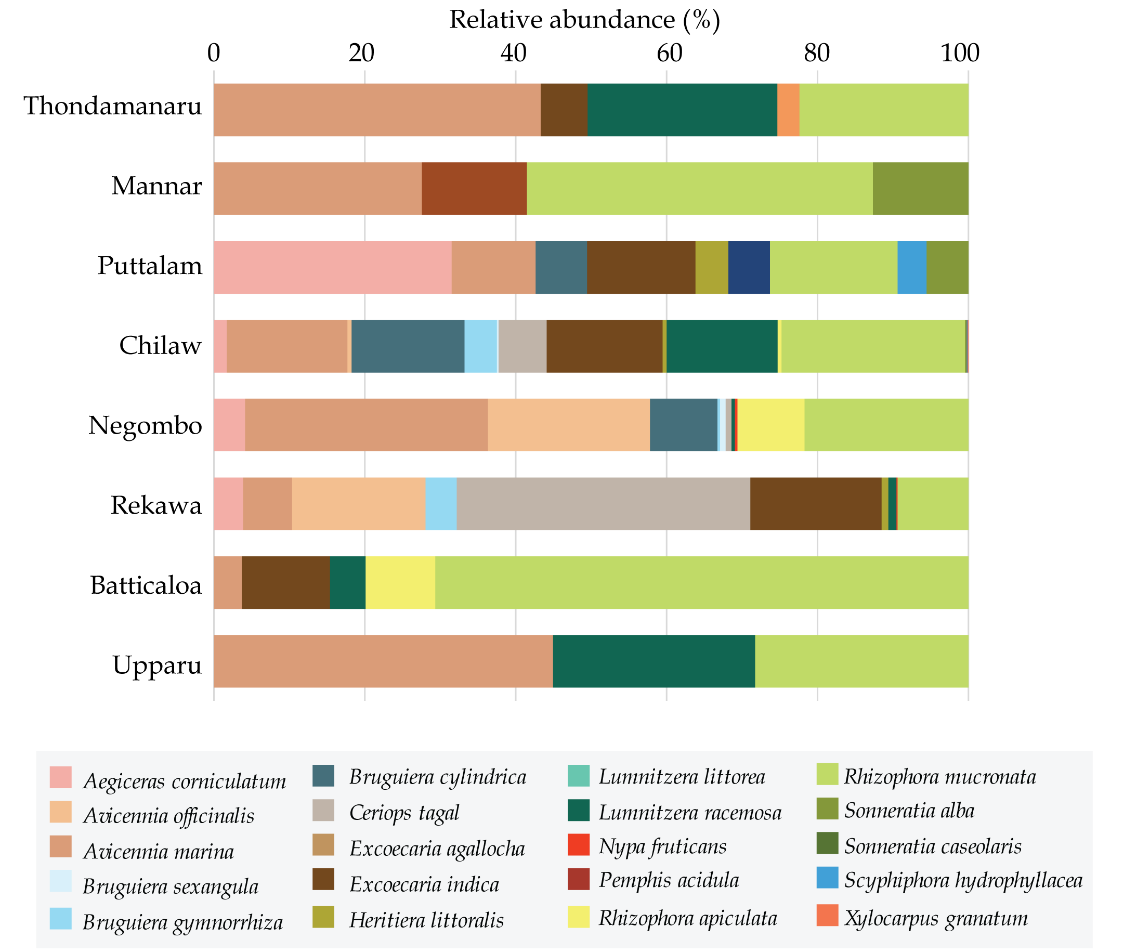
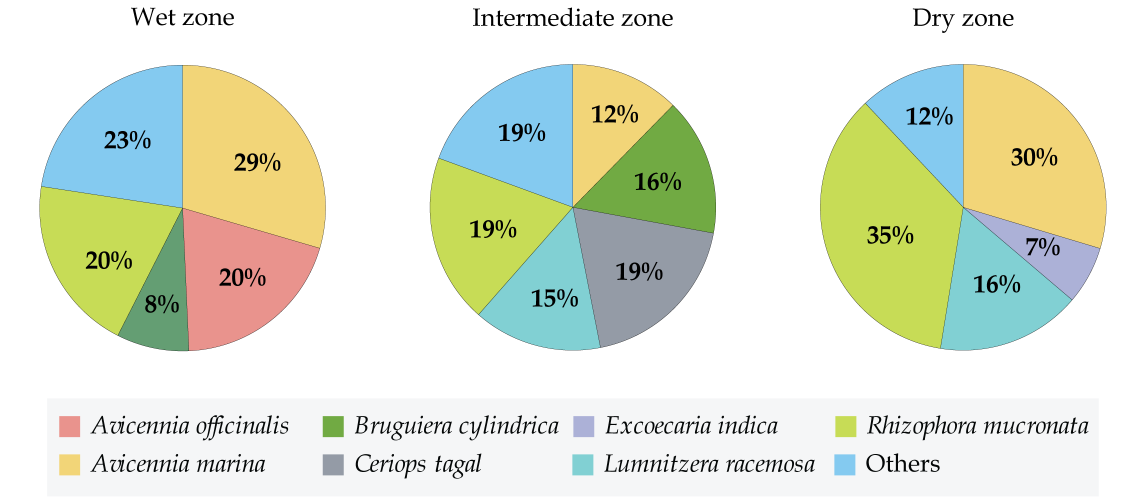
Although, some species were uniformly distributed throughout the coast across the eight sites some were observed in very specific sites only. Accordingly, A. marina, and R. mucronata were scattered around all the eight mangroves, throughout the three climatic zones (Fig. 3). Yet there were variations in their abundance depending on the climatic zone. A. marina was high in abundance in wet and dry zone (29% and 30%, respectively) and relatively as low as 9% in the intermediate zone (Fig. 4). On the other hand, R. mucronata was observed higher in the dry zone (35%) while moderately distributed in wet (20%) and the intermediate zone (19%). Dry zone mangrove forests seemed to have a higher proportion dominated by A. marina and R. mucronata while in wet zone and intermediate zone species diversity was fairly distributed among almost all the species. Overall, wet zone and the intermediate zone tend to house more species and high abundance than that of the dry zone.
Spatial distribution of mangrove assemblages and community structure
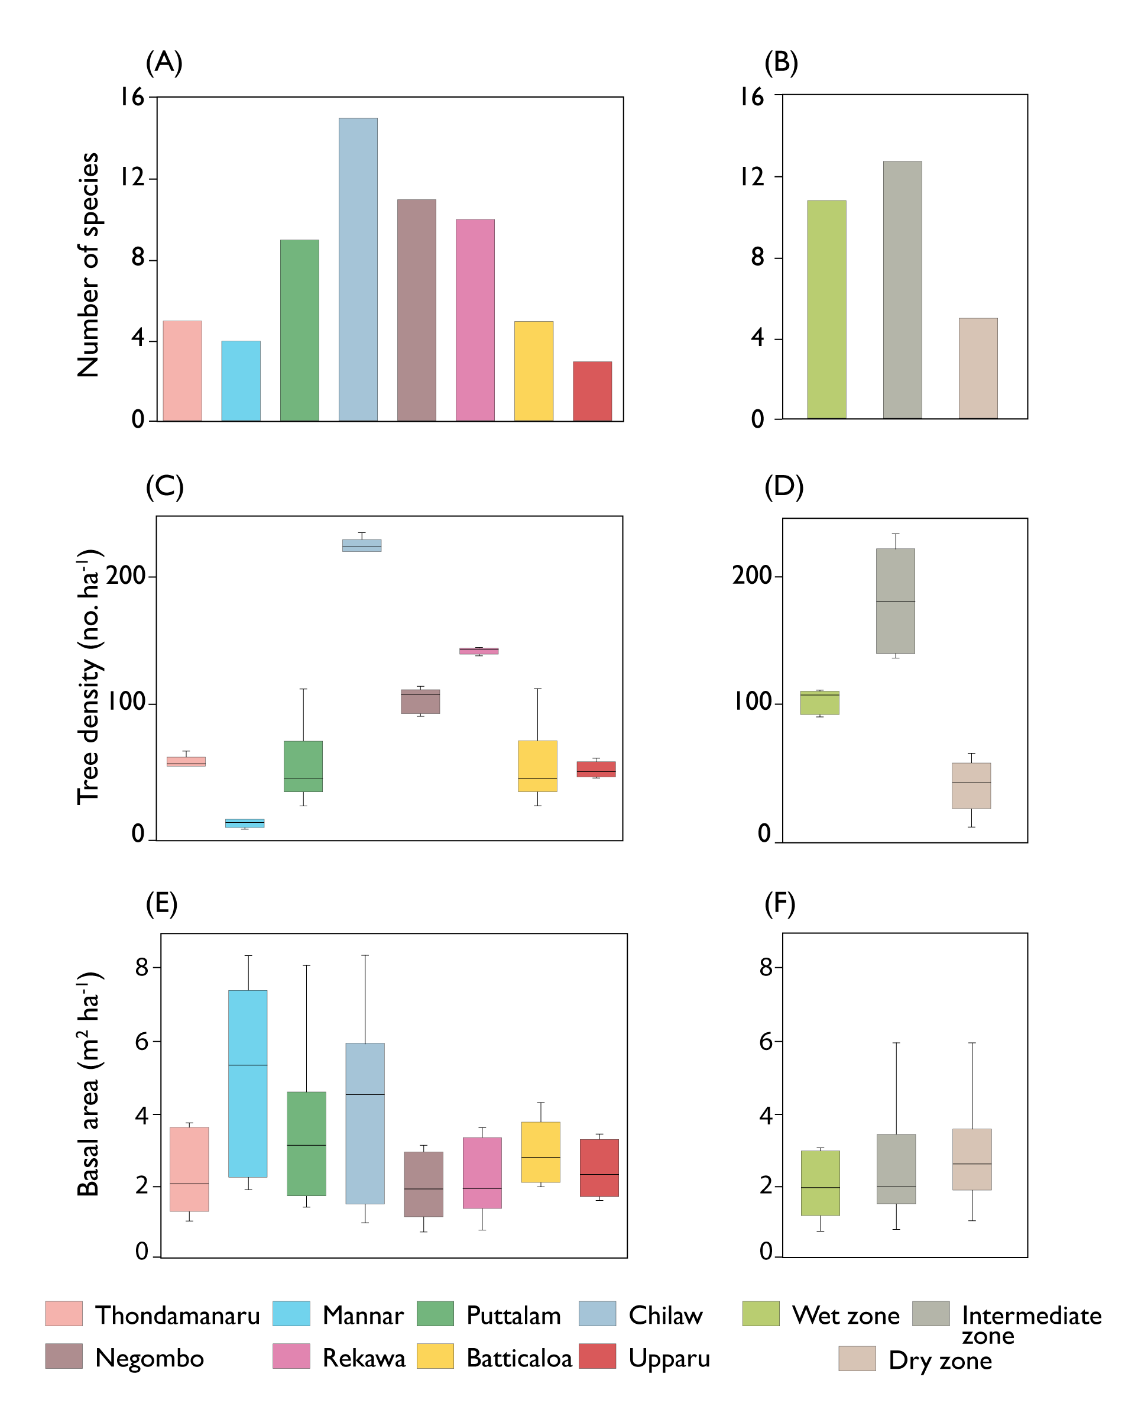
The total number species per site preferably varied between the sites and different climatic zones (Fig. 4A and B). Higher number of species were observed in Chilaw (n=15), followed by Negombo (n=11), Rekawa (n=10) and Puttalam (n=9) (Fig. 4A). Higher number of species were observed in the intermediate zone (n=13) followed by the wet zone (n=11). On the other hand, dry zone showed a poor number of species distribution (n=6) (Fig. 4B).
Mangrove forest structural variables, such as basal area, species diversity and basal area varied significantly across the mangrove sites and the climatic zones. (p<0.05) (Fig. 4C–4F). The higher mean (224 ± 16 no. ha−1) was observed in Chilaw followed by Rekawa (142 ± 21 no. ha−1) and Negombo (101 ± 21 no. ha−1) (p< 0.05) (Fig. 4C). Across the climatic zones, highest mean (183 ± 43 no. ha−1) tree density was observed in the intermediate zone and the lowest in the dry zone (38 ±13 no. ha−1) (p<0.05) (Fig. 4D). However, basal area was not significantly different across the sites as well as climatic zones (p > 0.05). Mean basal area in Mannar, Puttalam and Chilaw was greater than that of the other sites (Fig 4E). On the other hand, higher mean (3.129 ± 1.858 m2 ha−1) basal area was observed in the intermediate zone while the least mean (2.683 ± 1.302 m2 ha−1) recorded in the wet zone (Fig. 4F).
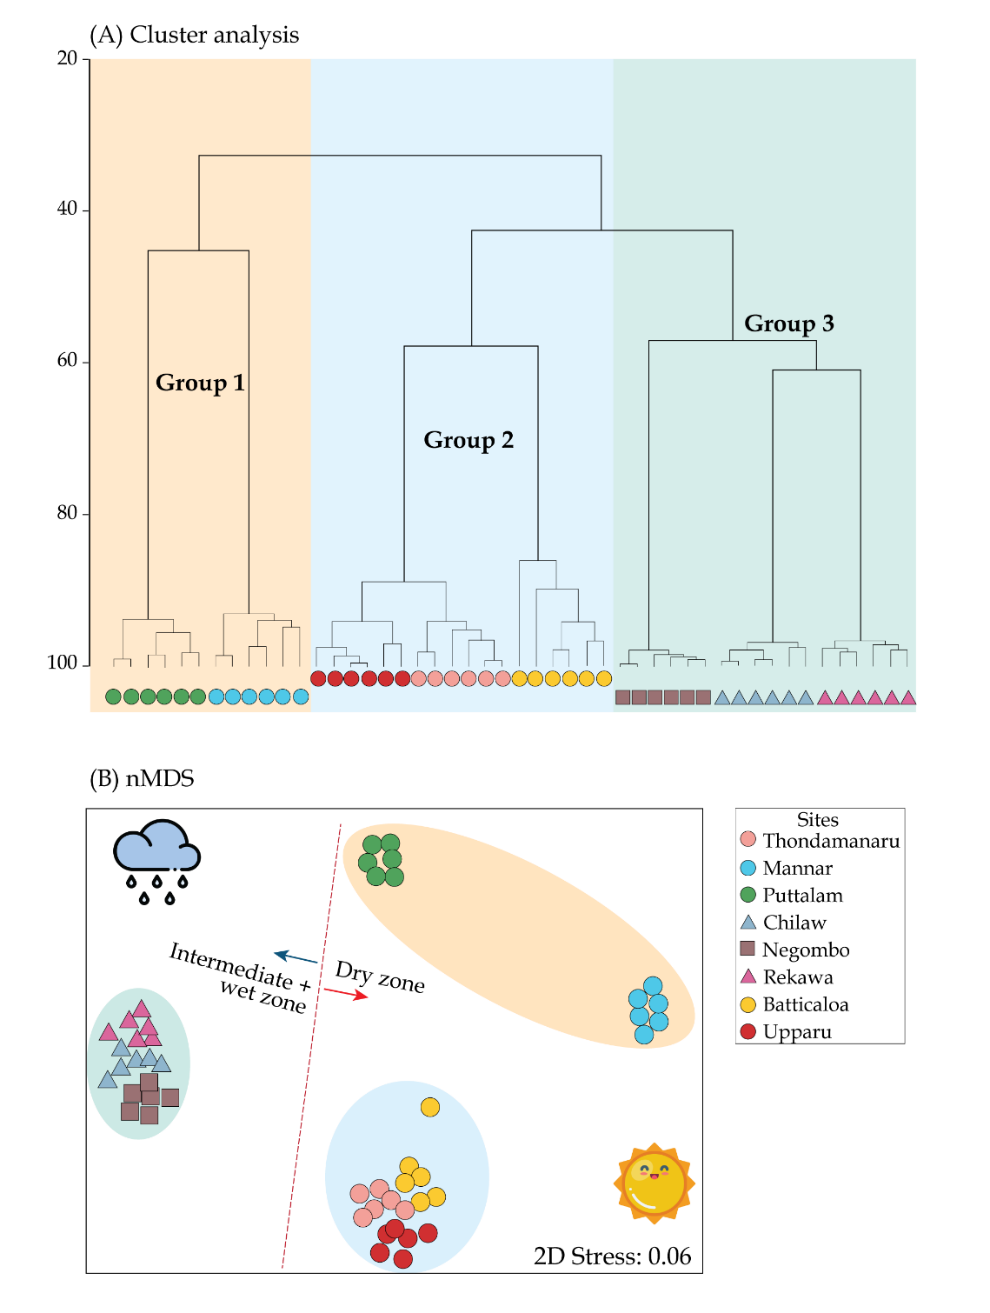
Hierarchical Clustering based on Bray-Curtis similarity (40%) showed a climatic zone favorability by the mangrove communities at the species level (Fig. 5A), producing three descriptive groups namely; Group 1–3. Group 1 assemblage comprised of Mannar and Puttalam whilst Group 2 included Batticaloa, Uppar and Thondamanar (SIMPROF test, p< 0.05). Finally, Group 3 includes Negombo, Chilaw and Rekawa. Group 1 and 2 shows a representation of dry zone whereas Group C a mixture of wet and intermediate zones. Such categorization of the mangrove trees was then used to understand the linkage with preferential sites and their affinity towards edaphic factors based on the findings. Similarity analysis (ANOSIM) indicated that the sampled mangroves are significantly different in relation to abundance of mangrove species (Global R = 0.688 p<0.05). Higher number of species were observed in Group 3, (n=9), followed by Group 1 (n=7) (Table 8). The SIMPER test indicated an average dissimilarity of 63.40%, 71.31%, and 57.56% between groups 1 & 2, 1 & 3, and 2 & 3, respectively. Out of all the mangrove species, Rhizophora mucronata and Avicennia marina contributed prominently throughout the three clusters, with slight variation (Table 7). All of the tested environmental and structural variables varied significantly between the three groups except for water pH (Table 7). Non-metric multidimensional scaling (nMDS) was performed to delineate the stations with similar mangrove species composition and to understand their dispersion for each of the site as well as the similarity distances for all the samples in a two-dimensional space. (Fig. 5B). The scattering clearly demarcated the boundaries of dry zone forests and wet and intermediate forest. The scattering was comparatively narrow for the Groups 2 and 3 than that of Group 1.
| Group 1 | Group 2 | Group 3 | p | |
|---|---|---|---|---|
| Sites included | Mannar, Puttalam | Upparu, Thondamanaru, Upparu | Negombo, Chilaw, Rekawa | |
| Representing climatic zone | Dry | Dry | Intermediate and wet | |
| Temp. (ºC) | 32.57 ± 1.8 | 32.51 ± 2.37 | 30.54 ± 0.62 | * |
| pH | 7.66 ± 0.49 | 7.77 ± 0.07 | 7.98 ± 0.55 | ns |
| Eh (µS cm−1) | 1572.3 ± 742.8 | 855 ± 162.9 | 2298.2 ± 847.7 | ** |
| DO (mg L−1) | 5.85 ± 0.36 | 4.53 ± 1.35 | 3.62 ± 2.22 | * |
| Salinity (psu) | 26.64 ± 2.23 | 25.48 ± 2.30 | 20.26 ± 5.52 | ** |
| Prep. (mm yr−1) | 190.3 ± 183.4 | 199.4 ± 167.1 | 280.4 ± 170.1 | * |
| Species diversity (H') | 1.44 ± 0.40 | 1.30 ± 0.29 | 1.86 ± 0.15 | ** |
| Dominance (d) | 0.74 ± 0.30 | 0.39 ± 0.11 | 1.19 ± 0.25 | ** |
| Evenness (J') | 0.89 ± 0.05 | 0.80 ± 0.15 | 0.74 ± 0.26 | ** |
| Taxonomic index (Δ) | 64.72 ± 6.58 | 63.86 ± 8.59 | 74.69 ± 3.29 | * |
| Tree density (no. ha−1) | 28.73 ± 25.61 | 68.76 ± 26.78 | 183.09 ± 43.03 | ** |
| Basal area (m2 ha−1) | 3.64 ± 2.4 | 2.67 ± 0.93 | 2.84 ± 2.16 | * |
| Contributing species (%) |
Rhizophora mucronata (28.35%) Rhizophora mucronata (37.53%) Rhizophora mucronata (17.74%) |
Avicennia marina (24.43%) Avicennia marina (28.50%) Avicennia marina (17.29%) |
Sonneratia alba (19.38 %) Luminitzera racemosa (23.39%) Avicennia officinalis (12.75%) |
The distribution of mangrove community in the Sri Lankan coast revealed spatial differences broadly supported by the mangrove abundance and environmental variables (Table 2). The compositions of mangrove assemblages were significantly different as retested by the PERMANOVA between the sites (df = 7, Pseudo-F = 5.31, p<0.05) and between the climatic zones (df = 2, Pseudo-F = 1.59, p<0.05). However, there was no trend in the interaction between sites and the climatic zones. The PERMDISP test showed that significant dispersion differences prevails between the study sites and the climatic zones in terms of mangrove abundance and ecological variables (p<0.05) (Table 2). This phenomenon might be attributed to heterogeneous variation of the taxonomic diversity among the sites, than that of the real effect. However, the PERMDISP showed no significant relationship between the sites and the climatic zone.
| Test variable | Source | PERMANOVA | PERMDISP | ||
|---|---|---|---|---|---|
| df | P-F | P(perm) | P(perm) | ||
| Mangrove abundance | Zo | 2 | 15.9 | 0.004 | 0.001 |
| Si | 7 | 531.65 | 0.001 | 0.007 | |
| Zo x Si | 14 | 2.9 | 0.412 | ||
| Res | 40 | ||||
| Ecological attributes | Zo | 2 | 239.54 | 0.042 | 0.001 |
| Si | 7 | 14.889 | 0.001 | 0.009 | |
| Zo x Si | 14 | 0.222 | |||
| Res | 40 | ||||
Ecological diversity of mangroves across the sites
The Shannon–Wiener diversity index (H’) ranged from 0.98 to 2.00 (Table 3) with the highest in Chilaw and the lowest in Batticaloa. Additionally, Puttalam, Rekawa and Negombo too showed relatively higher values of diversity index. Moderately higher range of Margalef dominance index (d) (0.19–1.19) and low variations of Pielou’s evenness index (0.61–0.97) recorded amongst the sites. High values for taxonomic diversity was recorded in Puttalam (81.73%) and the lowest value was recorded in Batticaloa (38.78%). Overall, the taxonomic diversity for all the sites except Batticaloa was beyond 60% of the aggregation data. The comprehensive information on the indices of diversity across all the sites and stations is given in Table 7.
| Shannon Index (H') | Species richness (d) | Pielou’s evenness (J') | Taxonomic diversity (Δ) | |
|---|---|---|---|---|
| Thondamanar | 1.32 | 0.38 | 0.82 | 69.45 |
| Mannar | 1.25 | 0.35 | 0.90 | 67.85 |
| Puttalam | 1.95 | 0.83 | 0.89 | 81.73 |
| Chilaw | 2.00 | 1.19 | 0.74 | 77.81 |
| Negombo | 1.73 | 0.90 | 0.72 | 64.34 |
| Rekawa | 1.74 | 0.79 | 0.75 | 71.75 |
| Batticaloa | 0.98 | 0.40 | 0.61 | 38.78 |
| Uppar | 1.07 | 0.19 | 0.97 | 64.63 |
| Mean ± SD | 1.51 ± 0.39 | 0.69 ± 0.35 | 0.80 ± 0.11 | 67.04 ± 12.94 |
Ecological attributes
Table 4 shows a brief summary of the variables tested in the eight mangrove sties. Water temperature ranged from 31.8 to 33.2ºC with minor variations between the sites. pH widely varied within the range of 7.20 to 8.62, showing slightly alkaline characteristics and relatively constant throughout the sites. Conductivity varied enormously within the sites and was in the range from 945.73 to 2942.23 µS cm−1. Dissolved oxygen (DO) varied from 3.58 to 5.99 mg L−1 representing anoxic to moderately oxic environmental conditions in the mangrove sites. Lowest DO was recorded in Rekawa (3.58 ± 0.32 mg L−1) and the highest was in Batticaloa (5.99 ± 0.39 mg L−1). Water salinity was approximately beyond 25 psu, ranging from 25.06 to 29.56 psu. The values of salinity showed a slightly polyhaline to euhaline trait. The results of the one-way ANOVA showed that the environmental conditions between the three different climatic zones are significantly different (p<0.05) for variables temperature, conductivity, DO, salinity and precipitation (Table 5).
Annual precipitation data collected from the secondary sources showed a huge variation between different climate zones (Table 2 and 3). Precipitation values ranged from 80.37 to 347.00 with the lowest recorded in Mannar (dry zone) and the highest in Negombo (wet zone). Based on their riverine input and fluvial import, Mannar showed higher runoff volume (1167 Mm3) and comparatively Upparu (108) and Rekawa showed (112) lowest riverine inputs. Even though, all the sites belong to the coastal line they slightly differed in their elevation profile.
| Sites | Primary Data | Secondary Data | ||||||
|---|---|---|---|---|---|---|---|---|
| Temp. (ºC) |
pH | Eh (µS cm−1) |
DO (mg L−1) |
Salinity (psu) | Prep. (mm yr−1)* |
Runoff volume (Mm3)** |
Elevation (m)*** |
|
| Thondamanar | 32.7 ± 1.2 | 7.79 ± 0.06 | 647.73 ± 51.0 | 5.81 ± 0.30 | 28.50 ± 0.81 | 99.12 | 197 | 5 |
| Mannar | 33.2 ± 0.9 | 8.13 ± 0.13 | 861.28± 11.45 | 5.49 ± 0.78 | 29.56 ± 0.91 | 80.37 | 1164 | 4 |
| Puttalam | 32.8 ± 1.1 | 7.20 ± 0.06 | 2283.34 ± 18.4 | 5.76 ± 0.19 | 24.73 ± 1.25 | 240.05 | 217 | 2 |
| Chilaw | 32.6 ± 0.4 | 8.62 ± 0.17 | 2942.23 ± 34.7 | 4.45 ± 0.18 | 26.63 ± 0.95 | 158.52 | 927 | 3 |
| Negombo | 32.6 ± 0.8 | 7.72 ± 0.82 | 2811.06 ± 75.1 | 4.60 ± 0.26 | 25.06 ± 1.76 | 347 | 282 | 8 |
| Rekawa | 32.3 ± 0.6 | 7.37 ± 0.04 | 1141.34 ± 17.0 | 3.58 ± 0.32 | 27.53 ± 81.5 | 113.83 | 112 | 7 |
| Batticaloa | 31.8 ± 2.4 | 7.63 ± 0.03 | 974.28 ± 67.4 | 5.99 ± 0.39 | 29.51 ± 2.73 | 291.4 | 626 | 8 |
| Upparu | 32.0 ± 3.2 | 7.72 ± 0.59 | 945.73 ± 65.4 | 5.77 ± 0.31 | 25.95 ± 2.84 | 180.58 | 108 | 6 |
| Wet zone | Intermediate zone | Dry zone | p | |
|---|---|---|---|---|
| Temp. (ºC) | 27.54 ± 0.89 | 28.48 ± 0.58 | 32.54 ± 1.92 | * |
| pH | 7.72 ± 0.18 | 7.99 ± 0.66 | 7.69 ± 0.32 | ns |
| Eh (µS/cm) | 2811.1 ± 75.1 | 2041 ± 944.9 | 1142.5 ± 593.5 | * |
| DO (mg L−1) | 1.69 ± 0.26 | 6.10 ± 0.72 | 5.23 ± 0.99 | * |
| Salinity (psu) | 25.58 ± 1.76 | 17.89 ± 5.17 | 26.59 ± 2.25 | * |
| Prep. (mm yr−1) | 347.1 ± 158.4 | 193.9 ± 170.7 | 97.1 ± 82.1 | * |
Discussion
Phytosociology – ecology synergy in mangrove forests
A distance-based redundancy analysis (dbRDA) was performed to apprehend the relationship between the community structure and environmental variables tested in the present study (Fig. 6). The test model confirmed that mangrove assemblages were correlated with specific environmental variables. The first (dbRDA1: 40.9%) and second axes (dbRDA2: 26.1%) were plotted in a scatter plot to understand the variability of community structure in mangroves (Fig. 6). Collectively the first two axes represented 67.0% of the total variability in community structure. Primarily, the first axis was explained by salinity, while the second axis was explained by dissolved oxygen and precipitation. However, salinity and DO seemed to play a potential role in explaining the spatial distribution of mangrove species between the groups. Generalist species identified by the SIMPER analysis with relevant to high taxon diversity and abundance were matched with the scatterplots marking the wide spread distribution of Rhizophora mucronata and Avicennia marina throughout the three groups (Table 8). In addition, the scatterplot shows higher abundance of Sonneratia alba, Exoecaria spp. and Aegiceras corniculatum towards Group, while Luminitzera racemosa and shows an affinity towards Group 2. On the other hand, Group 3 seems to favor distributions of Ceriops tagal and Brugueira spp.
The scatter diagram of CAP with selected environmental and structural variables showed a pattern on the distribution of mangrove assemblages, and their carbon sequestration potential. Highly correlating ecological variables dissolved oxygen (DO) and salinity, and high correlating structural variables tree density and taxonomic diversity were chosen for the canonical analysis of principal coordinates (CAP) investigation. DO and salinity gradients clearly changed the floristic structure and carbon pools with canonical correlations of δ = 0.81 (m = 5, p<0.05) and δ = 0.69 (m = 2, p<0.05), respectively. On the other hand, tree density and taxonomic index had a significant relationship with community structure thus on carbon pools with canonical correlation gradients of δ = 0.86 (m = 3, p<0.05) and δ = 0.84 (m = 5, p<0.05), respectively. Variations in the selected parameters overlaid with the relative abundance of species in the sites, to further scrutinize the results. This clearly changed the abundance and occurrence of species along the canonical gradient with varying ecological and phytosociological parameters.
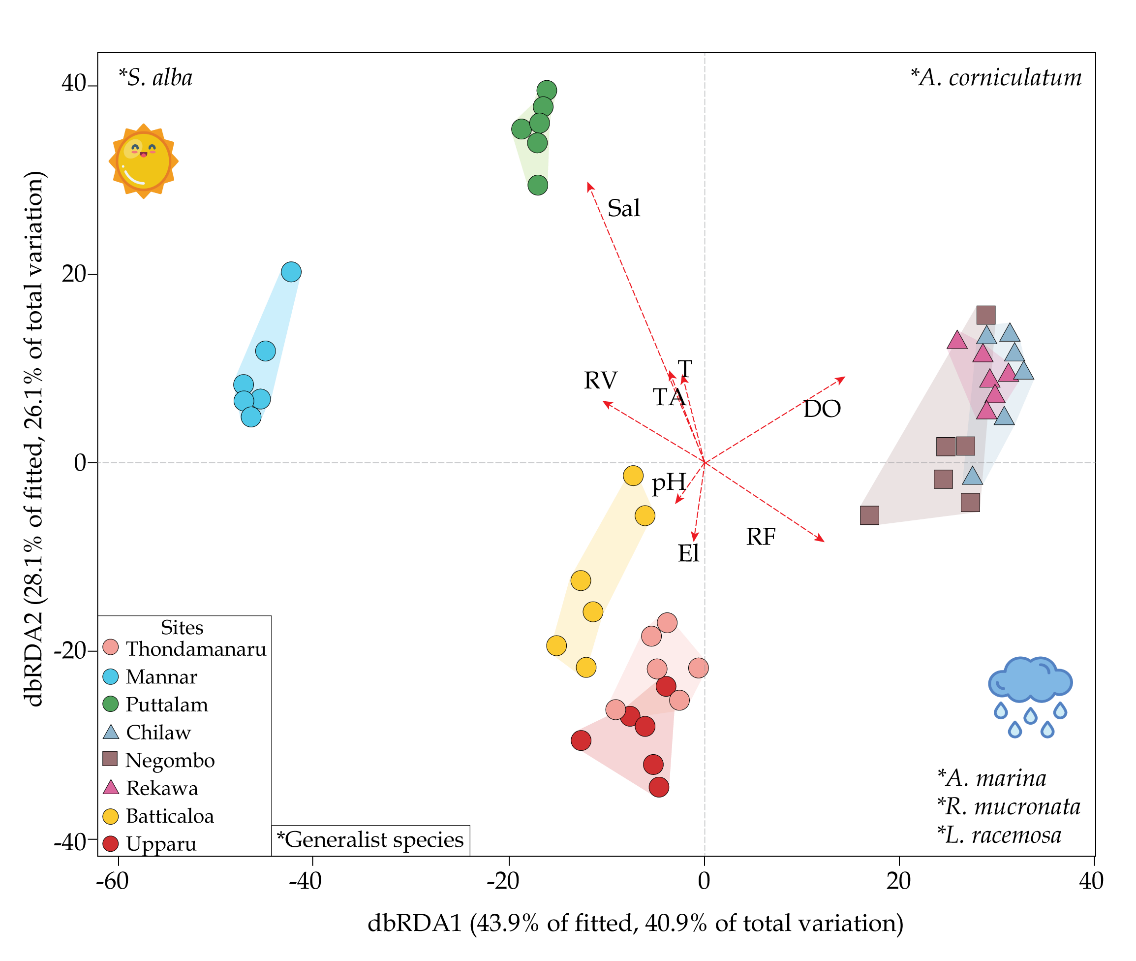
The species composition, growth and structure of the mangrove forest varies as a function of geophysical, geographical, geological, hydrographic, biogeographical, climatic, edaphic factors and other environmental conditions (Yudha et al., 2021). Particular mangrove species are highly depends on climate conditions and the coastal geography (Farooq & Siddiqui, 2020). This is highly evident in the present study where the floral distribution varies with the climatic zone variation which is displaying the first and second axis, indicating the relationship between environmental variables and mangrove assemblage by sites. Partial correlation of the significant environmental variables were superimposed on the ordination vectors. The length and direction of the environmental vectors indicate the strength and direction of the relationship of the mangroves (Sal: Salinity; RV: Runoff volume; TA: tidal amplitude; T: Temperature; El: Elevation; Prep.: Precipitation; DO: dissolved oxygen)
Implications for conservation
The uncertainty associated with the future of complex ecological systems like mangrove forests is a key challenge to incorporating the value of ecosystem services into informed environmental decision-making (Lee et al., 2014). The coupling of ecosystem service valuations with simulations of possible future management scenarios offers a promising tool to guide complex decision-making related to ecosystem management, but requires reliable and compatible data encompassing a wide range of physical, biological and socio-economic scenarios (Farid Dahdouh-Guebas et al., 2020).
The concept of mangroves as key biotic agents involved in geomorphic processes is important to conservation and restoration efforts (Lovelock & Reef, 2020). Viewing mangroves as passive players in coastal dynamics, and especially with respect to counterbalancing sea-level rise, may weaken arguments for their protection. More importantly, the assumption that mangroves are not inherently involved in land development may lead to faulty management plans and decisions that threaten habitat stability (Lovelock et al., 2015). However, with data sufficiently provided, their contribution on regulating carbon cycles and influencing climate change has been prominently recorded by several research studies (Bryan-Brown et al., 2020; Friess et al., 2019; Macreadie et al., 2019; Feller et al., 2010). There is a strong need for a network of consistently collected data for scaling up to ecosystem-level analyses at greater geographic coverage. The network needs to incorporate the range of variation in mangrove species and assemblage distribution in local hydrologic as well as broader biogeographic settings (Ouyang & Lee, 2020). This could present a challenge to mangrove analysis and management, as Sri Lankan coastline is subjected to variety of stress from both natural (F. Dahdouh-Guebas et al., 2000) and anthropogenic (Satyanarayana et al., 2017) sources and are subjected to higher degree of land-use changes (Brown et al., 2020) with an annual mangrove deforestation rate of 0.568% per annum (Adame et al., 2021). Hence, we believe the findings from the present study will allow restoration plans to be tailored better in the national climate change agenda and will support efforts to monitor mangrove ecosystem carbon cycles and provide a basis for the development of sustainable management programs for mangroves in Sri Lanka.
Conclusion
While Sri Lankan mangroves are under crisis with various natural and anthropogenic causes, protection and restoration has to be fortified properly to achieve sustainable resource utilization. The key outputs from the present study shows that there is a significant relationship between the phytosociology and ecology of a particular mangrove forest and that the relationships are site-specific. This relationship in turn determines the success and efficiency of the mangrove ecosystem restoration programs. Thus, it is highly recommended to understand, the phytosociology-ecology synergy and to choose restoration species to elevate the success probability of mangrove restoration in the future. In addition, the findings in this study can provide a technical reference for revising the current relevant policies.
Acknowledgements
This study was supported by a project “Development of Blue Carbon Information System and Its Assessment for Management [grant number 20170318]” funded by the Ministry of Oceans and Fisheries of Korea (MOF) and the Basic Science Research Program through the National Research Foundation of Korea (NRF) funded by the Ministry of Education (NRF-2020R1I1A2066477).
References
- Adame, M. F., Connolly, R. M., Turschwell, M. P., Lovelock, C. E., Fatoyinbo, T., Lagomasino, D., Goldberg, L. A., Holdorf, J., Friess, D. A., Sasmito, S. D., Sanderman, J., Sievers, M., Buelow, C., Kauffman, J. B., Bryan-Brown, D., & Brown, C. J. (2021). Future carbon emissions from global mangrove forest loss. Glob Change Biol.; 27:2856–2866
- Anderson, M. J., Gorley, R. N., & Clarke, K. R. (2008). PERMANOVA+ for PRIMER: Guide to software and statistical methods. Primer-E, first ed. Plymouth, UK.
- Arulnayagam, A. (2020). Floral distribution , abundance and diversity of mangroves in Sangupiddy, Kilinochchi , the northern coast of Sri Lanka. Journal BiNET.; 01(01), 21–27.
- Bastiaanssen, W. G. M., & Chandrapala, L. (2003). Water balance variability across Sri Lanka for assessing agricultural and environmental water use. Agricultural Water Management, 58(2), 171–192.
- Berger, U., Rivera-Monroy, V. H., Doyle, T. W., Dahdouh-Guebas, F., Duke, N. C., Fontalvo-Herazo, M. L., Hildenbrandt, H., Koedam, N., Mehlig, U., Piou, C., & Twilley, R. R. (2008). Advances and limitations of individual-based models to analyze and predict dynamics of mangrove forests: A review. Aquatic Botany 89: 260–274
- Bryan-Brown, D., Connolly, R., Richards, D., Adame, F., Friess, D., & Brown, C. (2020). Global trends in mangrove forest fragmentation. Sci Rep., 10, 7117.
- Chen, R., & Twilley, R. R. (1999). Patterns of mangrove forest structure and soil nutrient dynamics along the Shark River estuary, Florida. Estuaries, 22(4), 955–970.
- Cheng, L., & Hogarth, P. (2001). The Biology of Mangroves. The Florida Entomologist, 84, 459.
- Clarke, K. R., & Gorley, R. N. (2006). PRIMER v6: User Manual/Tutorial. PRIMER-E, first ed. Plymouth, UK
- Dahdouh-Guebas, F., Verheyden, A., De Genst, W., Hettiarachchi, S., & Koedam, N. (2000). Four decade vegetation dynamics in Sri Lankan mangroves as detected from sequential aerial photography: A case study in Galle. B Mar Sci, 67(2), 741–759.
- Dahdouh-Guebas, Farid, Ajonina, G. N., Amir, A. A., Andradi-Brown, D. A., Aziz, I., Balke, T., Barbier, E. B., Cannicci, S., Cragg, S. M., Cunha-Lignon, M., Curnick, D. J., Duarte, C. M., Duke, N. C., Endsor, C., Fratini, S., Feller, I. C., Fromard, F., Hugé, J., Huxham, M., … Friess, D. A. (2020). Public Perceptions of Mangrove Forests Matter for Their Conservation. Front. Mar. Sci. 7:603651.
- Dahdouh-Guebas, Farid, Van Pottelbergh, I., Kairo, J. G., Cannicci, S., & Koedam, N. (2004). Human-impacted mangroves in Gazi (Kenya): predicting future vegetation based on retrospective remote sensing, social surveys, and tree distribution. Mar Ecol Prog Ser, 272, 77–92.
- Duke, N. C. (1992). Mangrove floristics and biogeography. January 1992, 63–100.
- Ellepola, G., & Ranawana, K. B. (2015). Panama Lagoon : A unique mangrove ecosystem in the east coast of Sri Lanka. Wetlands Sri Lanka. Wildlanka. 2(1), 10–19.
- Ellison, A. M. (2001). Mangrove communities. Marine Community Ecology.
- Farooq, S., & Siddiqui, P. J. A. (2020). Assessment of three mangrove forest systems for future management through benthic community structure receiving anthropogenic influences. Ocean Coast Manage, 190, 105162.
- Feller, I. C., Lovelock, C. E., Berger, U., McKee, K. L., Joye, S. B., & Ball, M. C. (2010). Biocomplexity in mangrove ecosystems. Annu Rev Mar Sci, 2(1), 395–417.
- Friess, D. A., Aung, T. T., Huxham, M., Lovelock, C., & Sasmito, S. (2019). SDG 14: Life below water-Impacts on mangroves. In Sustainable Development Goals: Their Impacts on Forests and People (Issue December).
- Gamito, S. (2009). Caution is needed when applying Margalef diversity index. Ecol Indic, 10(2), 550–551.
- Hilaluddin, F., Yusoff, F. M., Natrah, F. M. I., & Lim, P. T. (2020). Disturbance of mangrove forests causes alterations in estuarine phytoplankton community structure in Malaysian Matang mangrove forests. Mar Environ Res, 158, 104935.
- Jones, T. G., Ratsimba, H. R., Ravaoarinorotsihoarana, L., Cripps, G., & Bey, A. (2014). Ecological segregation of the late jurassic stegosaurian and iguanodontian dinosaurs of the morrison formation in north america: Pronounced or subtle? Forests, 5(1), 177–205. Karunathilake, K. M. B. C. (2003). Status of Mangroves in Sri Lanka. J Coastal Res, 7(1), 5–9.
- Katupotha, K. N. J. (2016). Mangroves in Lagoon Ecosystems : a Neglected Habitat in Sri Lanka. Wildlanka, 4(3), 79–105.
- Kauffman, B., & Donato, D. (2012). Protocols for the measurement, monitoring and reporting of structure, biomass and carbon stocks in mangrove forests. Center for International Forestry Research.
- Lavieren, H. Van, Spalding, M., Alongi, D. M., Kainuma, M., Clüsener-godt, M., & Adeel, Z. (2012).
- Lee, S. Y., Primavera, J. H., Dahdouh-Guebas, F., Mckee, K., Bosire, J. O., Cannicci, S., Diele, K., Fromard, F., Koedam, N., Marchand, C., Mendelssohn, I., Mukherjee, N., & Record, S. (2014). Ecological role and services of tropical mangrove ecosystems: A reassessment. Global Ecol Biogeogr,
- Li, M. S., & Lee, S. Y. (1997). Mangroves of China: A brief review. Forest Ecol Manag, 96(3), 241–259.
- Lovelock, C. E., Cahoon, D. R., Friess, D. A., Guntenspergen, G. R., Krauss, K. W., Reef, R., Rogers, K., Saunders, M. L., Sidik, F., Swales, A., Saintilan, N., Thuyen, L. X., & Triet, T. (2015). The vulnerability of Indo-Pacific mangrove forests to sea-level rise. Nature, 526(7574), 559–563.
- Lovelock, C. E., & Reef, R. (2020). Variable Impacts of Climate Change on Blue Carbon. One Earth, 3(2), 195–211.
- Macreadie, P. I., Anton, A., Raven, J. A., Beaumont, N., Connolly, R. M., Friess, D. A., Kelleway, J. J., Kennedy, H., Kuwae, T., Lavery, P. S., Lovelock, C. E., Smale, D. A., Apostolaki, E. T., Atwood, T. B., Baldock, J., Bianchi, T. S., Chmura, G. L., Eyre, B. D., Fourqurean, J. W., … Duarte, C. M. (2019). The future of Blue Carbon science. Nat Commun, 10(1), 1–13.
- Morrisey, D., Swales, A., Dittmann, S., Morrison, M., Lovelock, C., & Beard, C. (2010). The Ecology and Management of Temperate Mangroves.Oceanogr Mar Biol , 43–160.
- Muhammad, Z., Shah, S., & Shafiq, M. (2010). Ecological surveys of certain plant communities around urban areas of Karachi. Journal of Applied Sciences and Environmental Management, 12(2).
- Ouyang, X., & Lee, S. Y. (2020). Improved estimates on global carbon stock and carbon pools in tidal wetlands. Nat Commun, 11(1), 1–7. Perera, K. A. R. S., Amarasinghe, M. D., & Somaratna, S. (2013). Vegetation Structure and Species Distribution of Mangroves along a Soil Salinity Gradient in a Micro Tidal Estuary on the North-western Coast of Sri Lanka. American Journal of Marine Science, 1(1), 7–15.
- Pinto, L. (1986). Mangroves of Sri Lanka. February, 1–58.
- Prasanna, M. G. M., Ranawana, K. B., & Jayasuriya, K. M. G. G. (2019). Species composition, abundance and diversity of mangroves in selected sites in Amprara District in the east coast of Sri Lanka. Ceylon Journal of Science, 48(2), 169.
- Reef, R., Feller, I. C., & Lovelock, C. E. (2010). Nutrition of mangroves. Tree Physiol, 30(9), 1148–
- Ricotta, C., & Avena, G. (2003). On the relationship between Pielou’s evenness and landscape dominance within the context of Hill’s diversity profiles. Ecol Indic, 2(4), 361–365.
- Rodríguez-Rodríguez, J. A., Mancera Pineda, J. E., Melgarejo, L. M., & Medina Calderón, J. H. (2018). Functional traits of leaves and forest structure of neotropical mangroves under different salinity and nitrogen regimes. Flora, 239, 52–61.
- Sandilyan, S., & Kathiresan, K. (2012). Mangrove conservation: A global perspective. Biodivers Conserv, 21(14), 3523–3542.
- Satyanarayana, B., Van der Stocken, T., Rans, G., Kodikara, K. A. S., Ronsmans, G., Jayatissa, L. P., Husain, M. L., Koedam, N., & Dahdouh-Guebas, F. (2017). Island-wide coastal vulnerability assessment of Sri Lanka reveals that sand dunes, planted trees and natural vegetation may play a role as potential barriers against ocean surges. Global Ecol Cons, 12(November), 144–157.
- Snedaker, S. C. (1986). The mangrove ecosystem: Research methods (Vol. 25).
- Sreelekshmi, S., Nandan, S. B., Kaimal, S. V., Radhakrishnan, C. K., & Suresh, V. R. (2020). Mangrove species diversity, stand structure and zonation pattern in relation to environmental factors — A case study at Sundarban delta, east coast of India. Reg Stud Mar Scie, 35, 101111.
- Yudha, R. P., Sugito, Y. S., Sillanpää, M., & Nurvianto, S. (2021). Impact of logging on the biodiversity and composition of flora and fauna in the mangrove forests of Bintuni Bay, West Papua, Indonesia. Forest Ecol Manag, 488, 119038.
Appendices
| Mangrove marsh | Adjoining lagoon | Station No. | Latitude (N) | Longitude (E) | Site description* | Soil texture* | Climatic zone** |
|---|---|---|---|---|---|---|---|
| Thondamanar | Thondamanar lagoon | T1 | 9°49'06.12" | 80°07'59.99" | flat terrain | Regosols | Dry |
| T2 | 9°47'47.48" | 80°08'16.65" | |||||
| T3 | 9°49'17.90" | 80°08'51.39" | |||||
| T4 | 9°49'16.90" | 80°10'14.73" | |||||
| T5 | 9°49'32.96" | 80°11'38.50" | |||||
| T6 | 9°47'29.26" | 80°07'32.74" | |||||
| Mannar | Aruvi aru | M1 | 8°53'03.53" | 79°56'05.10" | flat terrain | Solodized solonetz | Dry |
| M2 | 8°52'21.33" | 79°56'10.55" | |||||
| M3 | 8°51'34.46" | 79°55'38.54" | |||||
| M4 | 8°52'47.52" | 79°55'51.14" | |||||
| M5 | 8°52'09.67" | 79°55'46.14" | |||||
| M6 | 8°53'51.91" | 79°55'54.31" | |||||
| Puttalam | Puttalam lagoon | P1 | 8°04'19.82" | 79°47'31.83" | flat to slightly undulating terrain | Red yellow latesols | Dry |
| P2 | 8°06'34.27" | 79°49'34.12" | |||||
| P3 | 8°08'46.67" | 79°50'12.11" | |||||
| P4 | 8°02'55.65" | 79°49'09.16" | |||||
| P5 | 8°05'24.37" | 79°48'41.85" | |||||
| P6 | 8°07'44.85" | 79°50'09.18" | |||||
| Chilaw | Chilaw lagoon | C1 | 7°32'48.69" | 79°48'26.55" | flat terrain | Alluvial soil | Intermediate |
| C2 | 7°32'29.06" | 79°48'46.99" | |||||
| C3 | 7°32'12.09" | 79°49'02.84" | |||||
| C4 | 7°30'43.38" | 79°49'21.33" | |||||
| C5 | 7°31'00.36" | 79°48'51.67" | |||||
| C6 | 7°30'45.26" | 79°48'59.82" | |||||
| Negombo | Negombo estuary | N1 | 7°12'23.13" | 79°50'08.85" | flat terrain | Latesols and Regosols | Wet |
| N2 | 7°11'56.49" | 79°51'03.14" | |||||
| N3 | 7°10'19.30" | 79°52'03.87" | |||||
| N4 | 7°07'02.78" | 79°52'36.74" | |||||
| N5 | 7°06'24.49" | 79°52'22.92" | |||||
| N6 | 7°05'54.42" | 79°51'24.06" | |||||
| Rekawa | Rekawa lagoon | R1 | 6°02'35.88" | 80°49'25.11" | undulating terrain | Reddish brown Earth | Intermediate |
| R2 | 6°02'37.43" | 80°49'48.91" | |||||
| R3 | 6°02'42.56" | 80°50'11.48" | |||||
| R4 | 6°02'44.93" | 80°50'50.23" | |||||
| R5 | 6°02'58.09" | 80°51'26.49" | |||||
| R6 | 6°03'14.03" | 80°50'50.94" | |||||
| Batticaloa | Batticaloa lagoon | B1 | 7°45'11.48" | 81°41'10.25" | flat terrain | Regosols | Dry |
| B2 | 7°43'04.46" | 81°42'09.07" | |||||
| B3 | 7°45'15.90" | 81°37'48.11" | |||||
| B4 | 7°41'26.33" | 81°43'21.88" | |||||
| B5 | 7°39'05.65" | 81°44'28.12" | |||||
| B6 | 7°36'22.27" | 81°46'07.19" | |||||
| Upparu | Upparu lagoon | U1 | 8°06'08.95" | 81°26'24.79" | flat terrain | Regosols | Dry |
| U2 | 8°09'33.10" | 81°21'49.13" | |||||
| U3 | 8°16'08.97" | 81°23'19.41" | |||||
| U4 | 8°20'45.18" | 81°23'13.63" | |||||
| U5 | 8°27'04.23" | 81°21'11.14" | |||||
| U6 | 8°26'29.00" | 81°13'33.19" |
| Site | No. of species | No. of individuals | Shannon index (H') | Species dominance (d) | Pielou’s evenness (J') | Taxonomic index (Δ) |
|---|---|---|---|---|---|---|
| T1 | 5 | 5686 | 1.47 | 0.46 | 0.91 | 73.82 |
| T2 | 5 | 5711 | 1.31 | 0.46 | 0.81 | 68.54 |
| T3 | 5 | 5688 | 1.28 | 0.46 | 0.79 | 69.25 |
| T4 | 5 | 5665 | 1.26 | 0.46 | 0.78 | 68.49 |
| T5 | 5 | 6353 | 1.23 | 0.46 | 0.77 | 65.34 |
| T6 | 5 | 5647 | 1.23 | 0.46 | 0.76 | 68.28 |
| M1 | 4 | 1050 | 1.16 | 0.43 | 0.84 | 62.95 |
| M2 | 4 | 943 | 1.29 | 0.44 | 0.93 | 70.65 |
| M3 | 4 | 1152 | 1.11 | 0.43 | 0.80 | 59.42 |
| M4 | 4 | 837 | 1.25 | 0.45 | 0.90 | 68.70 |
| M5 | 4 | 760 | 1.32 | 0.45 | 0.95 | 71.76 |
| M6 | 4 | 627 | 1.29 | 0.47 | 0.93 | 69.36 |
| P1 | 9 | 2709 | 1.84 | 1.01 | 0.84 | 79.76 |
| P2 | 9 | 2822 | 1.85 | 1.01 | 0.84 | 79.60 |
| P3 | 9 | 2450 | 1.86 | 1.03 | 0.85 | 78.36 |
| P4 | 9 | 2457 | 1.93 | 1.02 | 0.88 | 80.47 |
| P5 | 9 | 2010 | 2.06 | 1.05 | 0.94 | 84.05 |
| P6 | 9 | 2110 | 2.09 | 1.05 | 0.95 | 85.28 |
| C1 | 15 | 22093 | 2.01 | 1.40 | 0.74 | 77.85 |
| C2 | 15 | 22319 | 2.03 | 1.40 | 0.75 | 78.07 |
| C3 | 14 | 23477 | 2.00 | 1.29 | 0.76 | 78.47 |
| C4 | 15 | 22355 | 1.96 | 1.40 | 0.72 | 77.17 |
| C5 | 15 | 22308 | 1.98 | 1.40 | 0.73 | 77.47 |
| C6 | 14 | 21916 | 1.98 | 1.30 | 0.75 | 77.58 |
| N1 | 11 | 11267 | 1.76 | 1.07 | 0.73 | 65.39 |
| N2 | 11 | 10660 | 1.70 | 1.08 | 0.71 | 62.95 |
| N3 | 11 | 11191 | 1.73 | 1.07 | 0.72 | 64.78 |
| N4 | 11 | 11112 | 1.75 | 1.07 | 0.73 | 64.75 |
| N5 | 11 | 11241 | 1.73 | 1.07 | 0.72 | 65.13 |
| N6 | 11 | 10716 | 1.66 | 1.08 | 0.69 | 62.47 |
| R1 | 10 | 14132 | 1.77 | 0.94 | 0.77 | 72.60 |
| R2 | 9 | 14477 | 1.74 | 0.84 | 0.79 | 71.67 |
| R3 | 9 | 14365 | 1.71 | 0.84 | 0.78 | 70.20 |
| R4 | 10 | 13932 | 1.69 | 0.94 | 0.74 | 70.79 |
| R5 | 9 | 14229 | 1.72 | 0.84 | 0.78 | 72.49 |
| R6 | 10 | 14105 | 1.72 | 0.94 | 0.75 | 71.95 |
| B1 | 5 | 4981 | 0.89 | 0.47 | 0.55 | 35.79 |
| B2 | 5 | 3779 | 1.05 | 0.49 | 0.65 | 43.84 |
| B3 | 5 | 2195 | 1.24 | 0.52 | 0.77 | 50.04 |
| B4 | 5 | 5937 | 0.84 | 0.46 | 0.52 | 32.24 |
| B5 | 5 | 3627 | 1.16 | 0.49 | 0.72 | 47.41 |
| B6 | 4 | 4435 | 0.81 | 0.36 | 0.58 | 31.57 |
| U1 | 3 | 4491 | 1.04 | 0.24 | 0.95 | 62.63 |
| U2 | 3 | 4887 | 1.04 | 0.24 | 0.95 | 62.46 |
| U3 | 3 | 4669 | 1.05 | 0.24 | 0.96 | 63.60 |
| U4 | 3 | 5588 | 1.08 | 0.23 | 0.99 | 65.60 |
| U5 | 3 | 5640 | 1.09 | 0.23 | 1.00 | 66.44 |
| U6 | 3 | 4393 | 1.05 | 0.24 | 0.96 | 63.40 |
| Cluster | Species | Av.Abd | Av.Sim | Sim/SD | Contrib% | Cum.% |
|---|---|---|---|---|---|---|
| Group 1 (67.68) |
R. mucronata | 2.13 | 19.19 | 3.47 | 28.35 | 28.35 |
| A. marina | 1.77 | 16.53 | 3.36 | 24.43 | 52.78 | |
| S. alba | 1.38 | 13.11 | 3.26 | 19.38 | 72.16 | |
| E. indica | 0.71 | 4.9 | 0.54 | 7.24 | 79.39 | |
| A. corniculatum | 1.4 | 3.72 | 0.53 | 5.5 | 84.9 | |
| E. agallocha | 1.01 | 2.65 | 0.54 | 3.92 | 88.82 | |
| B. cylindrica | 0.79 | 2.17 | 0.53 | 3.2 | 92.02 | |
| Group 2 (75.66) |
R. mucronata | 4.27 | 28.39 | 7.07 | 37.53 | 37.53 |
| A. marina | 3.74 | 21.56 | 1.75 | 28.5 | 66.02 | |
| L. racemosa | 3 | 17.7 | 1.95 | 23.39 | 89.41 | |
| E. agallocha | 1.46 | 6.42 | 0.85 | 8.49 | 97.9 | |
| Group 3 (69.95) |
R. mucronata | 5.37 | 12.41 | 5.22 | 17.74 | 17.74 |
| A. marina | 5.04 | 12.1 | 2.98 | 17.29 | 35.03 | |
| A. officinalis | 3.8 | 8.92 | 1.42 | 12.75 | 47.78 | |
| C. tagal | 4.1 | 6.97 | 1.16 | 9.97 | 57.75 | |
| A. corniculatum | 2.23 | 5.68 | 4.22 | 8.13 | 65.87 | |
| E. agallocha | 3.64 | 5.59 | 0.86 | 7.99 | 73.87 | |
| B. gymnorrhiza | 2.24 | 4.63 | 2.46 | 6.62 | 80.49 | |
| B. cylindrica | 3 | 4.21 | 0.85 | 6.01 | 86.5 | |
| L. racemosa | 2.75 | 4.19 | 1.62 | 5.99 | 92.49 |