Distribution Strategies of Vascular Plants at the Reclaimed Lands at the Saemangum Sea Dike
Department of Biological Science,
Mokpo National University, Korea
Department of Biological Science,
Mokpo National University, Korea
Department of Biological Science,
Mokpo National University, Korea
Division of Ecological Assessment,
National Institute of Ecology, Korea
Department of Biology,
Kunsan National University, Korea
Division of Ecological Survay Research,
National Institute of Ecology, Korea
Institution for Marine and Island Cultures, Mokpo National University, Korea
Department of Biological Science,
Mokpo National University, Korea
Korea Environmental Technology Consulting Hotline, Korea
Institution for Marine and Island Cultures, Mokpo National University, Korea
Division of Ecosystem Research,
National Park Research Institute, Korea
Team of National Ecosystem Survey,
National Institute of Ecology, Korea
Division of Ecological Assessment,
National Institute of Ecology, Korea
Department of Biological Science,
Mokpo National University, Korea
Department of Biological Science,
Mokpo National University, Korea
keco@mokpo.ac.kr
Abstract
The distribution of plant communities in the reclaimed land of the southwestern coasts of South Korea, along with the environmental or plant factors, was studied through canonical correspondence analysis (CCA) and the competitor (C), stress tolerator (S), and ruderal (R) (CSR) ecological strategies. The coastal reclaimed land plants were classified into three plant-factor groups in the CCA biplot diagram. Axis1 was correlated with LS, SLA, CH, and FS. Axis 2 was correlated with LDMC, FP, and LDW. The reclaimed landplants were classified into three soil-factor groups in the CCA biplot diagram. First, the group factor was correlated with SAND. Second, the group factor was distributed according to T-N and TOC. Third, the group factor was distributed according to Salinity content. To clarify the relative significance of competition, stress, and disturbance in the distribution process of plant communities, the CSR distribution model was adopted. Sixteen of the 19 species were allocated to the factors related to the ruderals strategies such as R/CR and CR including R/CSR, SR/CSR, and CR/CSR, and SC strategies. They displayed ruderal and competition adaptation strategies reflecting the ecological environment. Seven species showed R/CR (ruderal/competitor-ruderal) strategies; Aeschno meneindica, Chenopodium album var. centrorubrum, Lolium perenne, Lotus corniculatus var. japonicus, Phragmites communis, Portulaca oleracea, and Soncous brachyotus and 6 species showed CR (competitor-ruderal) strategies; Bidens frondosa, Echinochloa crus-galli, Echino chloaoryzicola, Erigeron canadensis, Fimbristy lislongispica and Setaria viridis. The three species with R-related strategies were Artemisia princeps, Lolium perenne, and Trifolium repens. The distribution patterns of the CCA diagrams and CSR triangles may provide a useful scientific basis for protecting and restoring reclaimed lands and their valuable ecosystem services, from the increasing disturbances.
Keywords
reclaimed land, CCA analysis, CSR strategy, plant distribution
Introduction
Sea reclamation is an effective solution for human population pressure (Pomeroy and Wiegert 1981, Alvarez-Rogel 2007, Zhu et al. 2014) and provides land for agricultural production, urban and industrial development, and port construction. Currently, the development of coastal zones that started in the 1950s, has entered a peak period, especially in developing countries. Notably, the scale and scope of reclamation in coastal lands are larger than in interior lands, and pose substantial environmental risks.
With the increasing growth of the economy and population in Asia, there has been a shortage of land for farming, industrial use, and housing development (Shim et al. 2009). Consequently, tidal flats on the coasts of Eastern Asia are being converted to sea reclaimed land (Min and Kim 1999a, 1999b, Wang et al. 2014). The reclaimed land has characteristics of both coastal soils and inland salt marshes, (Min and Kim, 1999a). After reclamation, the sediment becomes the common soil as soil salts leach over time. The leaching rate is influenced by rain intensity, topography, and geographical properties, and soil texture. Therefore, plant species growing in reclaimed lands differ in their inherent salt tolerance (Ihm et al., 1995, Zhu et al. 2014, Cho et al. 2018) and vegetative zonation develops according to the topography or distance from the high water mark to farther inland sites. In South Korea, several properties of reclaimed land have been investigated, including soil properties and desalinization patterns (Min and Kim 1999a,1999b); ecological properties of halophytes and soil amelioration; the relationship between halophyte distribution and soil environment; plant productivity and mineral cycling; and energy flow.
In areas that are periodically inundated by tides, the zonation of the plant community is not regarded as successional, because the tidal-flat vegetation in these areas is not formed by interactions among plants but, by erosion and silt accumulation (Min and Kim 2000). On reclaimed lands, plant succession proceeds after reclamation (Min and Kim 2000). The main factor that determines succession is the soil environments on reclaimed lands and because these soil properties change rapidly the rate of vegetational succession is faster on reclaimed land than on common land. In the early stages of succession, the plant species are mostly annuals. Species diversity reaches a maximum of 10 years after reclamation. The variability in succession rates is related to the pattern of creek distribution along different topological altitudes (Min and Kim 2000, Kim et al. 2010, Cho et al. 2017).
Unfortunately, sea reclamation activities such as embanking may cut off the tidal creek and alter its development (Zhu et al. 2014). The vegetation boundary could also be influenced by changes of the tidal creek as a result of coastal wetland reclamation. When evaluating land reclamation areas, it is important to consider the shape of the enclosed boundary. In addition, artificial beach nourishment has been shown as is an effective method for alleviating the possible negative effects of artificial shorelines and minimizing the negative impacts on the ecosystems (Kim 2005, Zhu et al. 2014).
Moreover, during reclamation soils undergo fundamental changes and are subsequently re-exposed to tidal inundation by de-embankment (Hazelden & Boorman 2001, Garbutt and Wolters 2008), and re-colonisation may be delayed by unsuitable hydrological and edaphic conditions that facilitate plant species establishment. The water dynamics of the reclaimed lands have a basic fundamental control on vegetation patterns, and determines the potential for aerobic respiration and the ability of the plant species to tolerate local conditions. This may account for the differences in species richness and abundance between the more moisture tolerant and low moisture tolerant species such as Salicornia europaea, Spartina anglica, Aster tripolium, and Puccinellia maritima communities.
Considering the negative effects of sea reclamation on the environment and ecosystems in the coastal zone (Min and Kim 1999a, 1999b, Wang et al. 2014, Zhu et al. 2014), the environmental and ecological impacts of sea reclamation must be addressed, in order to protect the coastal wetlands and sustain developing economies (Min and Kim 1997, Zhang et al. 2012). While progressive evaluation of the reclaimed land plays an important role in the protection of coastal wetlands, unfortunately, variations in the shoreline, which is the connection between sea and land, are influenced by land reclamation, and consequently, may affect vegetation evaluation in coastal wetlands and habitat distribution (Lee et al. 2016, Suzuki 2003, Min and Kim 1999b, Zhu et al. 2014). Especially, the salts estimated using the vegetation index can be overestimated when the time lag is ignored because an already desalinized area might be estimated as a highly saline area due to the lack of vegetation cover (Cho et al. 2014).
Our research hypotheses were as follows: We expected that in the coastal reclaimed lands, plants would be classified by disturbance- or stress-tolerant and competition-related variables, and that a higher proportion of the strategies would be near the ruderal corner of the triangle (i.e., R/CR and CR including R/CSR, SR/CSR and CR/CSR strategies) (Grime 1974). Since coastal reclaimed land plant communities have distinct soil environmental features (salinity, moisture, flooding etc.), we expected that these differences would show diverse functional strategies and features in the Canonical Correspondence Analysis (CCA) Ordinations. We expected that the results of this study would show the importance of plant species distribution in CCA ordinations and C, S, and R strategies in the coastal reclaimed lands.
Methods
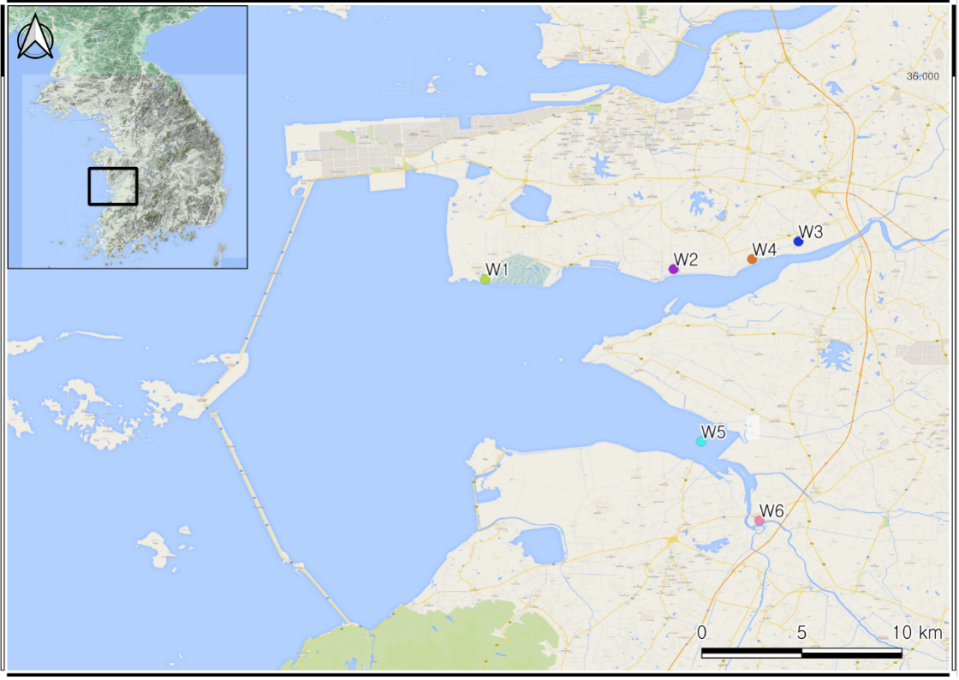
We examined several soil environments and plant factors, and analyzed them for vascular plant distributions of South Korea reclaimed lands (Fig. 1).
Study Area
Nineteen reclaimed plant communities were sampled from the reclaimed lands of the west coast of South Korea (Fig. 1). The coastline had disappeared and there has been a total of 401 km2 of reclaimed land since 2010 April. We evaluated six west reclaimed lands. The habitat disturbance and status of the study sites are included in Table 1.
| Abbreviation | Local Name | Latitude | Longitude | Habitat status | Dominant community |
|---|---|---|---|---|---|
| W1 | Seonyeon-ri | 35.89044 | 126.63622 | Pioneer species of early stages in secondary succession | Phragmites communis |
| W2 | Wolyeon-ri | 35.89425 | 126.73666 | Pioneer species | Calamagrostis epigeios |
| W3 | Jeungseok-ri | 35.90694 | 126.79469 | Pioneer species | P. communis |
| W4 | Hakdang-ri | 35.90155 | 126.78163 | Pioneer species | P. communis |
| W5 | Eunpa-ri | 35.80902 | 126.76270 | Pioneer species | Chenopodium album var. centrorubram |
| W6 | Yeonpo-ri | 35.75541 | 126.78255 | Pioneer species | Erigeron annuus |
Plant research by species
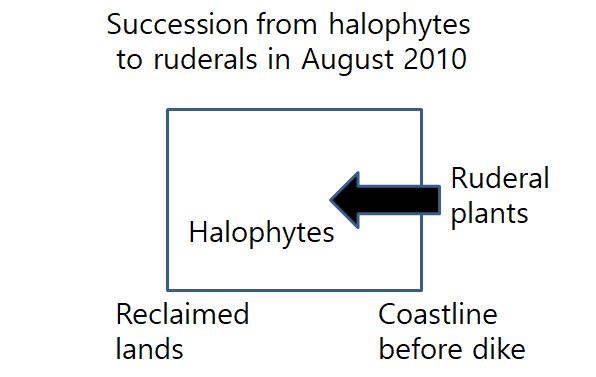
We did Canonical Correspondence Analysis (CCA) and the competitor (C), stress tolerator (S), and ruderal (R) (CSR) ecological strategies on 19 communities (1 x 1m2 quadrat, 3 replicates per species) from six areas of the reclaimed lands from July–September 2020 (Table 1) — the 33.9-kilometer-long dike August 2010 and World’s longest dike.
The six areas and dominant species as shown in Table 1 were Seonyeon-ri, Phragmites communis (Common reed), Wolyeon-ri, Calamagrostis epigeios (Wood small reed), Jeungseok-ri, P. communis (Common reed), Hakdang-ri, P. communis; Eunpa-ri, Chenopodium album var. centrorubram (Red-center goosefoot), and Yeonpo-ri, Erigeron annuus (Annual fleabane or Daisy fleabane).
Soil analysis
We examined the soil environment near the roots at a depth of 15cm. Air-dried samples (3 replicates per each species) were used for physicochemical analysis (Lee et al. 2020) (Table 2) and soil particle sizes, salinity, total nitrogen, total organic carbon, Na+, Mg2+, Ca2+ and K+ were determined.
| Salinity (psu) | T-N (mg/kg) | TOC (%) | Ca2+ (cmol/kg) | K+ (cmol/kg) | Mg2+ (cmol/kg) | Na+ (cmol/kg) | Sand (%) | Silt (%) | Clay (%) | |
|---|---|---|---|---|---|---|---|---|---|---|
| Means | 0.098 | 187.3 | 0.256 | 62.3 | 28.7 | 38.0 | 33.3 | 49.4 | 31.5 | 19.0 |
| SD | 0.060 | 111.2 | 0.141 | 37.0 | 9.3 | 19.4 | 22.6 | 27.4 | 16.5 | 11.0 |
| N | 19 | 19 | 19 | 19 | 19 | 19 | 19 | 19 | 19 | 19 |
| MAX | 0.267 | 582.6 | 0.702 | 200.4 | 42.4 | 70.0 | 73.3 | 85.3 | 50.4 | 31.4 |
| MIN | 0.039 | 71.8 | 0.087 | 28.0 | 3.5 | 1.5 | 2.4 | 18.2 | 9.9 | 4.8 |
| Range | 0.228 | 510.8 | 0.615 | 172.4 | 38.9 | 68.5 | 70.9 | 67.1 | 40.5 | 26.7 |
Plant trait analysis
We analyzed several plant factors (Hodgson et al. 1999, Pierce et al. 2013, Lee et al. 2020) (Table 3). The coverage (%), canopy height (CH, mm), lateral spread (LS, mm), leaf area (LA, mm2), leaf dry weight (LDW, mg), leaf dry weight/water-saturated fresh mass (LDMC, %), specific leaf area (SLA, mm2mg-1), flowering period (FP), and flowering start (FS) were measured. We selected a total of 19 shrub and herbaceous species for the analysis of plant functional factors.
| Canopy height (mm) | Leaf dry matter content (%) | Flowering period (# of months) | Lateral spread (six-point model) | Leaf dry weight (mg) | Specific leaf area (mm2 mg-1) | Flowering start (month) | |
|---|---|---|---|---|---|---|---|
| Means | 658 | 21 | 3 | 3 | 62 | 27 | 5 |
| SD | 451 | 9 | 1 | 1 | 78 | 9 | 1 |
| N | 19 | 19 | 19 | 19 | 19 | 19 | 19 |
| MAX | 2000 | 38 | 4 | 6 | 330 | 45 | 6 |
| MIN | 200 | 5 | 2 | 1 | 4 | 13 | 3 |
| Range | 1800 | 33 | 2 | 5 | 326 | 32 | 3 |
Statistical analyses
We carried out CCA analyses of soil and plant factors using CANOCO 5.1 (Ter Braak and Smilauer 2018, Lee et al. 2020) (Table 2). The CSR strategies were formulated using plant functional factors and the triangular diagrams were generated according to Hodgson et al. (1999) and Pierce et al. (2013), using Sigma Plot 13 (www.sigmaplot.com).
Results
The most abundant species (Table 3, 4 and Fig. 2, 3) in the reclaimed land was Phragmatis communis (cover=100%), which exhibited a SC (stress-tolerant-competitor strategy) (C:S:R=54.0:43.9:2.1). The second most abundant species were Aeschnomene indica and Lotus corniculatus var. japonicus (cover=100%) exhibited a R/CR (ruderal-competitor) strategy (C:S:R=36.4:0.0:63.6; C:S:R = 37.5:0.0:62.5). The third most abundant species were Calamagrostis epigeios and Trifolium repens (cover=90%) exhibited a C/CSR (competitor/competitor-stress-tolerant-ruderal) and R/CSR (ruderal /competitor-stress-tolerant-ruderal) strategy (C:S:R=67.8:29.0:3.2; C:S:R =3.16:7.5:60.9, respectively).
| Species | Percentage from Hodgson et al.(1999) | Strategy type | Plant cover (%) | ||
|---|---|---|---|---|---|
| C(%) | S(%) | R(%) | |||
| Aeschnomene indica | 36.4 | 0.0 | 63.6 | R/CR | 100 |
| Artemisia princeps | 47.5 | 14.6 | 37.9 | CR/CSR | 60 |
| Bidens frondosa | 52.3 | 0.0 | 47.7 | CR | 60 |
| Calamagrostis epigeios | 67.8 | 29.0 | 3.2 | C/CSR | 90 |
| Chenopodium album var. centrorubrum | 39.0 | 0.0 | 61.0 | R/CR | 50 |
| Echinochloa crus-galli | 51.1 | 0.0 | 48.9 | CR | 50 |
| Echinochloa oryzicola | 55.7 | 0.0 | 44.3 | CR | 70 |
| Erigeron annuus | 60.7 | 0.0 | 39.3 | C/CR | 70 |
| Erigeron canadensis | 52.4 | 0.0 | 47.6 | CR | 70 |
| Fimbristylis longispica | 49.3 | 0.7 | 50.0 | CR | 50 |
| Lolium perenne | 37.5 | 41.8 | 20.7 | SR/CSR | 30 |
| Lotus corniculatus var. japonicus | 37.5 | 0.0 | 62.5 | R/CR | 100 |
| Oenothera laciniata | 35.7 | 0.0 | 64.3 | R/CR | 90 |
| Phragmites communis | 54.0 | 43.9 | 2.1 | SC | 100 |
| Portulaca oleracea | 26.0 | 0.0 | 74.0 | R/CR | 80 |
| Rumex maritimus | 35.0 | 0.0 | 65.0 | R/CR | 50 |
| Setaria viridis | 49.5 | 0.0 | 50.5 | CR | 30 |
| Soncous brachyotus | 31.2 | 0.0 | 68.8 | R/CR | 20 |
| Trifolium repens | 31.6 | 7.5 | 60.9 | R/CSR | 90 |
Sixteen of the 19 species were allocated to the factors related to ruderals strategies such as R/CR and CR including R/CSR, SR/CSR, and CR/CSR and SC strategies (Table 4, Fig. 4 and 5). They displayed ruderal and competition adaptation strategies reflecting the ecological environment (Lee et al. 2020). Seven species showed R/CR (ruderal/competitor-ruderal) strategies; A. indica, Chenopodium album var. centrorubrum, Lolium perenne, L. corniculatus var. japonicus, P. communis, Portulaca oleracea, and Soncous brachyotus. Six species showed CR (competitor-ruderal) strategies; Bidens frondosa, Echinochloa crus-galli, Echinochloa oryzicola, Erigeron canadensis, Fimbristy lislongispica, and Setaria viridis (Table 4 and Fig. 4). They had 300–2000mm in R/CR species and 400–1000mm CR species in canopy height, 5–17 and 18–26% LDMC and 20–37 and 15–45 mm2/mg SLA. The three species with R-related strategies were Artemisia princeps, L. perenne and T. repens. The CSR strategy-conversion was carried from Fig. 4 (soil factors) and to Fig. 5 (plant factors). We will develop new alternative factors for mutual conversions.
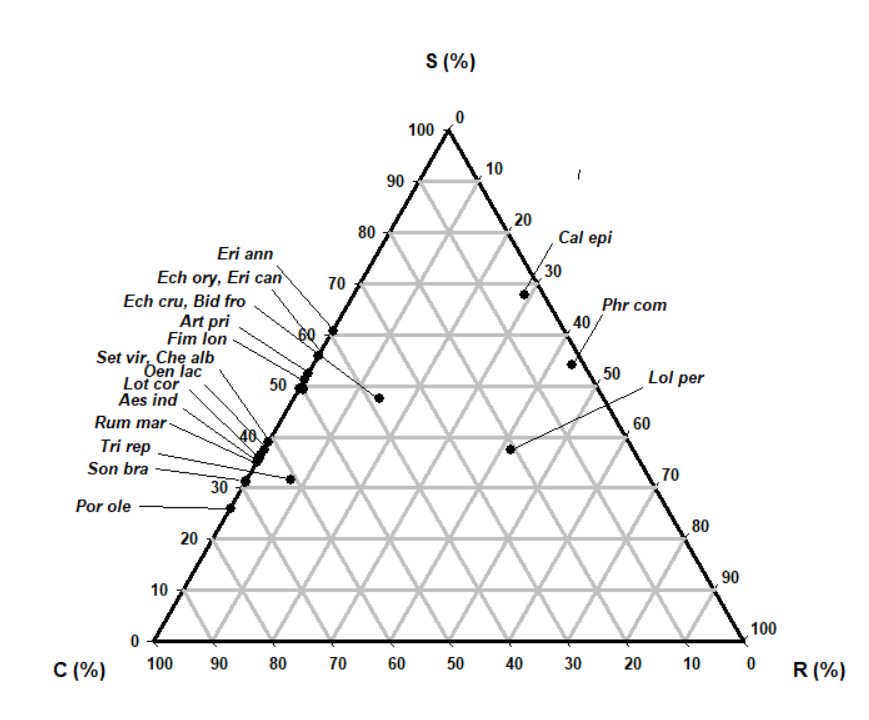
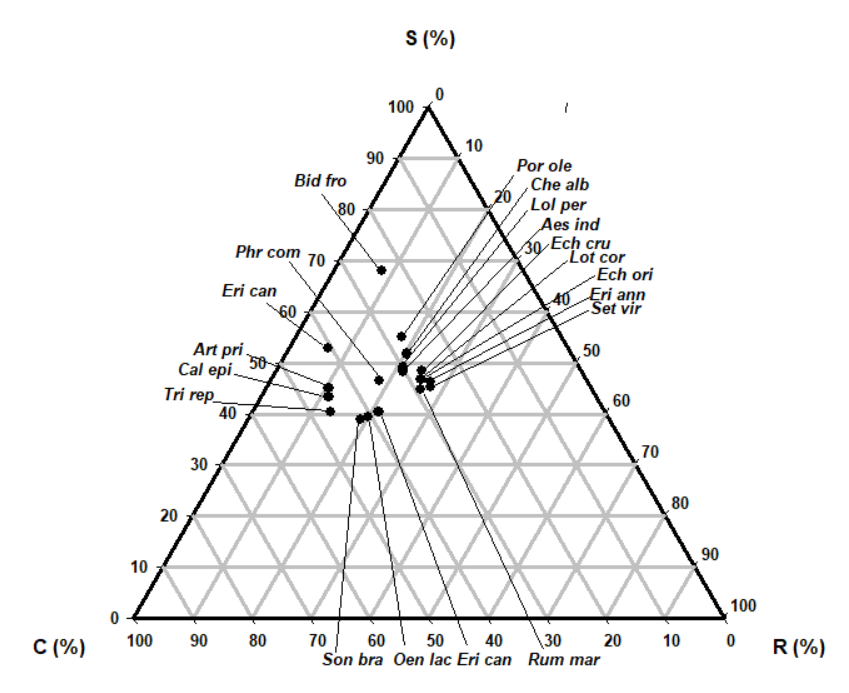
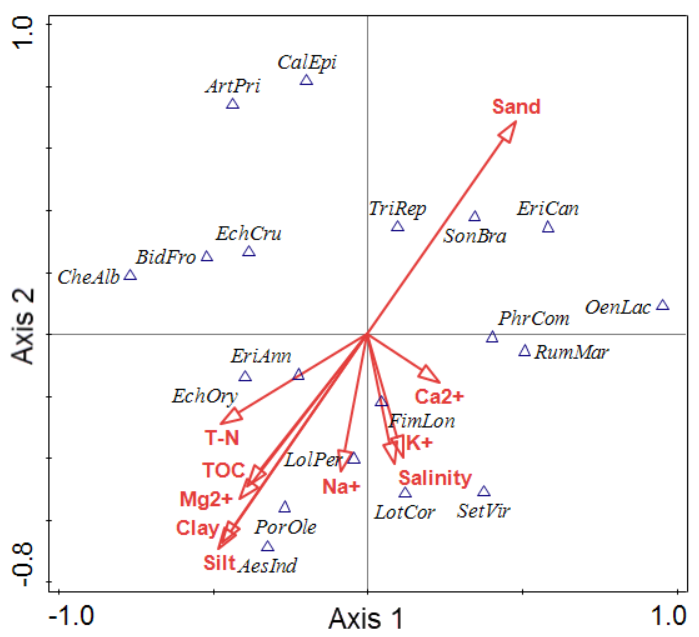
Figure 2 shows the canonical correspondence analysis (CCA) bi-plot diagram of the reclaimed lands on the southwestern coasts of South Korea (Lee et al. 2018, 2020). Axes 1 and 2 are the vegetation plots and the soil factors (Table 2). The soil factors are shown as arrows. The 19 plant communities, classified into three groups, are displayed on axes 1and 2, Group 1 was correlated with Sand (Table 4), Group 2 was correlated with T-N and TOC, and Group 3 was correlated with Salinity. The explanatory variables accounted for 50.00% of the variation. The eigenvalues of axes 1 and 2 were 1.0000 and 1.0000, respectively.
The lengths and positions of the arrows provide information about the relationship between the soil factors and the derived axes. Arrows that are parallel towards an axis (e.g. sand and axis 1) indicate a correlation, the length of the arrow tells us about the strength of that correlation. Thus, Ca2+ is related to axis 1 but not as strongly as sand. Consider C. epigeios, it has a high score of axis 2. It is associated with salinity, silt, Na+ and clay, however, because the correlation between salinity, silt, Na+ and clay and axis 2 is negative (also shown by the direction of the arrows), large positive scores on axis 2 should have low values for sand, whilst large negative values on axis 2 should have lots of sand. Thus we expected C. epigeios to have little silt, whilst L. corniculatus var. japonicus would have a lot of silt. Similarly, C. album var. centrorubrum and Oenother alaciniata are at opposite ends of the T-N and Ca2+ gradient.
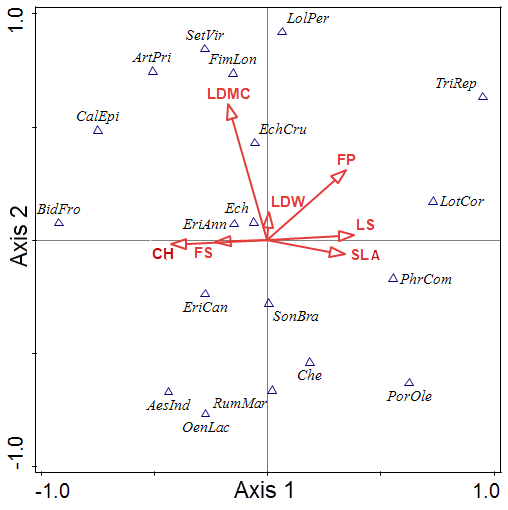
Figure 3 presents the CCA ordination results of the coastal plant data set. The 19 community scores are plotted along axes 1 and 2 (Table 2). The CCA eigen values for the first two ordination axes were 1.0000 and 0.9999, respectively. The explanatory variables accounted for 38.89% of the variance in the community data.
LS, SLA, CH, and FS were related to axis 1. Lolium perenne has a high score of axis 2. Axis 2 is associated with LDMC, FP, and LDW, because the correlation between LDMC, FP and LDW and axis 2 is positive (also shown by the direction of the arrows), large positive scores on axis 2 should have low values for LDMC, whilst large negative values on axis 2 should have high values of LDMC. Erigeron annuus and P. communis are at the opposite ends of the SLA, LS, CH, and FS gradient.
The CCA conversion was carried out from Figure 2 (soil factors) to Figure 3 of (plant factors) by many researchers. We can develop new alternative factors for mutual conversions.
Discussion
In the present study, our objective was to identify the CSR strategies of coastal reclaimed land plants. Plant factor measurements (Hodgson et al. 1999, Negreiros et al. 2014) and Braun-Blanquet’s vegetation classification (1964) were useful for reclaimed land-plant conservation in South Korea. Ihm and Lee (1998) reported that, to describe the major environmental factors and to characterize the distribution of the plant species over the reclaimed lands, 10 physical and chemical properties of the soil in the reclaimed land should be assessed: the gradient of the soil particle sizes, salinity, total nitrogen, total organic carbon, Na+, Mg2+, Ca2+ and K+. In the present study, the 19 plant communities, classified into three, are displayed on axes 1 and 2. Sonchus brachyotus, Erigeron canadensis and Trifolium repens were correlated with Sand. Lolium perenne, Portulaca oleracea, Aeschynomene indica and Echinochloa oryzicola were correlated with Clay, Silt, T-N and TOC, and Lotus coniculatus var. japonicus, Setaria viridis, and Fimbristylis longispica was correlated with Salinity, K+ and Ca2+. The results could account for the succession of plant communities on reclaimed lands.
In the diagram produced by CCA, the pattern of ordination was consistent with that of our DCA or CCA results (Ihm et al. 2007, Lee et al. 2012).The communities were arranged in two groups of reclaimed land and other vegetation along Axis 1. CCA Axis 1 displayed soil water and osmotic potential, soil moisture content, electrical conductivity, and organic matter gradient. In all, 14.9% of the variance among the species data could be explained by the two CCA axes. These low values could be attributed to the high noise levels in typical species-abundance data (ter Braak 1986).
In a plant species distribution study on five reclaimed lands, intertidal flats (control) on the western coast of South Korea were studied (Min and Kim 1999a, 1999b, Lee et al. 2014). Ten soil properties were analyzed. Of these, flooding, drought (soil moisture) and salinity had the greatest effect on plant distribution. The plant species were divided into four groups, according to the amount of soil moisture found at their habitats. Triglochin maritimum and Typha angustata were found on the most west sites; Phragmites communis, Carex scabrifolia, Suaeda japonica, Zoysia sinica, and Salicornia herbacea in places with relatively high moisture; Aster tripolium and Phacelurus latifolius in areas with medium levels of moisture; and Atriplex subcordata, Chenopodium virgatum and Trifolium repens in the driest areas (Min and Kim 1999a).
On reclaimed land, plant species were aligned according to the degree of desalinization (i.e., salinity levels). Species composition and vegetation profiles changed conspicuously over time and according to the topographical regions (Min and Kim 1999a, 1999b). Regardless of the time after reclamation, halophytes and glycophytes coexisted on the sites where the soil salts leaching was slow. Species association among plants was weak in the early stages on the reclaimed lands. However, with time, the strength of species associations increased among halophytes and glycophytes, and the two groups were linked by salt-tolerant glycophytes. This resulted in a series of species associations on the old reclaimed lands. In the study of plant community ordination, halophytic communities were located on one side of axis I, glycophytic communities on the other side and several communities of salt-tolerant glycophytes were located between the two groups.
In a previous study, plant succession and the interaction between soil and plants after reclamation were investigated on the west coast of Korea (Min and Kim 2000, Fang et al. 2017, Fig. 6). Their study included one natural tidal flat site (Namdong), and five sites that differed in the number of years since being reclaimed: Hyundai A (1 yr); Hyundai B (2 yr); Jangdeog (8 yr); Mado (12 yr); and Baegseog (30 yr) (Min and Kim 2000). The number of plant species occurring at each site was 10, 9, 15, 30, 28, and 38, respectively. Based on the distribution ranges of the plants along salt gradients and soil moisture contents, and species associations and life forms, plant succession was divided into two sere groups, hydrarch and xerarch. The major species of the former were Phragmites communis and Typha angustata. Species associated with the latter were [Suaeda japonica] → [Salicornia herbacea, S. japonica, Atriplex subcordata, Suaeda asparagoides] → [Aster tripolium, Carex scabrifolia, Zoysia sinica, Limonium tetragonum] → [Artemisia scoparia, Calamagrostis epigeios, and Setaria viridis] → [Imperata cylindrica var. koenigii, Sonchus brachyotus, S. viridis] → [Aeschynomene indica, Lotus corniculatus var. japonicus, Trifolium repens, and other non-halophytes]. The progression of interactions between soil and plants through succession was influenced by salt leaching, increase in species richness and biomass, increase in soil organic matter, increase in total nitrogen and decrease in the soil bulk density, and/or salt leaching, increase in phytomass and decrease in soil-available phosphorus (Min and Kim 2000).
In this study, sixteen of the 19 species were allocated to the factors related to ruderals strategies such as R/CR and CR including R/CSR, SR/CSR and CR/CSR strategies (Table 4). They displayed reclamation adaptation strategies reflecting the ecological environment. In the study area, 7 species showed R/CR (ruderal/competitor-ruderal) strategies; A. indica, Chenopodium album var. centrorubrum, Lolium perenne, L. corniculatus var. japonicus, P. communis, Portulaca oleracea, and S. brachyotus and 6 species showed CR (competitor-ruderal) strategies; Bidens frondosa, Echinochloa crus-galli, Echinochloa oryzicola, Erigeron canadensis, Fimbristylis longispica and S. viidis. The three species with R-related strategies were Artemisia princeps, Lolium perenne and T. repens.
The plant distribution patterns, as influenced by soil salinity levels were similar to those associated with EC. This was because the correlation between EC and Na+ or Cl− were very high, as reported by Min and Kim (1999a, 1999b). In addition, Mg2+ and Ca2+ were constituents in the saline soil, but at levels lower than those of Na or Cl ions. Mg and Ca contents did not influence plant distribution in the reclaimed areas.
Through the analysis of soil EC, it is clearly shown that the spatial characteristics of EC changed during a brief period of time (2014–2016) (Cho et al. 2018). They reported that the area colonized by halophyte increased in part of reclaimed area (not in whole area) after extreme drought. Despite the general explanation of the accumulating salt, the phenomenon is not prevailing in all the reclaimed area, but appears in parts of the area. The underlying mechanism of salt movement is not clear. Solute transport modeling is useful in describing and predicting soil salinity (Cho et al. 2018). Though there have been studies that built distribution models of salinity (Sadro et al., 2007, Wang et al., 2007) and vegetation in intertidal zone, modeling in a reclaimed area is rarely conducted (Fig. 6). Meanwhile, the NDVI could have been overestimated when the vegetation is was low, and it may have decreased when the vegetation cover was denser (Cho et al. 2018). The MSAVI reflected the state of vegetation more precisely than the NDVI. Though the relationship between soil EC and the vegetation distribution has been studied in many studies, the effect of time lag on the relationship has rarely been a concern. Based on our results, the variance of the vegetation distributionis more clearly explained by the EC of the previous year.
Acknowledgments
This research was supported by the Basic Science Research Program through the National Research Foundation of Korea (NRF) funded by the Ministry of Educationof Korea (NRF-2018R 1D 1A 1B06043748).
References
- Alvarez-Rogel, J., Jiménez-Cárceles, F.J., Roca, M.J., Ortiz, R., 2007. Changes in soils and vegetation in a Mediterranean coastal salt marsh impacted by human activities. Estuar Coast Shelf S, 73, 510–526.
- Braun-Blanquet, J., 1964. Pflanzensoziologie. Grundzuge der Vegetationskude (p. 865). Wien, New York: Springer-Verlag.
- Cho, J.-S., Lee, J.-S., Kim, J.-W., 2017. Distribution of Phragmites australis communities with different habitat salinity. J Coastal Res, 33, 1210–1216.
- Cho, K.H, Beon, M.-S, Jeong, J.J., 2018. Dynamics of soil salinity and vegetation in a reclaimed area in Saemangeum, Republic of Korea. Geoderma 321, 42–51.
- Fang, S, Jia, X., Qian, Q., Cui, J., Cagle G., Hou, A., 2017. Reclamation history and development intensity determine soil and vegetation characteristics on developed coasts. Science of The Total Environment 586, 1263–1271. Available: https://doi.org/10.1016/j.scitotenv.2017.02.133.
- Garbutt, A. and Wolters, M., 2008. The natural regeneration of salt marsh on formerly reclaimed land. Applied Vegetation Science, 11, 335–344.
- Grime, J.P., 1974. Vegetation classification by reference to strategies. Nature, 250(5461), 26–31.
- Gu, J., Luo, M., Zhang, X., Christakos, G., Agusti, S., Duarte, CM., Wu, J., 2018. Losses of salt marsh in China: Trends, threats and management. Estuarine, Coastal and Shelf Science 214: 98–109. Available: https://doi.org/10.1016/j.ecss.2018.09.015.
- Hazelden, J., Boorman, L.A., 2001. Soils and 'managed retreat' in South East England. Soil use and management 17(3): 150–154.
- Hodgson, J.G., Wilson, P.J., Hunt, R., Grime, J.P., Thompson, K., 1999. Allocating C-S-R plant functional types: a soft approach to a hard problem. Oikos, 85(2), 282–294.
- Ihm, B.-S., Lee, J.-S., 1998. Soil factors affecting the plant communities of wetland on southwestern coast of Korea. Kor J Ecol, 21, 321–328.
- Ihm, B.-S., Lee, J.-S., Kim, J.-W., Kim, J.-H., 2007. Coastal plant and soil relationships along the southwestern coast of South Korea. Journal of Plant Biology, 50(3), 331–335.
- Kim, D., Cairns, D.M., Bartholdy, J., 2010. Environmental controls on multi-scale spatial pattern of salt marsh vegetation. Physical Geography, 31:58–78.
- Kim, K.D,. 2005. Invasive plants on disturbed Korean sand dunes. Estuarine, Coastal and Shelf Science, 62(1–2), 353–364.
- Lee, J.-S., Kim, J.-W., 2018. Dynamics of zonal halophyte communities in salt marshes in the world. Journal of Marine and Island Cultures, v7n1, 84–106.
- Lee, J.-S., Kim, J.-W., Lee, S.H., Myeong, H.-H., Lee, J.-Y., Cho, J.S., 2016. Zonation and soil factors of salt marsh halophyte communities. J Ecol Environ, 40:4. DOI 10.1186/s41610-016-0010-3.
- Lee, J.-S., Son, D.-H., Lee, S.-H., Myeong, H.-H., Cho, J.-S., Lee, J.-C., Lee, J.-Y., Park, C.-S., Kim, J.-W., 2020. Canonical correspondence analysis ordinations and competitor, stress tolerator, and ruderal strategies of coastal dune plants in South Korea. J Coastal Res. 36(3), 528–535.
- Min, B.M., Kim, J.-H., 1999a. Plant distribution in relation to soil of reclaimed lands on the west coast of Korea. J Plant Biol. 42:287–293.
- Min, B.M., Kim, J.-H., 1999b. Plant community structure in reclaimed lands on the West Coast of Korea. J Plant Biol. 42:279–286.
- Negreiros, D., Stradic, S.L., Fernandes, G.W., Renno, H.C., 2014. CSR analysis of plant functional types in highly diverse tropical grasslands of harsh environments. Plant Ecology, 215,379–388.
- Pierce, S., Brusa, G.,Vagge, I., Cerabolini, B.E.L., 2013. Allocating CSR plant functional types: The use of leaf economics and size traits to classify woody and herbaceous vascular plants. Functional Ecology, 27(4), 1002–1010.
- Pomeroy, L.R., Wiegert, R.G., 1981. The ecology of a salt marsh. Ecological Studies Series, vol. 38. Springer-Verlag Inc., New York, NY.
- Shim, H.-B., Cho, W.-B., Choi, B.-H., 2009., Distribution of halophytes in coastal salt marsh and on sand dunes in Korea. Korean J. Pl. Taxon. 39(4), 264–276.
- Suzuki, T., 2003. Economic and geographic backgrounds of land reclamation in Japanese ports. Marine Pollution Bulletin, 47, 226–229.
- Ter Braak, C.J.F., 1986. Canonical correspondence analysis: a new eigenvector technique for multivariate direct gradient analysis. Ecology, 67(5), 1167–1179.
- Ter Braak, C.J.F., Smilauer, P., 2018. Canoco reference manual and user's guide: software for ordination (version 5.10). Microcomputer Power (Ithaca, NY, USA), 536p.
- Wang, W., Liu, H., Li, Y., Su, J., 2014. Development and management of land reclamation in China. Ocean Coast. Manag. 102, 415–425.
- Zhang, M.H., Chen, C.P., Suo, A.N., Lin, Y., 2012. International advance of sea areas reclamation impact on marine environment. Ecology and Environmental Sciences 21, 1509–1513.
- Zhu, M.S., Sun, T, Shao, D.D., 2014. Impact of land reclamation on the evolution of shoreline change and nearshore vegetation distribution in Yangtze River Estuary. Wetlands, 36, 11–17.