Dynamics Above-Ground Carbon Stock Mangrove Ecosystems Based on Planetscope Imagery in Coastal Pakuhaji-Tangerang, Indonesia
Abstract
Mangrove ecosystems are essential in the environment to maintain the ecological function of an area. Tangerang Regency has substantial mangrove resource potential. Mangrove ecosystems on the coast of Pakuhaji-Tangerang, experienced a significant dynamic change in area in the period 2020 to 2025. The mangrove area was recorded at 235 hectares in 2020, increased to 343 hectares in 2022, then decreased to 296 hectares in 2025. In addition to its ecological function, the mangrove ecosystem in this region is also utilized as an eco-tourism area and a source of traditional medicine. Mangrove carbon stock estimation was conducted using a quadratic model approach based on NDVI values that were gradually converted into Above Ground Biomass (AGB), Above-Ground Carbon (AGC), and Accumulated Carbon Stock (ACS). The estimation model was developed through linear regression between field data and NDVI values and validated using Spearman correlation and Root Mean Square Error (RMSE) tests. The analysis showed a Spearman correlation value of 0.67 and an RMSE of 34.77, indicating an acceptable level of model accuracy. This study shows that NDVI values from PlanetScope satellite imagery can be used as a representative indicator in detecting and spatially monitoring mangrove carbon stocks.
Keywords
Above-Ground Carbon, Eco-tourism, Mangroves, NDVI, Pakuhaji, PlanetScope
1. Introduction
Biosequestration is one of the effective strategies to reduce carbon emissions through photosynthetic organisms (Khairunnisa et al., 2018). The concept of blue carbon has attracted attention because it can provide solutions and potential benefits to the problem of climate change. This concept refers to carbon sequestration by marine and coastal ecosystems such as brackish marshes, seagrasses, and mangroves (Zhu et al., 2015). As a transitional marine-land ecosystem, mangroves can sequester carbon more effectively than other terrestrial ecosystems (Zhu et al., 2020). The carbon cycle that happens in the ocean is known to be able to absorb about 55% of carbon in the atmosphere. This shows the effectiveness of mangroves as carbon sinks (Ganefiani et al., 2019). Mangroves also support various livelihoods of coastal communities (Buenavista et al., 2023).
Spatial information showing changes in mangrove ecosystem cover conditions essential in coastal area management. Remote sensing technology can be a very effective and efficient alternative to monitoring an area (Alfiansyah et al., 2023). The vegetation index is a parameter used to analyze the state of an area (Hardianto et al., 2021). In geographic information systems, the Normalized Difference Vegetation Index (NDVI) is the most commonly used vegetation index method for measuring vegetation components, as it can detect green vegetation density having a spatial resolution of 30 meters (Klompmaker et al., 2018).
The Normalized Difference Vegetation Index (NDVI) is a widely used metric for estimating vegetation density and health by analyzing the differential reflectance of red and near-infrared (NIR) wavelengths (Putri et al, 2023). The NDVI value is a value for determining the greenness of leaves with infrared Vegetation, especially healthy foliage, absorbs most of the visible red light and reflects a large portion of NIR radiation. NDVI values range from -1 to +1, with higher values indicating denser and healthier vegetation. This index serves as a valuable proxy for assessing plant vitality, canopy cover, and biomass (Hanifa et al., 2024). NDVI has been applied across various ecological contexts to monitor ecosystem health (Muzakki et al, 2021), estimate vegetation productivity (Jayanthi et al., 2017), and serve as a foundational input for modeling biomass and carbon stock estimates (Putri et al, 2023).
PlanetScope satellite imagery has the advantage of a 3-meter spatial resolution that can enable a higher level of accuracy compared to lower spatial resolution satellite imagery. This imagery is available daily, which allows for more specific temporal analysis (Kurniawansyah et al., 2022). However, as a passive sensor, PlanetScope's optical imagery has limitations in detecting vegetation and is susceptible to cloud cover interference, which is often a challenge in the tropics (Hanifa et al., 2024). This imagery was selected for its ability to provide detailed information on the structure and distribution of mangrove vegetation, it is essential to analyse land cover change at a finer spatial scale and support more accurate carbon estimation. Research conducted by (Hanifa et al., 2024) shows that the use of PlanetScope imagery is effective in analyzing temporal changes in mangrove canopy cover. (Purnamasari et al., 2021) The study revealed that PlanetScope imagery has the potential to estimate and map aboveground carbon stocks in mangrove ecosystems. The research shows the importance of utilizing high-resolution satellite imagery in supporting mangrove ecosystem monitoring.
One coastal area with significant resource potential is Tangerang Regency, with a recorded mangrove area of 415.89 ha in 2017 (Marlianingrum et al., 2021). The mangrove forest ecosystem in Tangerang Regency is spread across seven coastal subdistricts, namely Kosambi, Teluknaga, Kronjo, Kemiri, Mauk, and Pakuhaji (Marlianingrum et al., 2021). Pakuhaji Sub-district has considerable mangrove resource potential. However, the existence of mangroves in this area is threatened by rampant infrastucture development, such as settlement, roads, and industrial areas, as well as changes in land use. In another case, yhe phenomenon of abrasion in this area also worsens environmental conditions. The impact of abrasion causes damage to ponds, settlements, and mangrove ecosystems, so that community activities are disrupted, and it is quite difficult to find income (Sihombing & Pramono, 2024).
This study aims to analyse changes in mangrove cover and carbon stocks, and to explore their relationship with socio-cultural factors shaping the use and management of mangrove resources by coastal communities in Pakuhaji Sub-district, Tangerang Regency. High-resolution PlanetScope satellite imagery was utilised alongside remote sensing and spatial analysis techniques to examine landscape-scale changes over time. The novelty of this research lies in its focused investigation of mangrove dynamics in the Pakuhaji area—an understudied coastal region facing increasing anthropogenic pressures. To date, limited attention has been paid to the intersection of ecological change and community interactions in this locality. By addressing this gap, the study contributes to a more nuanced understanding of how land use change, carbon sequestration potential, and local livelihoods are interconnected. The findings are expected to provide valuable insights into the role of mangrove ecosystems in climate change mitigation, while informing strategies for sustainable coastal management that reflect both environmental and socio-cultural dimensions.
2. Material and Methods
This study uses a quantitative approach with NDVI-based remote sensing methods to estimate the spatial-temporal dynamics of mangrove cover and carbon stock in coastal Pakuhaji-Tangerang.
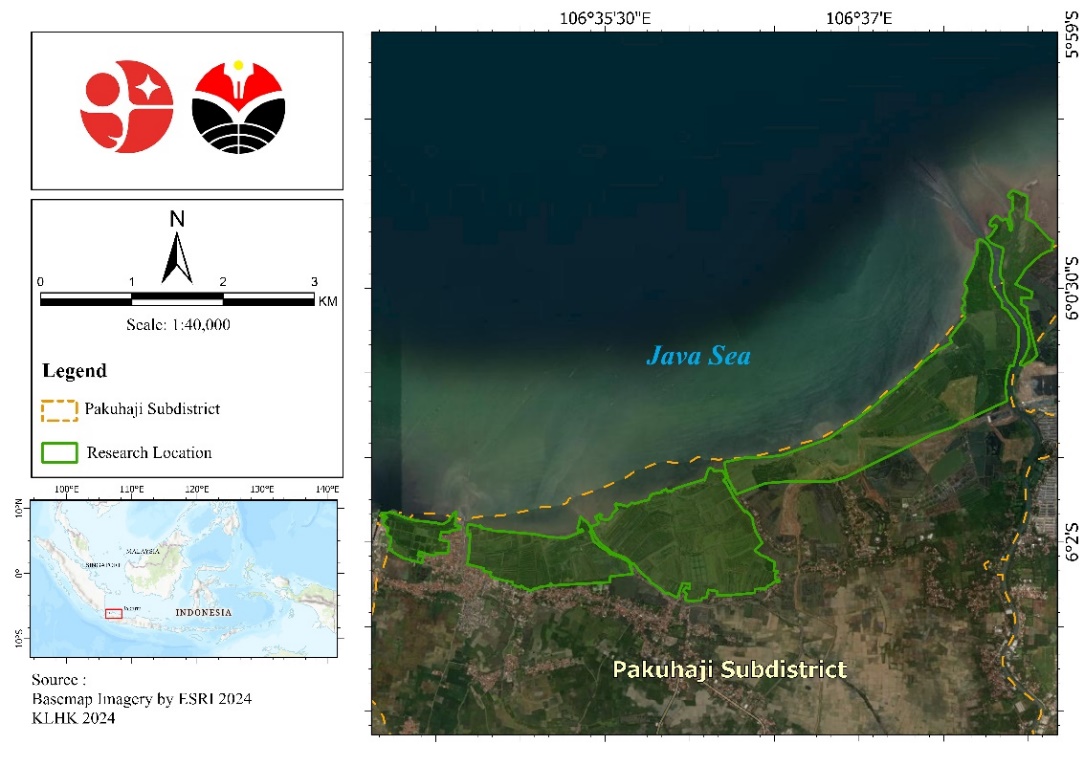
Study Area
This research was conducted in March-June 2025. This research area is in Pakuhaji Subdistrict located at coordinates 6° 4′ 47.5″ S, 106° 35′ 21.37″ E. Pakuhaji subdistrict borders the Java Sea in the north, making it a coastal area with mangrove ecosystems and dominant fisheries activities (Marlianingrum et al., 2021).
Methods
2.1 Tools and Materials
The tools used in processing satellite image data are shown in Table 1.
| Tools | Description |
|---|---|
| ArcGIS Software | PlanetScope image data processing |
| Python | Analysis statistic processing |
The materials used in this study are PlanetScope satellite images for the periods July 26, 2020, September 11, 2022, and January 06, 2025. The specifications of the PlanetScope imagery used in this study are shown in Table 2.
| Acquisition Date | Spatial Resolution | Image Code |
|---|---|---|
| July 26, 2020 | 3 m | 20200726_022844_89_2271_3B_AnalyticMS_SR_8b |
| September 11, 2022 | 3 m | 20220911_024808_01_24a5_3B_AnalyticMS_SR_8b_clip |
| January 06, 2025 | 3 m | 20250106_032955_12_2508_3B_AnalyticMS_SR_8b_clip |
2.2 Work Procedure
Data processing was carried out to analyze changes in mangrove area cover by utilizing PlanetScope satellite imagery. The collected image data was then processed using ArcGIS software to calculate the Normalized Difference Vegetation Index (NDVI) value, which serves to identify and determine the extent of mangrove cover. The estimation of mangrove biomass was then conducted using an NDVI value-based equation model, which was then converted into an estimate of the upper carbon stock. Model validation was conducted through statistical analysis using the Spearman correlation method and accuracy testing using Root Mean Square Error (RMSE) values.
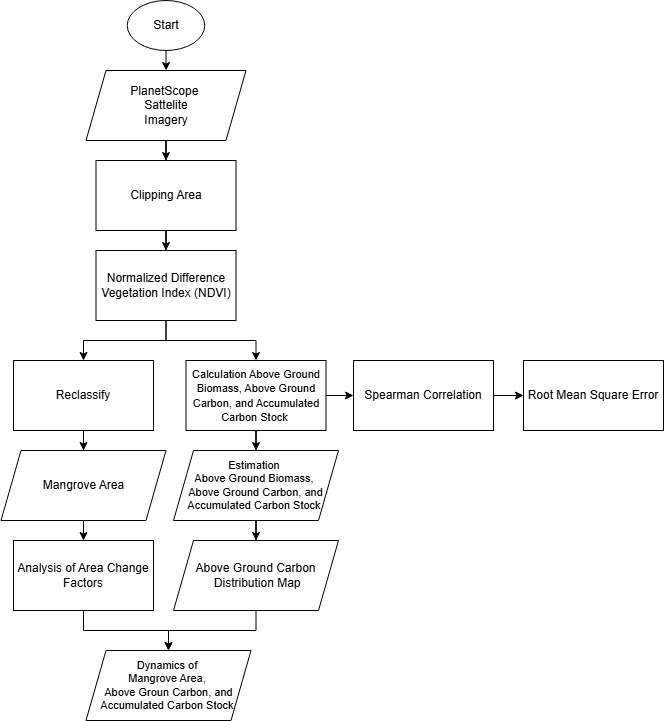
The research flow in Figure 2 is explained below.
2.2.1 Image Data Processing
Image data processing consists of PlanetScope image cropping, NDVI calculation, reclassification, to produce mangrove cover area extent, and analysis of area change factors. The initial stage of this research used PlanetScope images that have high-resolution data acquisition and atmospheric correction capabilities. This image was then cropped based on the administrative boundaries of the Pakuhaji Sub-district, which includes mangrove areas, with reference to the map from the Department of Environment and Forestry in 2024. Image processing was then carried out using the NDVI method to calculate the level of greenness (Azzahra et al., 2025). The NDVI calculation used is by the formula referring to (Alders et al., 2024) in this research:
\[ \mathrm{NDVI} = \frac{\mathrm{NIR} - \mathrm{RED}}{\mathrm{NIR} + \mathrm{RED}} \]
Description:
- NDVI
- Normalized Difference Vegetation Index
- NIR
- Near infrared band
- RED
- Red wave band
The results of analysis using the NDVI method were then reclassified into categories that have been determined based on criteria referring to (Islam et al., 2021), as detailed in Table 3.
| Category based NDVI | NDVI value range |
|---|---|
| Very low or no vegetation | -1 to 0.2 |
| Low-density vegetation | 0.2 to 0.4 |
| Moderate-density vegetation | 0.4 to 0.6 |
| Dense vegetation | 0.6 to 1 |
The results of the NDVI calculation were then reclassified to separate non-vegetated areas from vegetation cover so that mangrove areas could be identified more specifically. After the mangrove area was determined, changes were analyzed, and factors affecting these changes were identified for the periods 2020, 2022 and 2025.
2.2.2 Calculation AGB, AGC, and ACS Mangrove
Estimating AGB in mangrove ecosystems can be made using NDVI values by utilizing the raster calculator feature in ArcGIS (Hoa et al., 2023). The estimation of AGB values was done using a quadratic regression model based on NDVI with a coefficient of determination (R2) value of 0.98, as referred to research by (Adni et al., 2024) conducted in Banten. The quadratic regression model with the equation used is:
\[ \text{Above-Ground Biomass} = 574.05 \times \mathrm{NDVI}^{2} - 17.24 \]
According to IPPC (2007) in research (Bachmid et al., 2018), As the carbon contained in organic matter is 47%, the estimation of the amount of carbon stored is by multiplying 47% or 0.47 with biomass as shown in the equation below:
\[ \text{Above-Ground Carbon} = \text{Biomass} \times 0.47 \]
Estimation ACS in mangrove forests referring to (Hoa et al., 2023) calculated with the following equation:
\[ \text{Accumulated Carbon Stock (ACS)} = \text{AGC} \times 3.67 \]
2.2.3 Statistical Test Analysis
Spearman correlation is used to see the monotonic relationship between the results of the model estimation and field data (Safitri et al., 2012). In this study, the Spearman correlation approach was applied to see the level of monotonic relationship between carbon stock values from field measurements and the results of NDVI model estimation. The equation used refers to (Montolalu et al., 2018) as follows:
\[ \rho = 1 - \frac{6 \sum b_i^{2}}{n\left(n^{2} - 1\right)} \]
Description:
- b
- Difference in rank between two variables
- n
- Total samples
The model accuracy test carried out in this study used the RMSE Test. This test was carried out between the field carbon stock value and the carbon stock value based on the NDVI model. The RMSE equation used refers to (Yumnaristya et al., 2023), namely:
\[ \mathrm{RMSE} = \sqrt{\frac{(y - y')^{2}}{n}} \]
Description:
- y
- Field data
- y’
- Vegetation index modelling data
- n
- Total sample
The data on field carbon stock values in this study used reference data from research conducted in situ regarding the calculation of mangrove biomass by (Febriani, 2022) in Tangerang Regency as follows:
| Longitude | Latitude | Reference Carbon Stock Value (Ton/Ha) |
|---|---|---|
| 106,6798 | -6,0211 | 107.151 |
| 106,678 | -6,0208 | 29.374 |
| 106,680 | -6,0168 | 49.932 |
| 106,512 | -6,0430 | 15.291 |
| 106,514 | -6,0392 | 0.978 |
| 106,514 | -6,0341 | 24.801 |
| 106,479 | -6,0507 | 39.759 |
| 106,478 | -6,0464 | 97.776 |
2.2.4 Dynamics of Mangrove area, AGC, and ACS
This stage aims to analyze the dynamics of changes in the area of the mangrove ecosystem and fluctuations in AGC and ACS values in the coastal area of Pakuhaji-Tangerang during the periods of 2020, 2022, and 2025. This analysis was conducted to see the relationship between mangrove ecosystem cover and carbon stored in the area.
3. Results and Discussion
3.1 Normalized Difference Vegetation Index (NDVI)
The NDVI vegetation index provides a general overview of the greenness of an object. By using high-resolution satellite imagery such as PlanetScope, the greenness level of an object can be observed in more detail (Rachman & Hanifa, 2024). Information on changes in mangrove ecosystem, which are the most vulnerable coastal ecosystem, an important role in planning restoration activities. The results of NDVI calculations in 2020, 2022, and 2025 in Figure 3.
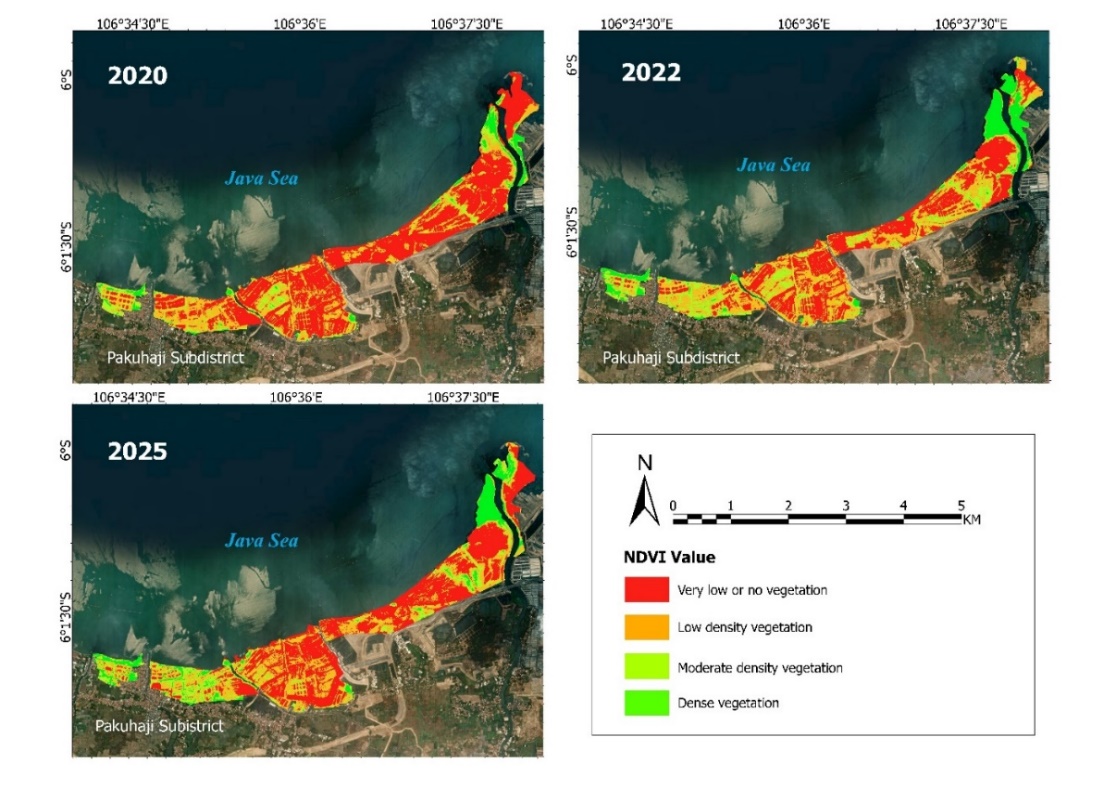
Changes in NDVI values reflect the dynamics of vegetation cover in the Pakuhaji coastal area, which shows significant fluctuations over the last 5 years. According to the Meteorology, Climatology, and Geophysics Agency of Indonesia (Supriyati et al., 2018), the Pakuhaji Sub-district exhibits a monsoonal climate characterized by unimodal rainfall distribution, with a dry season from June to August, a wet season from December to February, and transitional (inter-monsoon) periods during the remaining months. In line with these climatic conditions, conducted research using satellite images from different times and showed that the use of multitemporal data is a common approach in analyzing land cover change.
In this study, the 2020 image was acquired during the peak of the dry season, a period associated with limited rainfall and reduced vegetation vigor. NDVI values were low, particularly in non-mangrove areas, reflecting water stress and suboptimal plant growth—visualized by red-toned imagery. In contrast, the 2022 image, captured during the transition from dry to wet season, showed a marked increase in vegetation density. Dense vegetation, indicated by dark green hues, expanded in the northern region, while moderate vegetation (light green) spread in the northeast—likely supported by improving moisture conditions. The 2025 image, acquired during the wet season, would typically be expected to show peak vegetation growth. However, a noticeable decline in NDVI values was observed, particularly in the central and southern areas, suggesting more permanent ecological degradation rather than seasonal fluctuation alone.
Overall, the northeastern and northern regions of Pakuhaji showed an increasing trend in vegetation from 2020 to 2022, followed by a slight decline in 2025, while the central and southern regions showed a more pronounced decline in vegetation. This analysis confirms that changes in NDVI are not only influenced by seasonal cycles but also by anthropogenic pressures that cause a permanent decline in mangrove cover.
3.2 Pola Spatial Normalized Difference Vegetation Index (NDVI)
The NDVI spatial pattern was carried out to see the distribution, variation, and trends of changes in the mangrove ecosystem in the Pakuhaji-Tangerang area in the 2020, 2022 and 2025 periods. NDVI Mean, NDVI Standard Deviation, and NDVI Trend are presented in Figure 4.
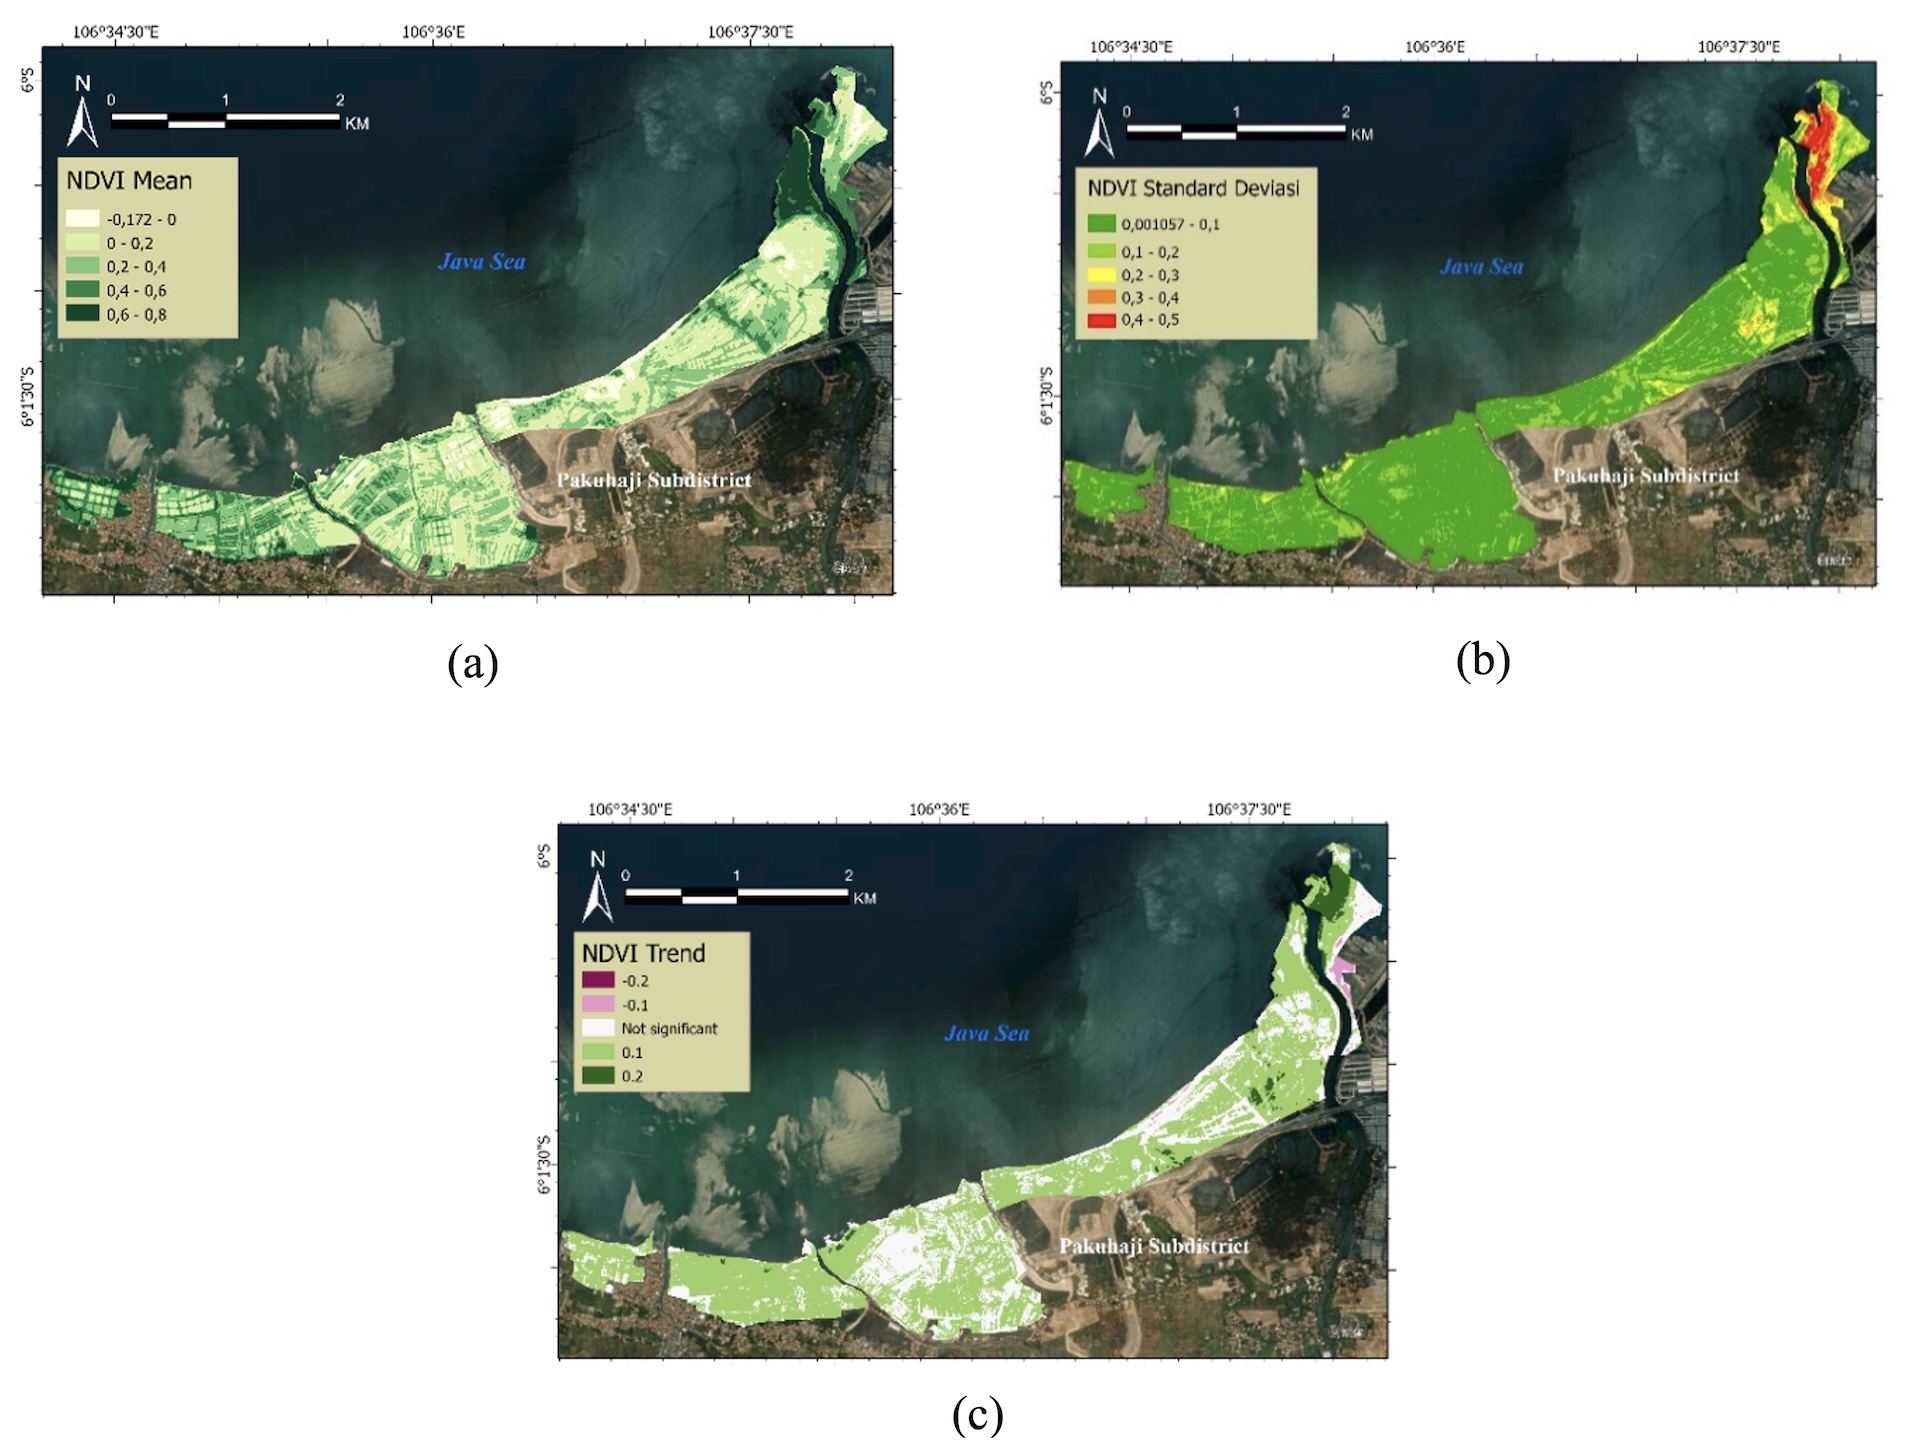
The Mean NDVI map provides an overview of vegetation density. The northeastern and northern parts of the map have high mean values, indicating dense vegetation. NDVI with low mean values indicates less dense vegetation in the medium and low categories. According to with research by (Dijke et al., 2019), high average NDVI values are correlate with stable and productive vegetation conditions. The NDVI standard deviation map indicates the level of vegetation variability over time. Areas with high standard deviation values, such as those in the northern part of the map, indicate significant vegetation fluctuations. High NDVI variability may reflect complex vegetation dynamics (Dijke et al., 2019). NDVI trend maps identify the direction of vegetation change from year to year. Areas with a positive trend indicate an increase in vegetation, and negative trends indicate a decrease or degradation of vegetation (Gao et al., 2022). On the NDVI trend map, a negative trend is marked with purple, indicating a decline or degradation of vegetation. On the other hand, in the northern part, there is also an increase in vegetation, marked with dark green.
3.3 Analysis of Change Factors
Mangrove area is the size or magnitude of the mangrove ecosystem, which has clear boundaries (Kurniawansyah et al., 2022). The mangrove area is obtained through the reclassification process on the NDVI layer to separate areas with very low vegetation cover or no vegetation, namely at NDVI values between -1 and 0.2, which are then calculated using the calculate geometry function. The results of the mangrove area are in Table 5.
| No | Category | Year | ||
|---|---|---|---|---|
| Area (Ha) | ||||
| 2020 | 2022 | 2025 | ||
| 1 | Very low or no vegetation | 314 | 206 | 253 |
| 2 | Low-density vegetation | 155 | 192 | 166 |
| 3 | Moderate-density vegetation | 56 | 90 | 76 |
| 4 | Dense vegetation | 24 | 61 | 54 |
| Total Mangrove Cover Area | 235 | 343 | 296 | |
Based on the data in Table 5, the condition of mangrove density has decreased or increased for all categories each year. From 2020 to 2022, there was a significant increase in all categories of mangrove vegetation. The dense vegetation category increased the most by 37 ha compared to other categories in that year. The increase in the area of the mangrove ecosystem from 2020 to 2022 is in accordance with the restoration program carried out by the local government as well as public awareness education activities (Mahardika et al., 2023). This rehabilitation program is not only a high level of public awareness of the importance of the mangrove ecosystem but is also supported by the Tangerang Regency Spatial Planning Plan for 2011-2031 (Aida et al., 2016). The increase in mangrove area that occurred from 2020 to 2022 is also in line with the planting event carried out by the Indonesian Navy together with the Pakuhaji Sub-district Head, which was carried out in 2022 to commemorate World Mangrove Day (Adi, 2022).
However, during the period 2022–2025, the area of mangrove ecosystems in Pakuhaji District experienced a significant decline to 296 hectares. the mangrove area in Pakuhaji District declined significantly, with coverage decreasing to approximately 296 hectares. This reduction was accompanied by an increase in land categorized as having "very low or no vegetation," which expanded from 206 hectares to 253 hectares during the same period. This trend indicates a growing disruption to the health and sustainability of the mangrove ecosystem. The 13.7% reduction (equivalent to 47 hectares) in mangrove area is consistent with the findings of (Sihombing & Pramono, 2024) who identify anthropogenic pressures—particularly coastal development and land use transformation—as key drivers of mangrove degradation. In Pakuhaji, large-scale coastal land conversion poses a significant threat to mangrove sustainability.
This observation aligns with (Maulana, 2024), who highlights the expansion of premium residential developments along the northern coast of Tangerang—from Kosambi to Kronjo, including Pakuhaji—as a major contributor to mangrove loss. This degradation is further evidenced by a decline in Normalized Difference Vegetation Index (NDVI) values, which reflects not only a reduction in mangrove extent but also a deterioration in vegetative health and density. The contraction of dense and moderately vegetated mangrove classes underscores the dual impact of land use change: diminishing both the quantity and ecological quality of mangrove stands. This, in turn, exacerbates coastal vulnerability to environmental degradation. Furthermore, the observed trends correspond with findings by (Pratama et al., 2025), who report that coastal communities in Pakuhaji face increasing challenges to mangrove regeneration due to climate-related stressors, including shoreline abrasion and extreme weather events. These interacting socio-ecological pressures collectively highlight the urgent need for integrated coastal zone management and community-based mangrove conservation strategies.
To address these complex issues, it is necessary to implement Integrated Coastal Zone Management (ICZM), which emphasizes cross-sector and cross-governmental synergy in the planning, implementation, and supervision of coastal zone utilization (Perdani et al., 2025). Conservation and rehabilitation are key strategies for restoring ecosystem function. This strategy can be realized through the National Mangrove Rehabilitation Program initiated by the Ministry of Environment and Forestry. This program is a concrete example of the government's role in restoring coastal ecosystems in a sustainable manner. In addition, strengthening regulations and enforcing environmental laws needs to be carried out strictly in accordance with the provisions of the law, including Law No. 1 of 2014 concerning Coastal Zone and Small Island Management and Government Regulation No. 22 of 2021 concerning Environmental Protection and Management, in order to ensure the sustainability of the mangrove ecosystem in Pakuhaji District.
Amidst these fluctuations, the mangrove ecosystem on the Pakuhaji coast shows the integration of ecological and social functions in one coastal area. The mangrove ecosystem in this area not only functions as a natural protector from abrasion and sea waves but is also traditionally utilized by the local community in various forms. One of the dominant mangrove species found in this area is Rhizophora mucronata, which is quoted (Iqbal, 2023) that the mangrove species are used as fuel, natural antibacterial, and raw materials for herbal medicine to overcome health problems such as hematuria. In addition, the mangrove ecosystem in this area is also a coastal tourist attraction, as in Figure 5. below:
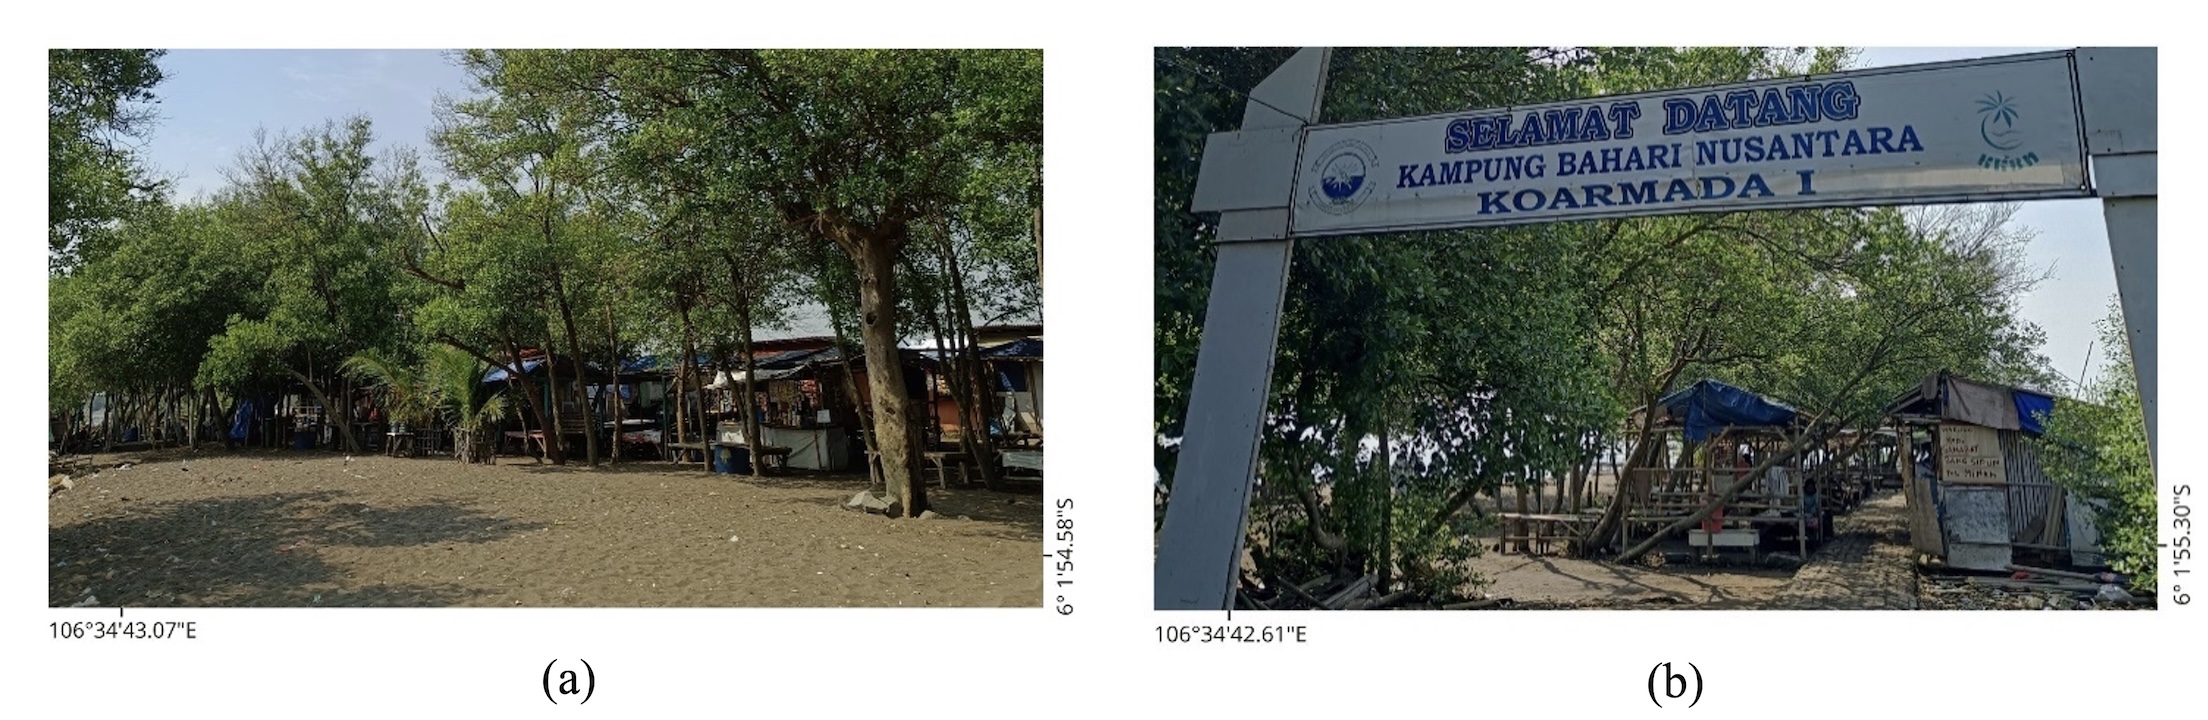
Kramat Sukawali and Suryabahari, Beach commonly known as KSS Beach, is located in Sukawali Village and is geographically located at coordinates 6° 1'54.82"S, 106°34'44.96"E. KSS Beach is a coastal route from three villages, namely Kramat Village, Sukawali Village and Suryabahari Village (Iqbal, 2023). This beach has been around for 7 years and is managed by the Nusantara Marine Village Group (KBBN); KBBN is a program initiated by the Indonesian Navy to empower coastal communities throughout Indonesia. The presence of KBBN in this coastal area makes the location an educational facility by installing identification boards on each individual mangrove to introduce the species found in the area, as in Figure 6.
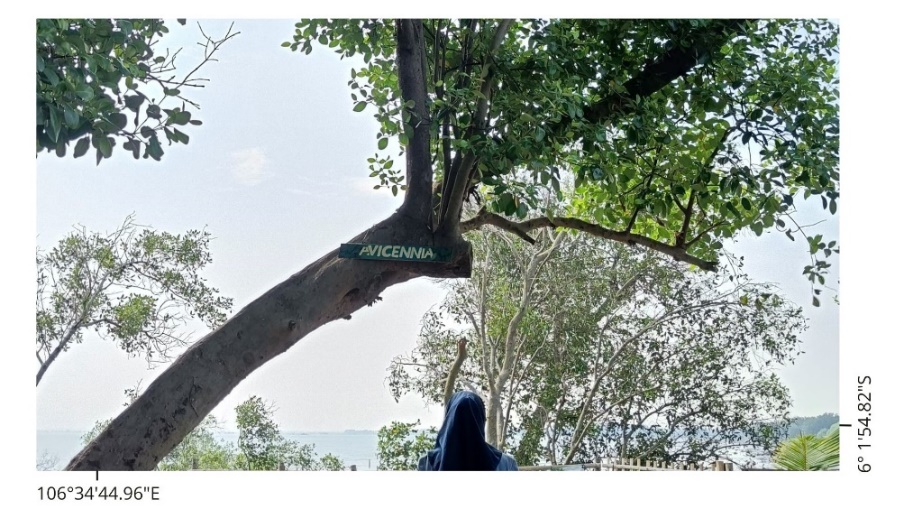
The visual documentation above presents the real conditions of mangrove utilization by local communities, which are in line with the environmental rehabilitation and education program mentioned by the government in the Tangerang Regional Spatial Plan (RTRW) 2011-2031 (Aida et al., 2016).
3.4 Estimation of Above-Ground Biomass
Based on the estimation results using NDVI values in 2020, 2022, and 2025 show that the AGB value fluctuates every year with a pattern that reflects the dynamics of vegetation during that period. As detailed in Table 6.
| Year | 2020 | 2022 | 2025 |
|---|---|---|---|
| Min | 5.7 | 5.7 | 5.7 |
| Max | 389.6 | 428.0 | 372.9 |
| Mean | 75.8 | 105.2 | 95.3 |
| Std. Dev | 76.8 | 107.2 | 88.4 |
| Total Biomass | 19,835,542.4 | 40,185,550.2 | 31,408,617.6 |
The minimum AGB value remains consistent at the same figure every year, which is 5.7 tons/ha. Meanwhile, the maximum AGB value shows variation, with the highest figure being 428 tons/ha in 2022, then 389.6 tons/ha in 2020, and 2025, which has the lowest maximum value of 372.9 tons/ha. The average AGB value increased from 75.8 tons/ha in 2020 to 105.2 tons/ha in 2022 before experiencing a slight decrease to 95.3 tons/ha in 2025. The standard deviation value of AGB shows quite large variations between years, with the highest value of 107.2 tons in 2022, then 88.4 tons in 2025 and 76.8 tons in 2020. The total AGB estimate also shows significant differences. In 2022, the highest total AGB estimate was 40,185,550.2 tons, then 31,408,617.6 tons in 2025, and the lowest value was 19,835,542.4 tons in 2020.
3.5 Spatial Distribution of Above-Ground Carbon and Accumulated Carbon Stock
Based on the estimation results using NDVI values in 2020, 2022, and 2025 show that the AGC value fluctuates every year with a pattern that reflects the dynamics of vegetation during that period. The AGC distribution pattern for each year is shown in Figure 7.
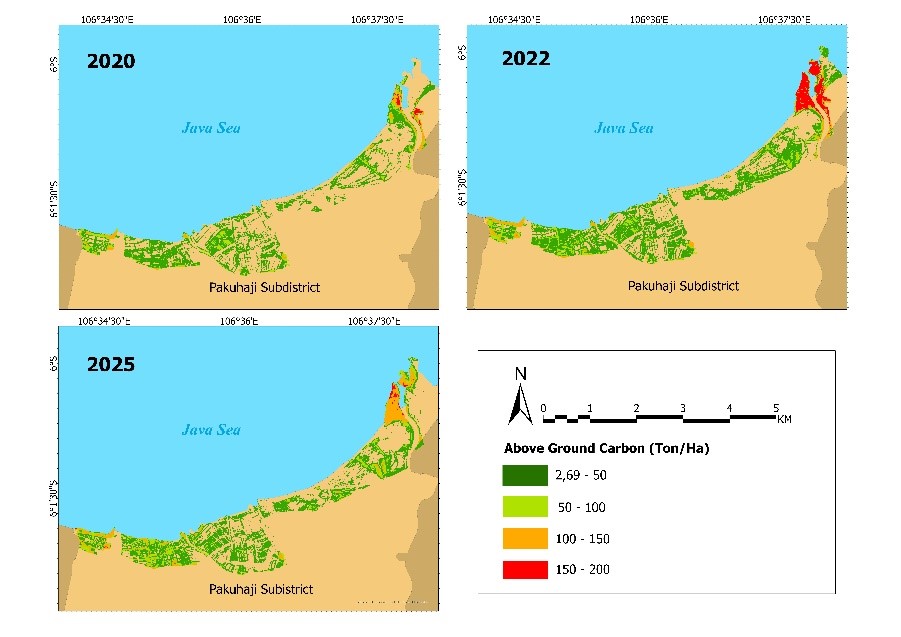
Figure 7 shows the AGC distribution map on the Pakuhaji Tangerang coast for 2020, 2022, and 2025. In 2020, the distribution of AGC was dominated by the low category, namely 2.69–50 tons/h, to the medium category, namely 50–100 tons/ha, which was evenly distributed along the north coast. In 2022, there was a significant increase in AGC in the northeast, marked by the emergence of red areas with a high category, namely 150–200 tons/ha and orange, namely 100–150 tons/ha, which indicated areas with higher carbon stocks. This trend is predicted to continue in 2025, where areas with high AGC dominate the northeast, while parts of the western and central coastal areas still show low to medium AGC. To clarify these dynamics, the estimated values of AGC and total ACS for the period are shown in Table 7.
| Year | 2020 | 2022 | 2025 |
|---|---|---|---|
| Min | 2.7 | 2.7 | 2.7 |
| Max | 183.1 | 201.2 | 175.3 |
| Mean | 35.6 | 49.4 | 44.8 |
| Std. Dev | 36.1 | 50.4 | 41.5 |
| Total Carbon | 9,322,704.9 | 18,887,208.6 | 14,762,050.2 |
| ACS | 34,214,327.8 | 69,316,056.9 | 54,176,725.5 |
Based on Table 7, the AGC estimates show inter-annual variations during the period 2020, 2022, and 2025. The minimum value remains at the same figure of 2.7 tons/ha throughout the years, while the highest maximum value was recorded in 2022 at 201.2 tons/ha and the lowest in 2025 at 175.3 tons/ha. The average AGC increased from 35.6 tons/ha in 2020 to 49.4 tons/ha in 2022, then decreased to 44.8 tons/ha in 2025. The standard deviation values also show a similar pattern, reflecting the most widespread distribution of values occurring in 2022. The highest total AGC estimate was recorded in 2022 at 18,887,208.6 tons, while the lowest value was in 2020 at 9,322,704.9 tons. The ACS estimate also shows an increasing trend from 2020 to 2022, then a slight decrease in 2025. This indicates an increase in aboveground carbon stocks during this period, although there was a slight decrease in 2025.
3.6 Statistical Analysis
To assess the relationship between AGC reference data and NDVI values from PlanetScope, statistical analysis was performed using Spearman correlation and RMSE. This analysis aims to evaluate the strength and degree of correlation between field-based biomass estimates and vegetation indices from remote sensing. The graphical visualization is shown in Figure 8.
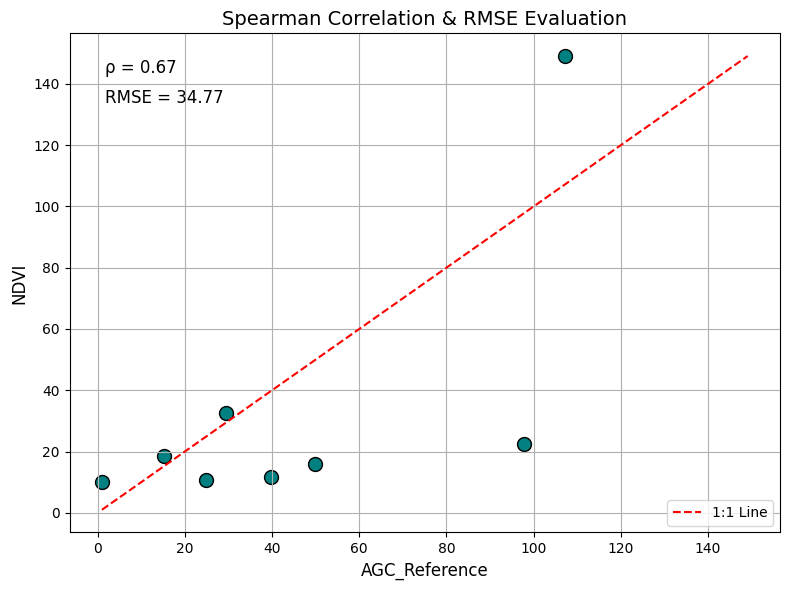
Based on the visualization results in Figure 8, the Spearman correlation coefficient (ρ) value of 0.67 indicates a strong positive relationship between the Reference AGC ranking and the NDVI value. In general, an increase in the AGC ranking tends to be followed by an increase in the NDVI ranking. This indicates a consistent relationship pattern between the two variables, although not perfectly linear. As much as 0.33 of this value is caused by factors not discussed in this study, including environmental variables such as salinity, topography, mangrove species, and the potential for inaccuracy of remote sensing data due to limited field data (Azzahra et al., 2025). The coefficient value is included in the moderate correlation category (Schober & Schwarte, 2018), which can be interpreted as the NDVI value having the potential to be a relevant vegetation indicator in estimating variations in Mangrove AGC.
The quadratic regression model developed in this study produced an RMSE of 34.77. This value indicates that the difference between the model prediction and the field reference AGC is still within reasonable limits, given the high natural variation in mangrove carbon stocks in coastal ecosystems. In addition, the RMSE value obtained is lower than that found in the study by (Ramadhan & Suwadji, 2024), which showed an RMSE value of 51.55 in NDVI-based mangrove biomass estimation in Rembang Regency. This reinforces that the NDVI model used in this study has optimal performance in predicting mangrove carbon stocks.
The greater spread of residuals at extreme carbon values seen in Figure 8 is a common phenomenon in optical image-based modelling, as NDVI is more sensitive to moderate to dense vegetation variation, while extreme conditions such as areas with very sparse or very dense vegetation are difficult to capture accurately (Hossain & Li, 2021). Thus, NDVI remains relevant as an efficient and practical approach for initial monitoring of mangrove carbon stocks.
3.7 Dynamics chart between Area, AGC, and ACS
A dynamic trend analysis was conducted based on three years of observation to understand the temporal relationship between changes in the mangrove area, AGC, and ACS. The graph shows how the fluctuations between the area of the mangrove ecosystem and the accumulated carbon value. The graph is presented in Figure 9.
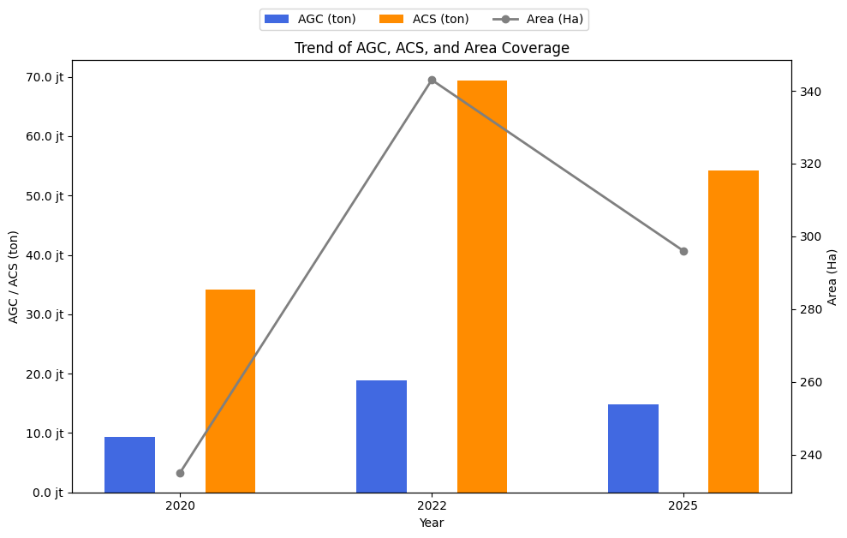
Based on the graph above shows the dynamics of changes in the area of mangrove cover, Above Ground Carbon (AGC), and Accumulated Carbon Stock (ACS) in the coastal area of Pakuhaji, Tangerang Regency, during the period 2020 to 2025. The three parameters show fluctuations that are closely related. In 2020, the area of mangroves was recorded at 235 hectares, which then increased significantly to 343 hectares in 2022. An increase followed this increase in the area of the AGC and ACS values, where the ACS value peaked at around 69 million tons. This is due to the restoration program carried out by the local government, and public awareness education activities are also in line with the planting event carried out by the Indonesian Navy together with the Pakuhaji Sub-district Head, which was carried out in 2022 to commemorate World Mangrove Day (Mahardika et al., 2023) (Adi, 2022). This also shows that the expansion of mangrove areas directly impacts increasing the capacity for carbon absorption and storage. However, in 2025, the mangrove area decreased to 296 hectares. This decrease caused a decrease in the AGC and ACS values, each decreasing to around 14.7 million tons and 54 million tons. This decrease was caused by pressure due to land conversion, reclamation activities and also lack of supervision of the mangrove ecosystem that had been restored in the previous year, as well as climate change faced by the Pakuhaji District community, which caused abrasion to mangrove degradation (Sihombing & Pramono, 2024) (Pratama et al., 2025). This condition shows that reducing mangrove vegetation cover can reduce the potential for climate change mitigation by decreasing carbon stocks stored above ground level. Fluctuations in AGC and ACS throughout the observation period confirm that changes in mangrove areas contribute significantly to coastal carbon storage dynamics. While this limited timeframe constrains the ability to assess long-term trends, the findings nonetheless offer a critical baseline for understanding mangrove ecosystem dynamics in the Pakuhaji Sub-district—an area that has received limited scholarly attention. The results provide an initial but meaningful overview of carbon stock fluctuations and serve as an entry point for broader ecological and socio-environmental investigations. Consistent with the work of (Kurniawansyah et al., 2023), this study affirms the potential of high-temporal-resolution PlanetScope imagery to enhance the scope of both annual and decadal monitoring. Such capabilities are particularly relevant in dynamic coastal regions undergoing rapid land-use changes. These findings lay the groundwork for more systematic, data-driven approaches to mangrove monitoring and underscore the importance of integrating remote sensing technologies into sustainable coastal management strategies.
4. Conclusion
This study concludes that the area of mangrove ecosystems on the Pakuhaji coast experiences significant dynamics every year. In 2020, the area of mangroves was recorded at 235 hectares, then increased to 343 hectares in 2022 and decreased slightly in 2025 to 296 hectares. The increase in the area of mangrove ecosystems from 2020 to 2022 is in line with the restoration program carried out by the local government, educational activities, and increasing public awareness of the importance of mangrove ecosystems. Meanwhile, the decrease in the area of mangroves in 2025 was caused by pressure due to land conversion and abrasion. The existence of mangrove ecosystems in Pakuhaji District is also used as an eco-tourism area and a source of traditional medicine. Estimation of mangrove carbon stocks is carried out using a quadratic model approach based on NDVI values, which are gradually converted into AGB, AGC, and ACS. The model is based on linear regression reference data between field data and NDVI values supported by the Spearman correlation and RMSE statistical tests. The results of the Spearman correlation test showed a reasonably strong relationship between NDVI values and carbon stocks with a coefficient of 0.67, while the RMSE value of 34.77 indicated an adequate level of model accuracy. This study indicates that NDVI values based on PlanetScope imagery can be used as a representative indicator to detect and monitor mangrove carbon stocks spatially. Further study development is recommended by conducting field validation to strengthen the research results. This study can also be used to formulate policies that support conservation efforts for mangrove ecosystems on the Pakuhaji-Tangerang coast.
Acknowledgements
We would like to express our sincere gratitude to the MBKM Program, the National Research and Innovation Agency (BRIN), and the Marine Information Systems Study Program, Indonesia University of Education. Their support and collaboration have been invaluable in the successful completion of this study. The authors also to thank Planet Labs PBC for providing the high-resolution PlanetScope imagery under a student license (August Daulat) through the Planet Education and Research Program.
References
- Adi. 2022. 8 Ribu Pohon Ditanam di Pantai KSS Sukawali Pakuhaji Pada Peringatan Hari Mangrove Sedunia. Accsess on June 22, 2025, https://lintas24news.com/8-ribu-pohon-ditanam-di-pantai-kss-sukawali-pakuhaji-pada-peringatan-hari-mangrove-sedunia/.
- Adni, S. F., Asy’Ari, R., Raihan, F., Putra, E. I. 2024. Carbon stock estimation based on remote sensing in the northern coast of Java. IOP Conference Series: Earth and Environmental Science, 1315(1). https://doi.org/10.1088/1755-1315/1315/1/012042.
- Aida, G. R., Wardiatno, Y., Fahrudin, A, Kamal, M.M. 2016. Dynamic model of economic value of mangrove ecosystems Tangerang Coastal Area, Banten. Bonorowo Wetlands, 6(1): 26–42. https://doi.org/10.13057/bonorowo/w060103.
- Alders, W., Davis, D. S., Haines, J. J. 2024. Archaeology in the Fourth Dimension: Studying Landscapes with Multitemporal PlanetScope Satellite Data. Journal of Archaeological Method and Theory. https://doi.org/10.1007/s10816-024-09644-x.
- Alfiansyah, M., Nuarsa, I. W., Brasika, I. B. M. 2023. Perbandingan Beberapa Metode Klasifikasi Menggunakan Citra Landsat dan Sentinel Untuk Pemetaan Sebaran Mangrove Di Kawasan Ekowisata Mangrove PIK Jakarta Utara. Journal of Marine and Aquatic Sciences, 9(1): 82. https://doi.org/10.24843/jmas.2023.v09.i01.p09.
- Azzahra, R. Y., Yulius, Agus, S., Aditama, F., Arifin, T., Putra, A., Rahmania, R., Heriati, A., Prihantono, J., Purbani, D., Salim, H., Ramdhan, M., Wahyono, A., Sadad, Ningsih, A., Asyiri, A. 2025. Advancing Mangrove Carbon Stock Monitoring With Drone and Pleiades Imagery on Gilibakau Island-Saleh Bay, Indonesia. Journal of Marine and Island Cultures, 14(1). https://doi.org/10.21463/jmic.2025.14.1.06.
- Bachmid, F., A Sondak, C. F., Kusen, J. D., Studi Ilmu Kelautan, P., Perikanan dan Ilmu Kelautan, F., & Sam Ratulangi Manado, U. 2018. Estimasi Penyerapan Karbon Hutan Mangrove Bahowo Kelurahan Tongkaina Kecamatan Bunaken. Jurnal Pesisir dan Laut Tropis, 1 (1): 8-13. https://ejournal.unsrat.ac.id/index.php/jplt/article/view/19463.
- Buenavista, D., Purnobasuki, H. 2023. People and Mangroves: Biocultural Utilization of Mangrove Forest Ecosystem in Southeast Asia. Journal of Marine and Island Cultures, 12(2): 95–115. https://doi.org/10.21463/jmic.2023.12.2.07.
- Dijke, A., Mallick, K., Teuling, A., Schlerf, M., Machwitz, M., Hassler, S., Blume, T., Herold, M. 2019. Does the Normalized Difference Vegetation Index explain spatial and temporal variability in sap velocity in temperate forest ecosystems? Hydrology and Earth System Sciences, 23(4), 2077–2091. https://doi.org/10.5194/hess-23-2077-2019.
- Febriani, Y. A. A. M. 2022. Kalkulasi Biomassa Karbon pada Ekosistem Mangrove di Pesisir Kabupaten Tangerang. (Skripsi, Institut Pertanian Bogor). Accsess on June 22, 2025, https://repository.ipb.ac.id/handle/123456789/115423.
- Ganefiani, A., Suryanti, S., Latifah, N. 2019. Potensi Padang Lamun Sebagai Penyerap Karbon Di Perairan Pulau Karimunjawa, Taman Nasional Karimunjawa (Ability of Seagrass Beds as Carbon Sink in The Waters of Karimunjawa Island, Karimunjawa National Park). Saintek Perikanan: 14(2): 115–122. https://doi.org/10.14710/ijfst.14.2.115-122.
- Gao, W., Zheng, C., Liu, X., Lu, Y., Chen, Y., Wei, Y., Ma, Y. 2022. NDVI-based vegetation dynamics and their responses to climate change and human activities from 1982 to 2020: A case study in the Mu Us Sandy Land, China. Ecological Indicators, 137. https://doi.org/10.1016/j.ecolind.2022.108745.
- Hanifa, S. N., Rachman, H. A., Hidayah, Z. 2024. Temporal Analysis of Mangrove Canopy Cover of High Resolution Satellite Imagery on the West Coast of Bangkalan Regency, Madura East Java. Jurnal Kelautan Tropis, 27(3): 579–594. https://doi.org/10.14710/jkt.v27i3.24273.
- Hardianto, A., Dewi, P. U., Feriansyah, T., Sari, N. F. S., Rifiana, N. S. 2021. Pemanfaatan Citra Landsat 8 Dalam Mengidentifikasi Nilai Indeks Kerapatan Vegetasi (NDVI) Tahun 2013 dan 2019 (Area Studi: Kota Bandar Lampung). Jurnal Geosains Dan Remote Sensing, 2(1): 8–15. https://doi.org/10.23960/jgrs.2021.v2i1.38.
- Hoa, N. H., Son, H. T., Linh, N. T., Vicent, D. O. de, Linh, N. N. 2023. Using Planetscope Data To Estimate Carbon Sequestration Of Mangrove Forests: A Case Study In Tien Yen District, Quang Ninh Province. Journal of Forestry Science and Technology, 15: 7–99. https://doi.org/10.55250/jo.vnuf.2023.15.087-099.
- Hossain, M. L., Li, J. 2021. NDVI-based vegetation dynamics and its resistance and resilience to different intensities of climatic events. Global Ecology and Conservation, 30, e01768. https://doi.org/10.1016/j.gecco.2021.e01768.
- Islam, M. A., Jimmy, A. N., Alam, M. S., Khan, N. A. 2021. The use of multi-temporal Landsat normalized difference vegetation index (NDVI) data for assessing forest cover change of Lawarchara National Park. Environment, Development and Sustainability, 23(12): 17702–17722. https://doi.org/10.1007/s10668-021-01408-x.
- Jayanthi, S., Arico, Z. 2017. Pengaruh Kerapatan Vegetasi Terhadap Produktivitas Serasah Hutan Taman Nasional Gunung Leuser. Elkawnie: Journal of Islamic Science and Technology, 3(2): 151-160, https://www.academia.edu/download/104080657/2013.pdf.
- Khairunnisa, K., Setyobudiandi, I., Boer, M. 2018. Estimasi Cadangan Karbon Pada Lamun Di Pesisir Timur Kabupaten Bintan. Jurnal Ilmu Dan Teknologi Kelautan Tropis, 10(3): 639–650. https://doi.org/10.29244/jitkt.v10i3.21397.
- Klompmaker, J. O., Hoek, G., Bloemsma, L. D., Gehring, U., Strak, M., Wijga, A. H., van den Brink, C., Brunekreef, B., Lebret, E., Janssen, N. A. H. 2018. Green space definition affects associations of green space with overweight and physical activity. Environmental Research, 160: 531–540. https://doi.org/10.1016/j.envres.2017.10.027.
- Kurniawansyah, A., Manessa, M. D., Hartati, A. P. 2022. Luasan dan Kerapatan ekosistem mangrove di Kecamatan Cilamaya Wetan, Kabupaten Karawang. Majalah Geografi Indonesia, 37(1), 30. https://doi.org/10.22146/mgi.75345.
- Mahardika, S. M. A, Yulianda, F., Adrianto, L. 2023. Interactive Governance for Mangrove Social-Ecological System in Tangerang Regency: A DPSIR Approach. International Journal on Advanced Science, Engineering and Information Technology, 13(4): 1249-1257. https://doi.org/10.18517/ijaseit.13.4.17966.
- Marlianingrum, P. R., Adrianto, L., Kusumastanto, T., Fahrudin, A. 2021. Sistem Sosial-Ekologi Mangrove Di Kabupaten Tangerang. Jurnal Ekobis: Bisnis & Manajemen, 11(2): 351-364. http://ejournal.stiemj.ac.id/index.php/ekobis.
- Maulana. 2024. Kala Hutan Mangrove Pesisir Tangerang Terbabat jadi Pemukiman Mewah. Accsess on September 30, 2025, https://mongabay.co.id/2024/04/24/kala-hutan-mangrove-pesisir-tangerang-terbabat-jadi-pemukiman-mewah/.
- Montolalu, J. P., Rindengan, Y.D., Karouw, S. 2018. Analisa Pemeringkatan Portal Website Universitas Sam Ratulangi Manado Menggunakan Linear Weightage Model. Jurnal Teknik Informatika 13(4). https://ejournal.unsrat.ac.id/index.php/informatika/article/view/28085.
- Iqbal. 2023. Desa Sukawali Kabupaten Tangerang, Kampung Bahari Nusantara dan Kondisi Mangrove. Accsess on June 22, 2025, https://lindungihutan.com/blog/mangrove-desa-sukawali-tangerang/.
- Muzakki, S. A., Mourniaty, A. Z. A., Rahardjo, P., Triyono, H. 2021. Pemetaan dan evaluasi kesehatan hutan mangrove di Kabupaten Karawang menggunakan landsat multitemporal. Jurnal Kelautan dan Perikanan Terapan (JKPT), 4(2): 137-143. https://ejournal-balitbang.kkp.go.id/index.php/jkpt/article/view/10527.
- Panuju, D. R., Paull, D. J., Griffin, A. L. 2020. Change detection techniques based on multispectral images for investigating land cover dynamics. Remote Sensing, 12(11): 1781. doi:10.3390/rs12111781.
- Perdani, A. S., Umar, G., Dewata, I., Amar, S. 2025. Pembangunan Berkelanjutan di Pesisir Indonesia: Tantangan dan Solusi atas Ancaman Lingkungan. Journal of Current Research in Humanities, Social Sciences, and Business, 2(1): 11-22. https://ejournal.hakhara-institute.com/HSSB/article/view/73.
- Pratama, J. P., Rohmansyah, R., Puntodewo, L., Rahman, F. A. 2025. Ketahanan Masyarakat Pesisir terhadap Dampak Perubahan Iklim. Journal of Management and Social Sciences, 4(1): 20–36. https://doi.org/10.55606/jimas.v4i1.1709.
- Purnamasari, E., Kamal, M., Wicaksono, P. 2021. Comparison of vegetation indices for estimating above-ground mangrove carbon stocks using PlanetScope image. Regional Studies in Marine Science, 44. https://doi.org/10.1016/j.rsma.2021.101730.
- Putri, E. A. W., Lestariningsih, S. P., Riyono, J. N., & Prihantarto, W. J. 2023. Pemetaan Kerapatan Mangrove Berbasis NDVI (Normalized Difference Vegetation Index) Menggunakan Citra PlanetScope Pada Sebagian Wilayah Konsesi PT. Kandelia Alam. Jurnal Laot Ilmu Kelautan, 5(2): 142-151. http://jurnal.utu.ac.id/JLIK/article/view/8180.
- Rachman, H. A., & Hanifa, S. N. 2024. Spatio-temporal NDVI changes of mangrove forest in West Bangkalan using high resolution imagery. E3S Web of Conferences, 499. https://doi.org/10.1051/e3sconf/202449901032.
- Ramadhan, A., Suwadji, S. 2023. Model penduga biomassa hutan mangrove menggunakan citra satelit sentinel-2A di Kabupaten Rembang Jawa Tengah. Jurnal Wana Tropika, 13(2): 72-84. DOI: 10.55180/jwt.v13i2.1018.
- Safitri, N. H., Hidayat, T., Yunita, R., Pujawati, E. D. 2012. Partisipasi Masyarakat Pesisir Terhadap Kelestarian Hutan Mangrove (Studi Kasus Di Desa Kuala Tambangan Kecamaran Takisung Kabupaten Tanah Laut). EnviroScienteae, 8(3): 154-163. https://ppjp.ulm.ac.id/journal/index.php/es/article/view/2081.
- Schober, P., Schwarte, L. A. 2018. Correlation coefficients: Appropriate use and interpretation. Anesthesia and Analgesia, 126(5): 1763-1768. DOI: 10.1213/ANE.0000000000002864.
- Sihombing, S. O., Juliana, J., Pramono, R. 2024. Pemberdayaan Masyarakat Desa Sukawali Melalui Edukasi Dan Penanaman Pohon Mangrove. Prosiding Konferensi Nasional Pengabdian Kepada Masyarakat dan Corporate Social Responsibility (PKM-CSR) 7. https://mail.prosiding-pkmcsr.org/index.php/pkmcsr/article/view/2401.
- Supriyati, S., Tjahjono, B., Effendy, S. 2018. Analisis Pola Hujan untuk Mitigasi Aliran Lahar Hujan Gunungapi Sinabung. Jurnal Ilmu Tanah Dan Lingkungan, 20(2): 95–100. https://doi.org/10.29244/jitl.20.2.95-100.
- Yumnaristya, S. H., Indra, T. L., Pin, T. G., Gracia, E. 2023. Spatial and temporal study of estimating carbon stocks distribution of mangrove forest in coastal area of Teluknaga, Tangerang. Environmental and Materials, 1(2). https://doi.org/10.61511/eam.v1i2.2023.270.
- Zhu, Y., Liu, K., Liu, L., Myint, S. W., Wang, S., Cao, J., Wu, Z. 2020. Estimating and Mapping Mangrove Biomass Dynamic Change Using WorldView-2 Images and Digital Surface Models. IEEE Journal of Selected Topics in Applied Earth Observations and Remote Sensing, 13, 2123–2134. https://doi.org/10.1109/JSTARS.2020.2989500.
- Zhu, Y., Liu, K., Liu, L., Wang, S., Liu, H. 2015. Retrieval of mangrove aboveground biomass at the individual species level with worldview-2 images. Remote Sensing, 7(9): 12192–12214. https://doi.org/10.3390/rs70912192.