Spatial Dynamics of Mangrove Community Ecosystem in Muaragembong, Indonesia: Integrating Drone Data, NDVI, and Support Vector Machine (SVM)
Abstract
The mangrove forest in Muaragembong has experienced fluctuations in area over time, prompting this study to analyze the dynamics of mangrove community changes from 2019 to 2023. The study focuses on two main areas in Muaragembong: Muara Nawan and Muara Kuntul. The approach integrates remote sensing, including Planetscope satellite imagery and aerial photographs from DJI Phantom 3 Pro taken directly in 2019. The methodology combines remote sensing technology, Normalized Difference Vegetation Index (NDVI) analysis, Support Vector Machine (SVM) algorithm, and drone validation. The classification results obtained two dominant mangrove genera: Avicennia sp. and Rhizophora sp.. Spectrally, Avicennia sp. reflects a greater amount of near-infrared than Rhizophora sp. with a difference range of 10–15%. Validation and accuracy assessment showed a high level of accuracy with an Overall Accuracy value of 89% and a Kappa Coefficient value of 0.83. There was an increase in Muara Nawan of 7.1 hectares, while Muara Kuntul experienced a reduction of 2 hectares. The changes in mangrove communities occur due to rehabilitation, land-use conversion, and local utilization of mangrove resources. Overall, this study shows the effectiveness of integrating the SVM algorithm, drone data, and NDVI analysis to monitor mangrove community dynamics over 5 years.
Keywords
Aerial photogrammetry, Rehabilitation, Mangrove changes, NDVI analysis, Support Vector Machine
1. Introduction
According to Law No. 27 of 2007, coastal areas are transitional zones between land and marine ecosystems rich in natural resources. For optimal utilization, sustainable management is required, such as developing ecotourism. One of the important ecosystems in coastal areas that play a vital role in maintaining the environment is the Mangrove Ecosystem (Yulius & Arifin, 2024). Mangrove forests are dicotyledonous plant species that live in tidal areas (intertidal zone) in warm, tropical, and subtropical regions. Mangroves derive nutrients from sediments carried by rivers and the sea. This ecosystem has essential roles, such as coastal protection and providing habitat for associated fauna to breed, feed, and reside. Mangroves help mitigate coastal flooding by absorbing large waves from the sea through damping when entering their dense root systems. Preventing waste from entering the sea is also one of the key functions of mangroves, their robust root helping maintain seawater quality by environmental standards (Ngo et al., 2023).
Muaragembong sub-district is a natural reserve area on the northern coast of West Java. Mangrove forests and aquaculture ponds dominate this area. The distribution of the mangrove ecosystem in Muaragembong is mainly dominated by the genera Rhizophora sp. and Avicennia sp. (Rachmawati et al., 2014). The Avicennia sp. genus can grow up to 30 meters high and typically forms dense clusters. They are also equipped with specialized roots known as pneumatophores, which enable plants to obtain oxygen even when growing in waterlogged soils (Cerri et al., 2024). Avicennia sp. is generally used in industry and traditional medicine by communities living near mangrove ecosystems. The wood can be processed for construction materials, while the leaves, fruit, roots, bark, and seeds are traditionally used to treat various ailments (Beniwal et al., 2024). The Rhizophora sp. has 20–30 meters tall. A distinctive characteristic of Rhizophora sp. is the root system that sticks out from the tree trunk and extends along the ground surface. The leaves are thick, with black speckles on their undersides (Malaysia, 2021). Differences in mangrove growth location influenced by various environmental parameters. For example, salinity differences of the genus Avicennia sp. are classified as crypto viviparous mangroves that can grow in high salinity levels (Ye et al., 2005).
In Muaragembong, mangrove ecosystems have undergone considerable degradation. Between 1976 and 2018, the area of mangrove forests decreased by 55% due to land conversion, especially for pond expansion which increased by arbout 35%. This transformation has not only reduced the ecological quality of mangroves, but also have an impact on changes in the coastline. Furthermore, surveys conducted in 2025 by various institutions indicate that sand mining activities, sea level rise, soil degradation, hydrodynamic factors, and pond expansion have collectively accelarated landscape alteration, and the deterioration of mangroves ecosystem in the area (Lukman et al., 2025). To assess this situation, remote sensing combined with machine learning offers an effective approach to monitor mangrove changes and analyze ecosystem degradation.
Several studies have been conducted to examine mangrove degradation in Maragembong. For instance, Rahmawati et al. (2024) monitoring mangrove ecosystem using Sentinel-2 data and Support Vector Machine (SVM) algorithm. Previous research has often focused on medium resolution imagery, such as Landsat or Sentinel-2. Research employing high-resolution satellite imagery in Muaragembong is still limited. Data validation using drone imagery is also important to improve classification accuracy. In addittion to assessing the overall extent of mangrove cover, this study examines the dynamics of mangrove species-level changes in Muaragembong to identify appropriate spatial distribution along the coastline, which is crucial for preventing ecosystem degradation caused by abrasion.
In addition to the ecological perspective, it is also essential to know the socio-cultural-economic aspects, such as various regions with unique ways of utilizing mangroves. In the study of Wulandari et al. (2024), implementing social actions through community education and training, as well as rehabilitation efforts by collectively planting mangroves. From Herawati et al. (2022), explain that local communities in Muaragembong are economically dependent on the utilization of mangrove parts which support household livelihoods. Socio-cultural and economic aspects are very important because mangrove degradation not only reduces ecological functions but also threatens the sustainability of coastal household economies, weakens inherited cultural practices, and eliminates the social space in which communities maintain their identity and cohesion. However, previous studies have largely been limited to describing socio-cultural and economic aspects without linking them directly to physical and ecological changes of mangrove ecosystems.
Therefore, based on this background, the objectives of this study are to analyze the dynamics of mangrove community changes in Muaragembong during the 2019–2023 period by integrating Planetscope satellite imagery, drone data, NDVI analysis, and the SVM algorithm. This approach not only inreases the realibity of classification but also situates ecological findings within socio-cultural and economic context.
2. Material and Methods
Study Area
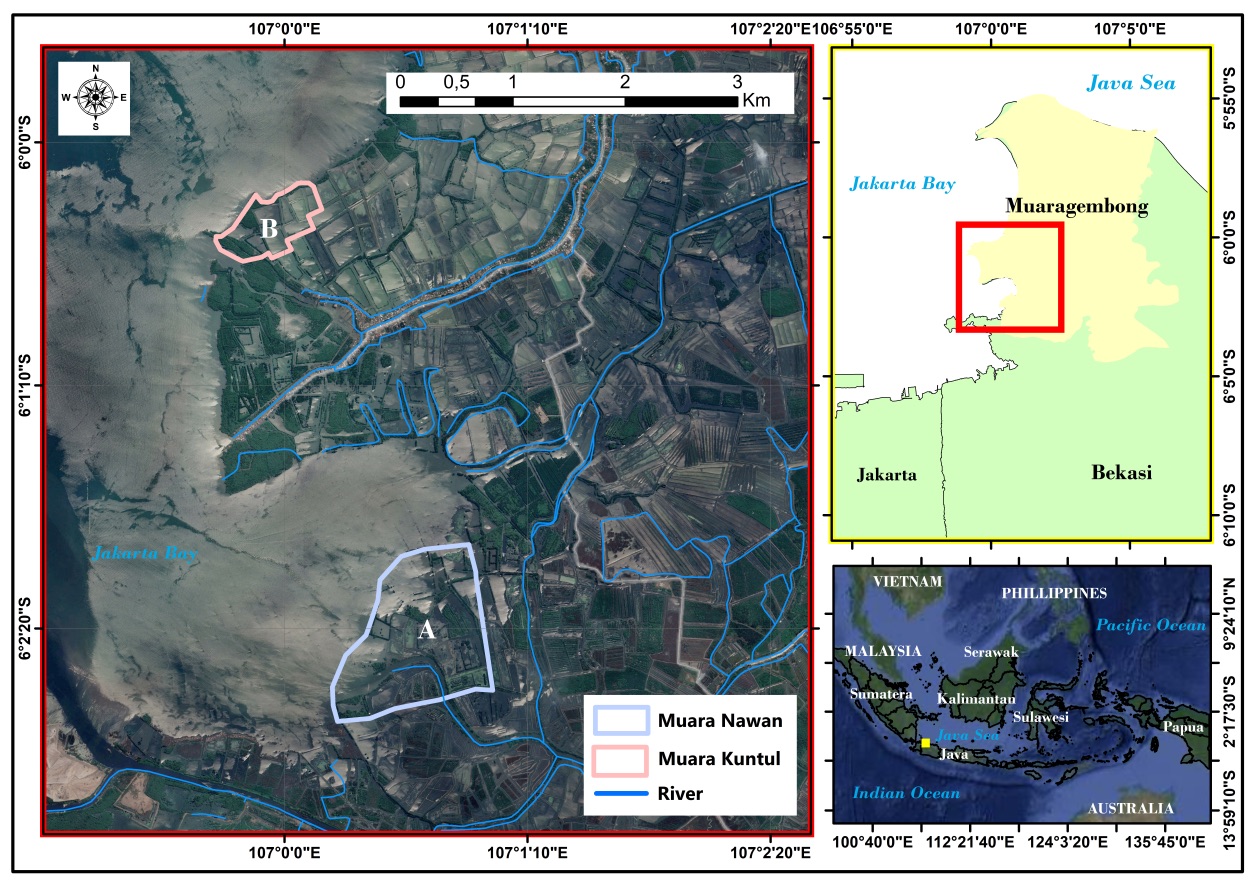
Muaragembong sub-district is geographically located between 106°58’ and 107°7’ East and 5°55’ and 6°5’ South. Jakarta Bay borders it to the west, the Java Sea to the north, Karawang Regency to the east, and Babelan Regency to the south (Figure 1). The study was conducted in two locations there is Muara Nawan (coordinates: 6°02’21.29” S, 107°00’36.87” E) and Muara Kuntul (coordinates: 6°00’23.00” S, 106°59’55.43” E). Both estuaries are part of the downstream runoff and flow distribution from the Citarum River.
3. Methods
3.1 Tools and Materials
| Tools | Function |
|---|---|
| Drone DJI Phantom 3 Pro | Collecting aerial images |
| ArcGIS | Vegetation index processing, machine learning processing, and map layouting |
| Agisoft Metashape | Drone image processing |
| Pix4D Capture | Drone flight path planning |
| Google Earth Image | Basemap visualization and spatial validation |
| PlanetScope satellite (3 m) from September 2019, July 2021, and April 2023 | Image data for mangrove data processing |
3.2. Work Data Procedure
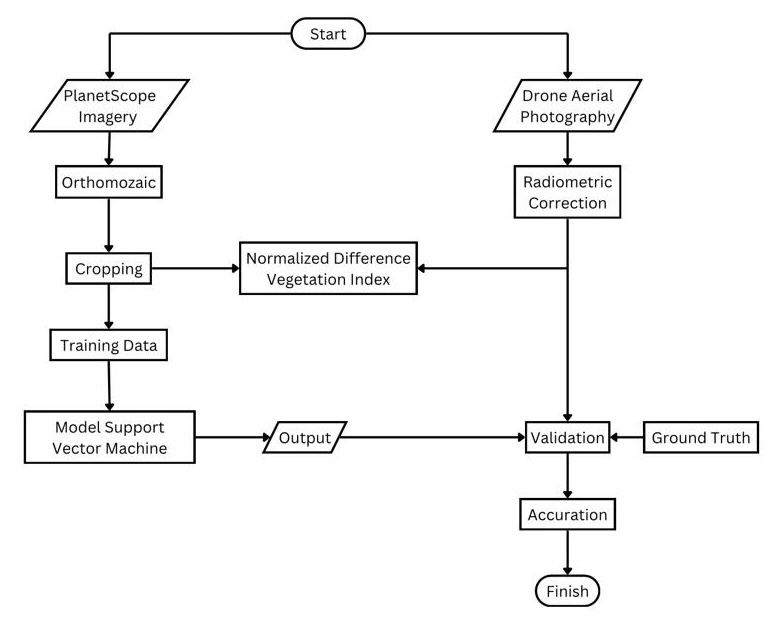
Analyzing mangrove community dynamic changes in this study was conducted by combining satellite imagery with aerial photogrammetry. Planetscope satellite images were processed to obtain a complete mosaic, followed by cropping to match the study area. Next, NDVI calculation to identify vegetation greenness levels, which play a role in distinguishing mangrove based on their spectral responses. Training data were generated from the composite band imagery to serve as input for the mangrove species classification process using the SVM method. The SVM model produced a classified mangrove communities map, which was validated to test the accuracy of the classification model. The final stage of this process is evaluating accuracy and compiling results to illustrate the dynamics of changes in the mangrove community in Muara Nawan and Muara Kuntul.
3.3 Data Collection
The data used in this study consists of satellite imagery and in situ data. The in situ data was obtained from aerial drone imagery captured in 2019 using DJI Phantom 3 Pro and processed using Agisoft Metashape software. The imagery data utilized includes Planetscope images from 2019, 2021, and 2023 processed using ArcGIS software. Additionally, Google Earth Pro was employed to obtain basemap reference and validation data on 2023, which were used to support spatial analysis of mangrove cover.
3.4 Mapping using Remote Sensing
The management and monitoring of land use in mangrove areas are crucial. They should be conducted through direct field observations and using remote sensing technology to observe, monitor, and collect data without direct contact with the observed object. This technology generally includes satellites or drones equipped with sensors that utilize satellite imagery and electromagnetic radiation to capture various data or information, such as changes in vegetation, air quality, and the impact of climate change (Ramdhan et al., 2024). Remote sensing is a core component of Geographic Information Systems (GIS), computer-based systems that collect, analyze, store, and present location-based data. One of the primary data sources in GIS is imagery obtained from remote sensing. This data is usually used to produce digital maps, perform spatial analysis, and support more efficient environmental monitoring. Advances in remote sensing have improved the accuracy and efficiency of data management processes (Soifer et al., 2023) by using software such as QGIS or ArcGIS in mangrove conservation monitoring, with various methods such as feature extraction, land cover classification, and long-term change detection.
Among various remote sensing technologies Planetscope imagery provides high-resolution data that is particularly relevant for monitoring mangrove ecosystems. PlanetScope is a high-resolution satellite imagery system with a satellite shape resembling a 3U CubeSat measuring 10 x 10 x 30 cm, consisting of 130 satellites. These satellites can capture daily images of terrestrial and marine environments in RGB, Near-Infrared (NIR), or combined spectral bands, as their imaging capacity reaches 340 million km daily. PlanetScope imagery is available in several product levels. One is level 1B (Basic Scene), which is a raw image without further processing. Level 3B (Ortho Scene), which has undergone geometric correction for improved mapping accuracy, and level 3A (Ortho Tile), which is processed imagery divided into several tiles for analysis (Gabr et al., 2020).
| Band Name | Spectral Range (nm) | Resolution (m) |
|---|---|---|
| Coastal Blue | 431–452 | 3 m |
| Blue | 465–515 | 3 m |
| Green | 513–549 | 3 m |
| Green | 547–583 | 3 m |
| Yellow | 600–620 | 3 m |
| Red | 650–680 | 3 m |
| Red-Edge | 697–713 | 3 m |
| NIR | 845–885 | 3 m |
For vegetation analysis, four bands are commonly used: Red, Green, Blue, and NIR. The imagery used is a level 3B product that has undergone geometric correction to ensure their geographical positions are accurate. Radiometric correction is performed to eliminate sensor effects and lighting variations using Surface Reflectance (SR) (Purnamasari et al., 2024). After that, NDVI analysis was conducted to determine changes in mangrove areas and to observe the spectral characteristics of different mangrove communities. Image cropping was done to adjust the image size to match the study location size. Then, multispectral fusion is applied to extract image information by selecting three bands to create a composite colour image, with each band assigned to the Red, Green, and Blue (RGB) channels (Suwargana, 2018). After band composition, NDVI measures vegetation's growth and health. NDVI evaluates the reflectance differences between near-infrared and visible light, providing vital information on vegetation changes (Hanan et al., 2020).
Tidal flats and salt marshes exist at varying elevations. In the salt marsh zone, the distribution of NDVI values shows two peaks of low and high values, indicating that vegetation generally grows in abundance or not at all. The absence of intermediate NDVI values, indicating moderate vegetation cover, signifies that the transition between bare land and vegetation occurs abruptly rather than gradually (Lee & Kim, 2018). Healthy plants absorb red light and reflect more near-infrared wavelengths, while stressed or dead plants reflect significantly less near-infrared wavelengths. The differences between the two types of mangroves can be seen based on the light reflectance from the NDVI results, which reflects the greenness of the vegetation in each satellite image (Rahmawati, 2014). Planetscope imagery and orthophotos were processed with NDVI using ArcGIS software, with the NDVI formula as follows (Zhang et al., 2017):
\[ \text{NDVI} = \frac{\text{NIR} - \text{Red}}{\text{NIR} + \text{Red}} \]
Where NDVI is the vegetation index value, NIR refers to the near-infrared band, and Red represents the red wavelength band. After calculating the NDVI value is complete, a reclassification was conducted to produce four mangrove forest density categories: High, Moderate, Low, and Negative (Table 3).
| Condition | Category | NDVI Value |
|---|---|---|
| Dense and healthy vegetation | High | \(0.5 ≤ x ≤ 1\) |
| Sparse vegetation or lower-density vegetation | Moderate | \(0.3 ≤ x ≤ 0.5\) |
| Barren land, urban areas, or minimal vegetation | Low | \(0 ≤ x ≤ 0.3\) |
| Non-vegetative surfaces (water bodies, snow, clouds, bare soil) | Negative | \(1 ≤ x ≤ 0\) |
3.5 Drone Data Processing
Preparations such as flight path planning, including determining take-off point, flight point (waypoint), and landing point (home waypoint), are carried out before conducting aerial image acquisition using a DJI Phantom 3 Pro. To automate the flight path during aerial image capture, the Pix4D Capture application was used. It calculates the number and duration of flights based on the drone type. The RGB camera on the DJI Phantom 3 Pro has an effective resolution of approximately 12.1 megapixels, with a field of view of 94°, and can record up to 4K30 (4096 x 2160) in H.264 format. It can also take photos with a resolution of 12 megapixels in JPEG and DNG RAW formats (Yusof et al., 2022).
This drone technology efficiently collects environmental data through aerial imagery, supporting sustainable spatial analysis and zoning (Sutrisno et al., 2024). Therefore, to validate the identification of mangrove species, drone flights were conducted at altitudes below 10 meters with camera tilt angles between 20–45°. The aerial photos taken by the drone produced a pixel resolution of 0.4 cm, indicating a high level of detail in the captured objects. The image overlap ranged from 60% to 80%, where a higher degree of overlap suggests closer flight paths and more images taken. Aerial photographs were taken during two time intervals: 08:00–10:00 AM and 2:30–5:30 PM. The timing of this selection is based on favourable weather conditions—clear skies and low wind speeds (Salim et al., 2020), as well as optimal sun angles to minimize water surface reflections, ensuring clear visibility of mangrove vegetation.
The next stage involves data processing by selecting the aerial photos that have been collected. Photos that do not meet quality criteria, such as blurry images, not perpendicular (less than 90° angle), tilted, or showing parts of the drone's legs, need to be separated. The high-quality images will proceed further using Agisoft Photoscan. This process includes several important steps: photo alignment, dense cloud generation, texturing, ortho-mosaic creation, Digital Surface Model (DSM) construction, and ortho-map export. The final result is a map in TIFF format, which will be used to validate Planetscope image data and further analysis using ArcGIS.
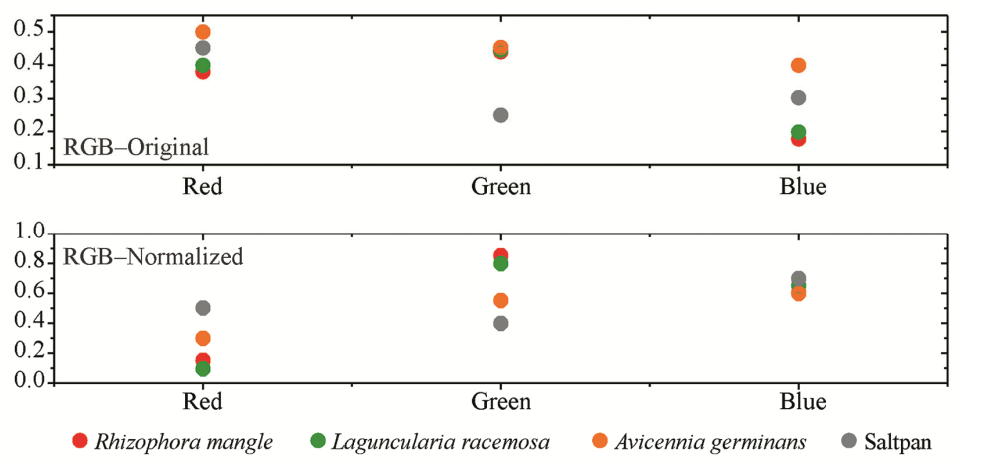
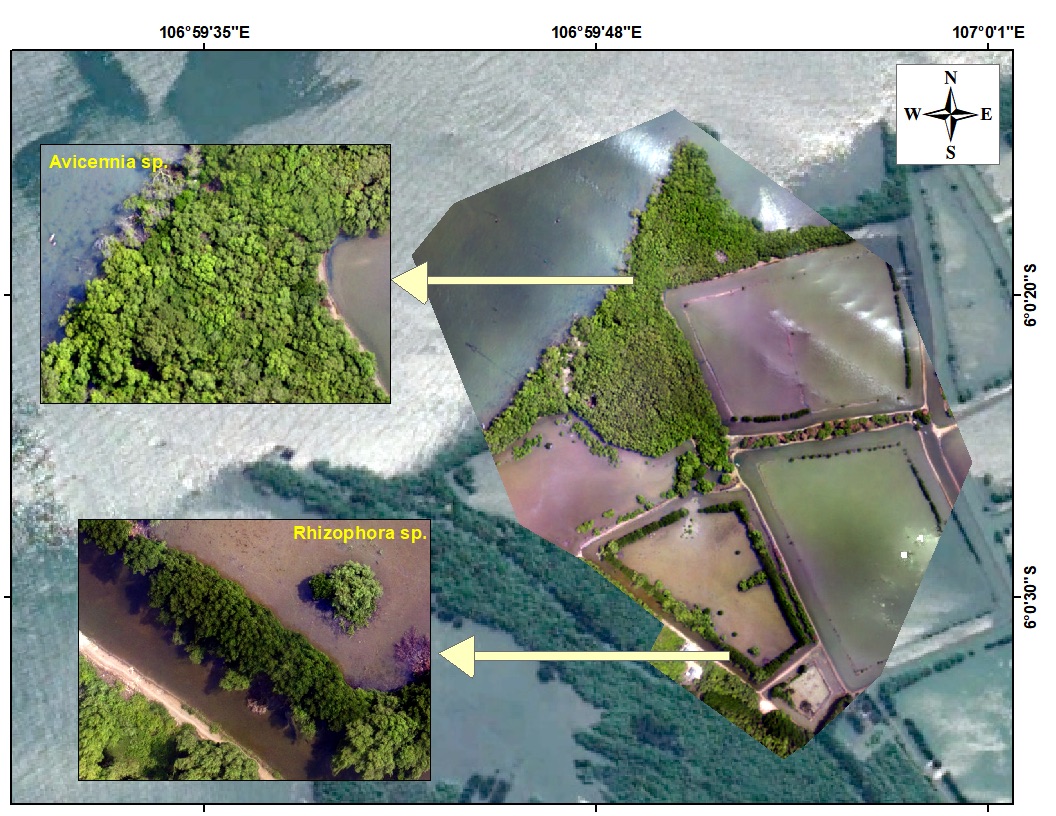
Drone data offers higher spatial resolution than commercial satellite imagery, which has great potential for identifying existing mangrove types. The spectral responses of mangroves can be comprehensively measured across a specific range of the electromagnetic radiation spectrum using sensors such as RGB cameras. There are differences in their spectral responses when identifying between different types of mangroves (Lisein et al., 2015). In the original RGB imagery, the yellow circle representing Avicennia sp. is positioned higher than the red circle representing Rhizophora sp. (Fig 3).
3.6 Support Vector Machine
The study applies machine learning, a supervised non-parametric technique that does not require normal data distribution, with algorithms that can process multidimensional data, producing accurate classification results (Adugna et al., 2022). One of the most common algorithms used in this application is the Support Vector Machine (SVM). SVM is a binary classification model and one of the algorithms that can classify mangrove forests with an accuracy of 88.6% (Cao et al., 2018). The algorithm finds an optimal hyperplane in the feature space by minimizing the distance between data within classes (intraclass) and maximizing the distance between classes (interclass). This approach represents a solution to a convex quadratic programming problem with linear constraints (Wu et al., 2005). SVM algorithm effectively maps mangrove land cover and also resilient to cloud cover interference in satellite imagery data (Maulana et al., 2024; Audina et al., 2019).
In the data processing of the SVM algorithm, several parameters must be considered, such as the kernel to transform the data into a linearly separable form, the cost parameter which controls the occurrence of errors during the fixation stage, and gamma to handle non-linear classification. One of the advantages of SVM is its ability to handle non-linear data and high dimensions that cause dimensionality disasters. Despite the challenges, the algorithm performs well even with complex feature sets and small-sized datasets. The most commonly used form of SVM in several studies with high accuracy is the Radial Basis Function (RBF) (Cao et al., 2018). The RBF kernel function is expressed by the following equation (Razaque et al., 2021):
\[ \mathrm{SVM}_{\mathrm{RBF}} = \forall_{\omega}(a, a_i) = \exp\!\left(-\frac{1}{\sigma^{2}} \lVert a, a_i \rVert^{2}\right) \times \lambda \]
3.7 Validation and Accuracy Assessment
After digitizing the training data sample and testing the data, there are two accuracy assessments were performed: Kappa Coefficient and Overall Accuracy (OA) using a confusion matrix by calculating user and producer accuracy first, using the following formulas:
\[ \text{User Accuracy} = \frac{n{ii}}{n{+i}} \]
\[ \text{Producer Accuracy} = \frac{n{ii}}{n{i+}} \]
\[ \text{OA} = \frac{\sum n{ii}}{N} \]
\[ \text{Kappa Coefficient} = \text{OA} - \left(\frac{1}{N} \sum (n{i+} . n{+i})\right) \]
Where \(n{ii}\) is the correct classification's diagonal value, and N is the total of all samples. \(n{+i}\) refers to the total number of reference samples for each class, and \(n{i+}\) is the total number of classification results for each class (Congalton, 1991). The accuracy assessment results can be interpreted based on the Kappa Coefficient classification (Table 4).
| Kappa Statistics | Strength of Agreement |
|---|---|
| < 0 | Poor |
| 0.00–0.20 | Slight |
| 0.21–0.40 | Fair |
| 0.41–0.60 | Moderate |
| 0.61–0.80 | Substantial |
4. Results
4.1 Accuracy Validation
The accuracy validation of mangrove community classification in Muara Nawan and Muara Kuntul was assessed using the Kappa index (equation 6). Data validation was carried out manually with random sampling for each data per year. The highest accuracy was recorded in Muara Kuntul in 2021, with a Kappa value of 0.83 and Overall accuracy of 89%. On the other hand, the lowest accuracy test values for both Kappa and Overall accuracy were found in Muara Kuntul 2019 data at 0.66 and 78% (Table 5). The lower accuracy in 2019 was validated using a drone that covered a smaller area than the processed satellite imagery, and there was a mismatch between the points, causing spatial misalignment.
| Research Location | Year | User Accuracy | Producer Accuracy | Overall Accuracy | Kappa Coefficient |
|---|---|---|---|---|---|
| Muara Nawan | 2019 | 88.6% | 88.5% | 88.5% | 0.82 |
| 2021 | 84.5% | 87.8% | 84.4% | 0.76 | |
| 2023 | 80.6% | 84% | 81% | 0.71 | |
| Muara Kuntul | 2019 | 79.6% | 79% | 78% | 0.66 |
| 2021 | 89.3% | 89.6% | 89% | 0.83 | |
| 2023 | 84.6% | 86.9% | 84.3% | 0.76 |
Overall, the accuracy assessment results are included in the 'substantial' category, with the highest level reaching the 'almost perfect' category (Table 4). The SVM algorithm can classify objects even with a limited dataset. This indicates that the SVM algorithm provides sufficiently high accuracy to classify differences in mangrove types and changes in zoning over 5 years.
4.2 Dynamics of Change in Mangrove Communities
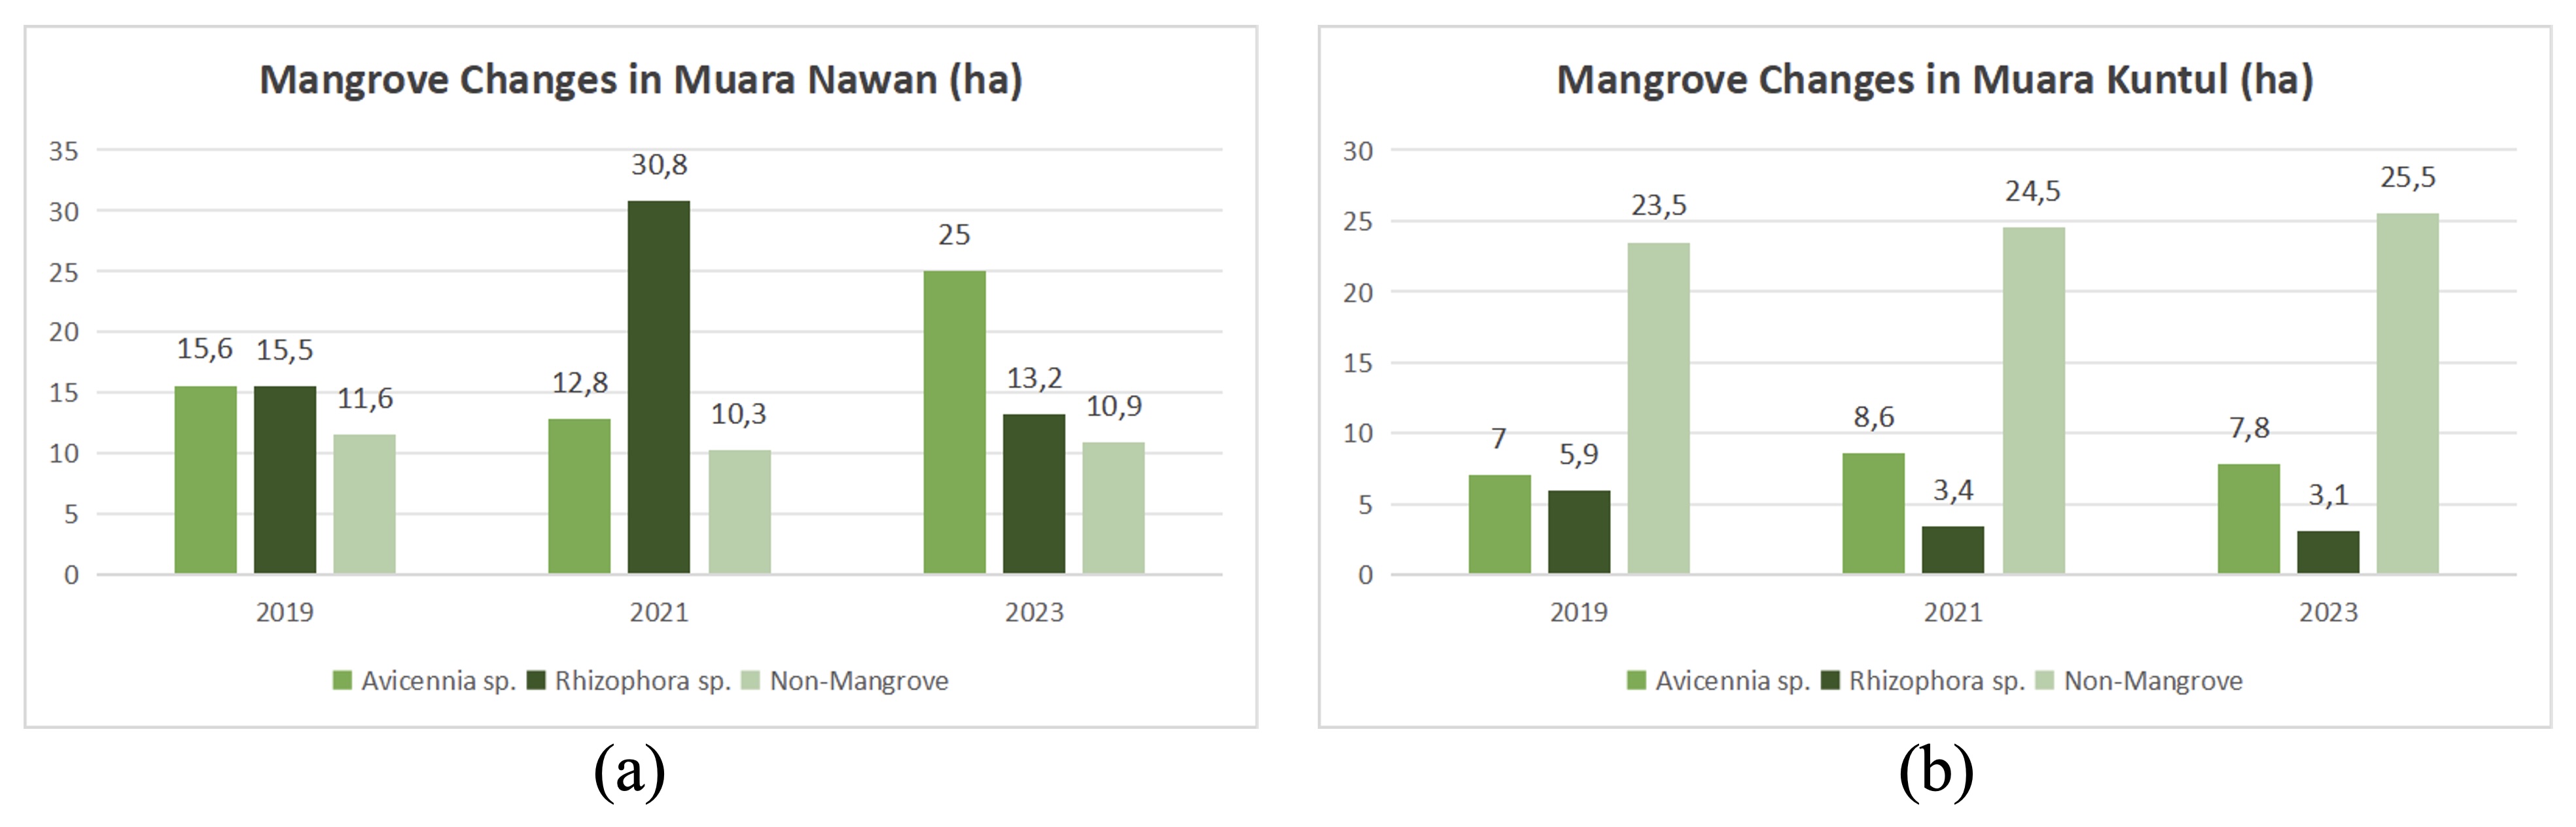
The coastal area of Muaragembong has a predominantly sandy mud substrate, with daily tides only occurring once per day. These two factors influence the zonation dynamics of the mangrove ecosystem (Suryadi et al., 2021). The classification results showed that two types of mangroves, Avicennia sp. and Rhizophora sp., were detected in Muara Nawan and Muara Kuntul, which grow on muddy substrates. The classification utilized three land cover classes: non-mangrove (land, aquaculture ponds, and settlements), Avicennia sp., and Rhizophora sp.. To differentiate between the two genera, Avicennia sp. is marked with light green, while Rhizophora sp. is marked with dark green. The classification was carried out using the SVM algorithm (Fig 4).
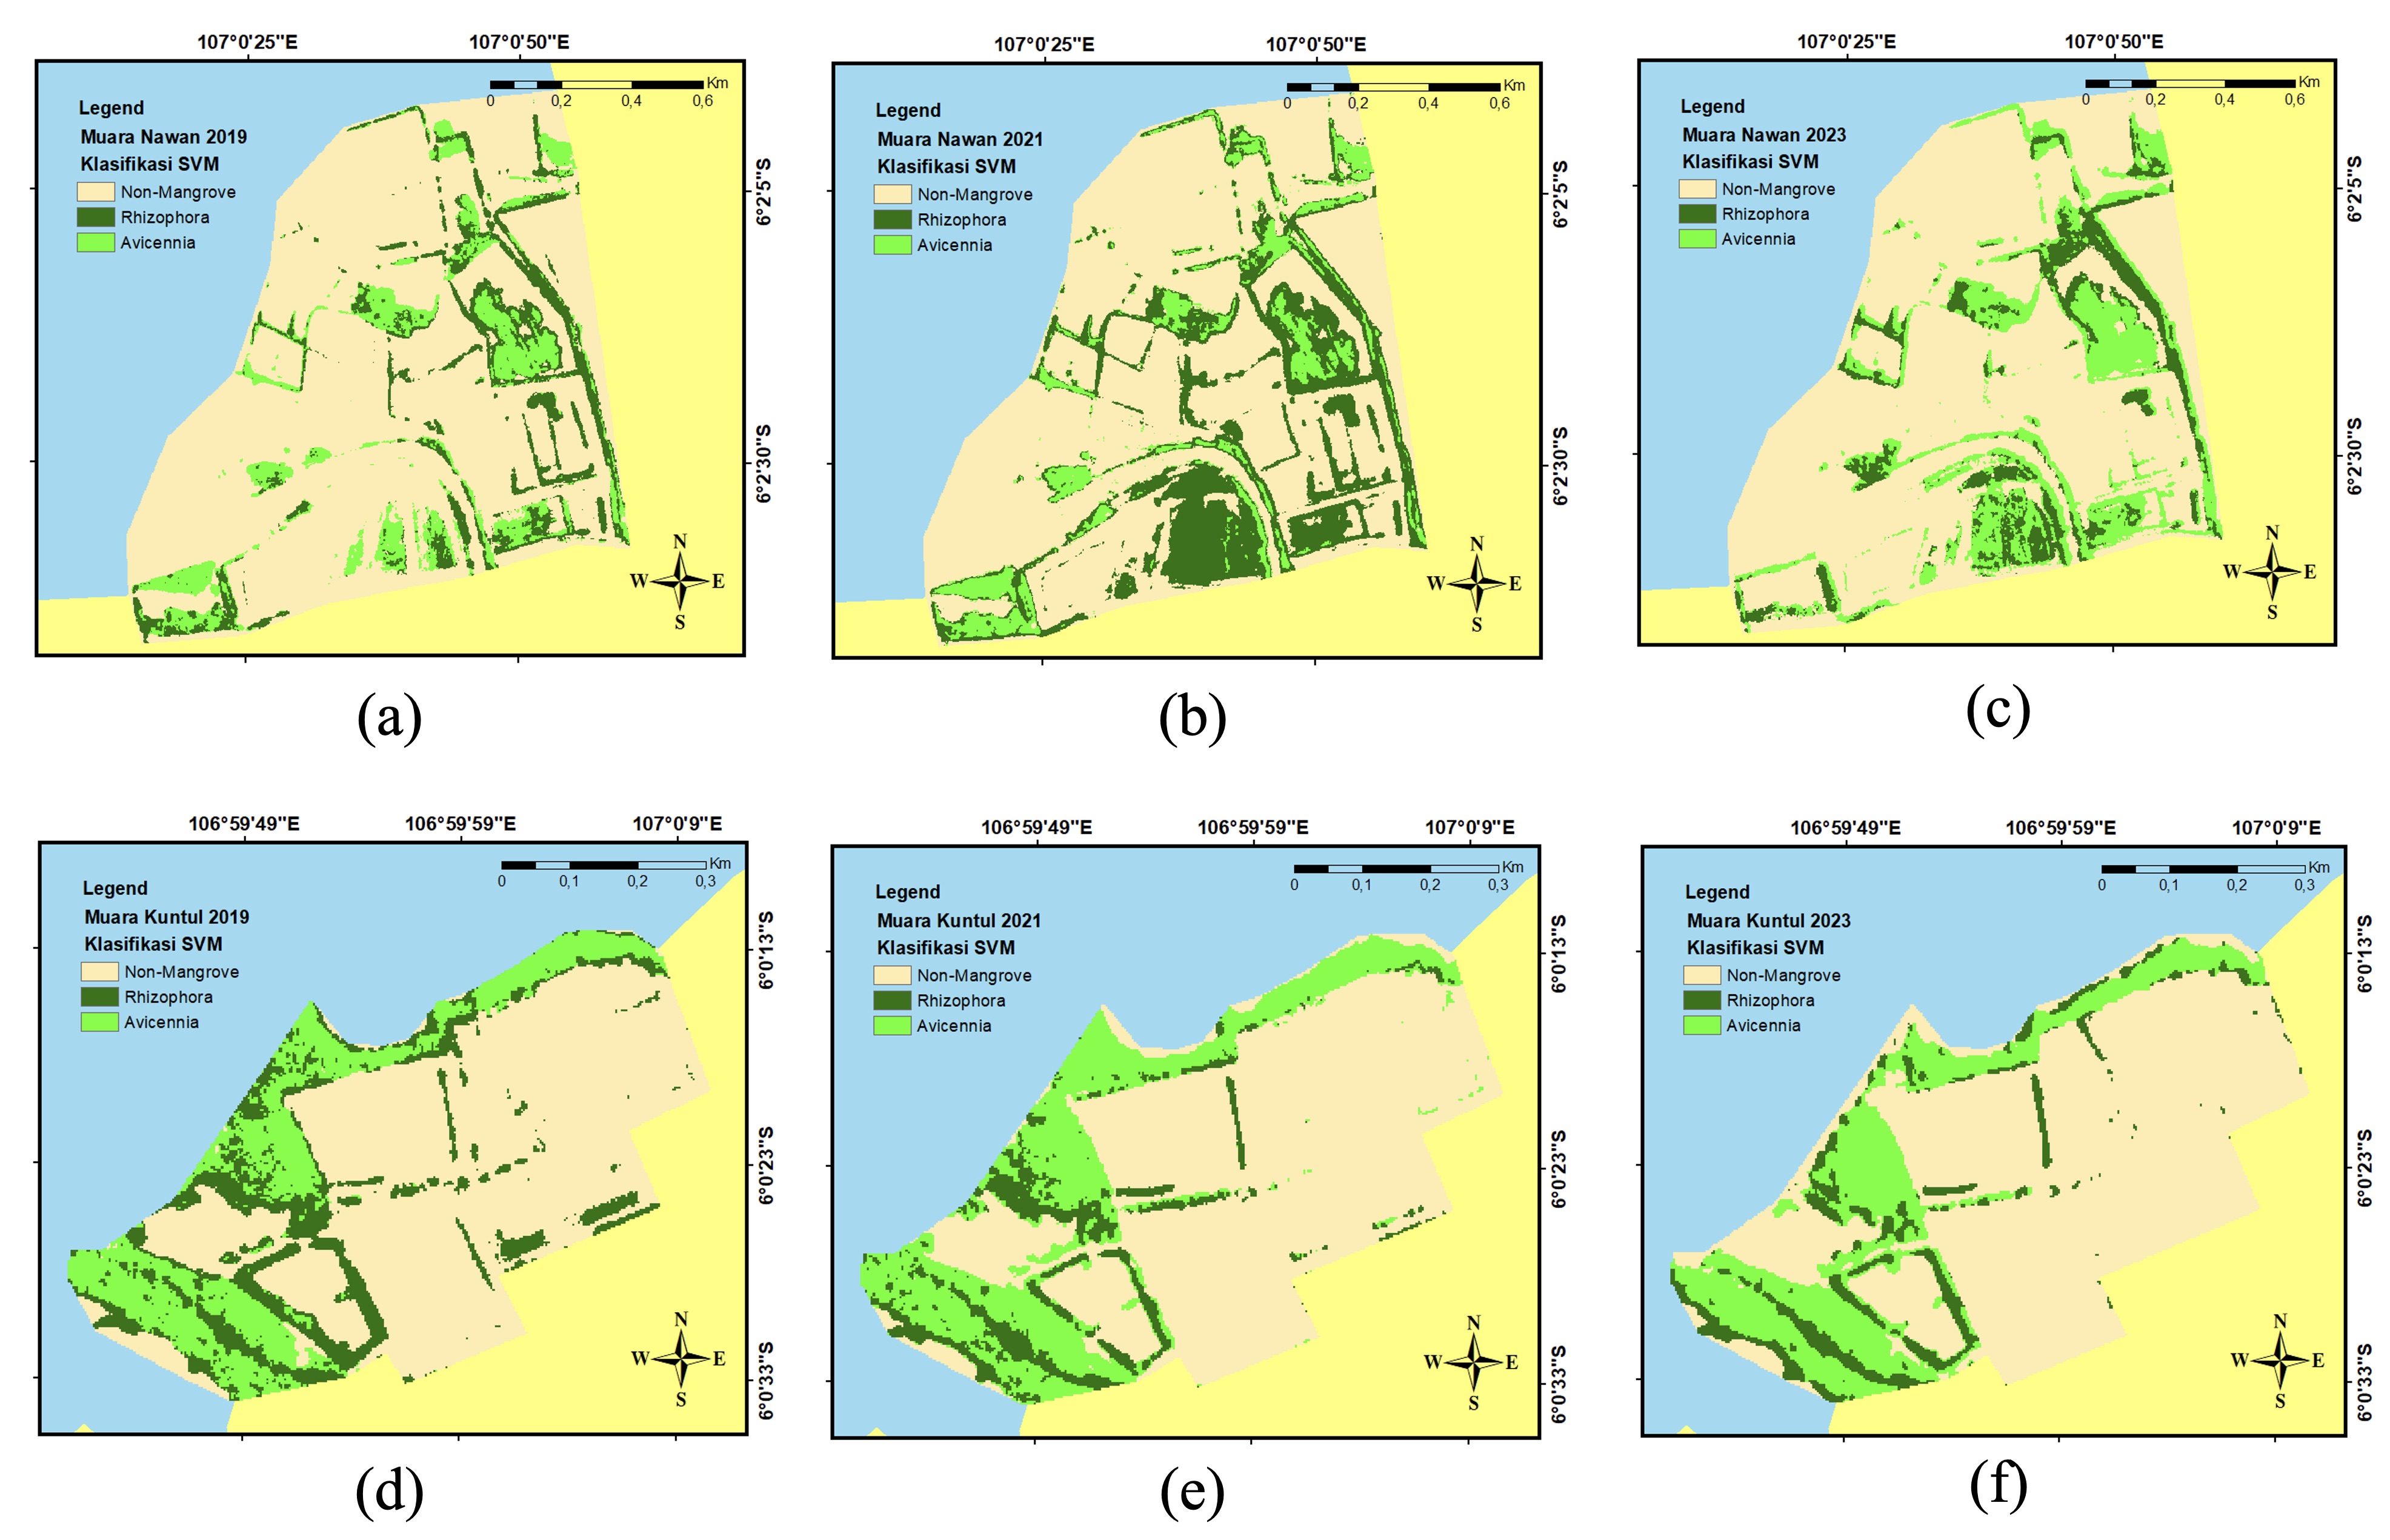
In 2021, there was a significant increase in the population of Rhizophora sp. mangroves, particularly in Muara Nawan (Fig 5A). There was massive planting in 2019, which is why there is an increase in the mangrove population in 2021; mangrove growth takes quite a long time. A similar trend was observed with the increase in Avicennia sp. populations in 2023, resulting from planting activities in 2022. In contrast, Muara Kuntul experienced a significant decrease in mangrove coverage, resulting in an expansion in non-mangrove areas. This is related to the occupation of the local community, which is predominantly fisherman and aquaculture. This land reduction is due to converting mangrove areas into ponds, with the required area reaching 200–2,000 (Wulandari et al., 2024). In Muaragembong, Rhizophora sp. species are widely utilized for natural dyes for batik fabrics. Consequently, visible mangrove degradation is in a small area (Fig 5B). Although the local community still maintain their cultural ties by referring to mangroves local terms such as ‘bakau-bakau’ for Rhizophora sp. and ‘api-api’ for Avicennia sp. (Indarjani & Wibowo et al., 2021), this cultural heritage is at risk of gradual loss if mangrove cover continues to decline due to overexploitation, land-used conversion, and external pressure.
4.3 Mangrove Community NDVI Value
Overall, NDVI can analyze the density and health of mangrove areas. Fertile soil is a key indicator of healthy mangrove presence because it provides abundant nutrients that support optimal mangrove growth (Azzahra et al., 2025). The NDVI values produced from the two estuaries fall into the moderate to high category with values of 0.3–0.8 (Fig 6). Muara Nawan has shown a steady annual increase in mangrove density, in contrast to Muara Kuntul, which experienced significant fluctuations between 2021 and 2023. The lowest density was obtained in 2019 because mangrove planting was massive 2019 and takes time to grow. In 2023, there was a decline in mangrove density, particularly in the outermost zone facing the open sea (Fig 6F). This reduction may happen because it is influenced by the movement of tidal currents with the amount of rubbish carried from the sea, which can inhibit the growth of existing mangrove vegetation (Hanan et al., 2020). Additionally, the northern coast of Java is affected by monsoonal patterns and is frequently subjected to tidal flooding or seawater intrusion. These factors cause significant geomorphological changes and increase the vulnerability of coastal areas (Persada et al., 2025).
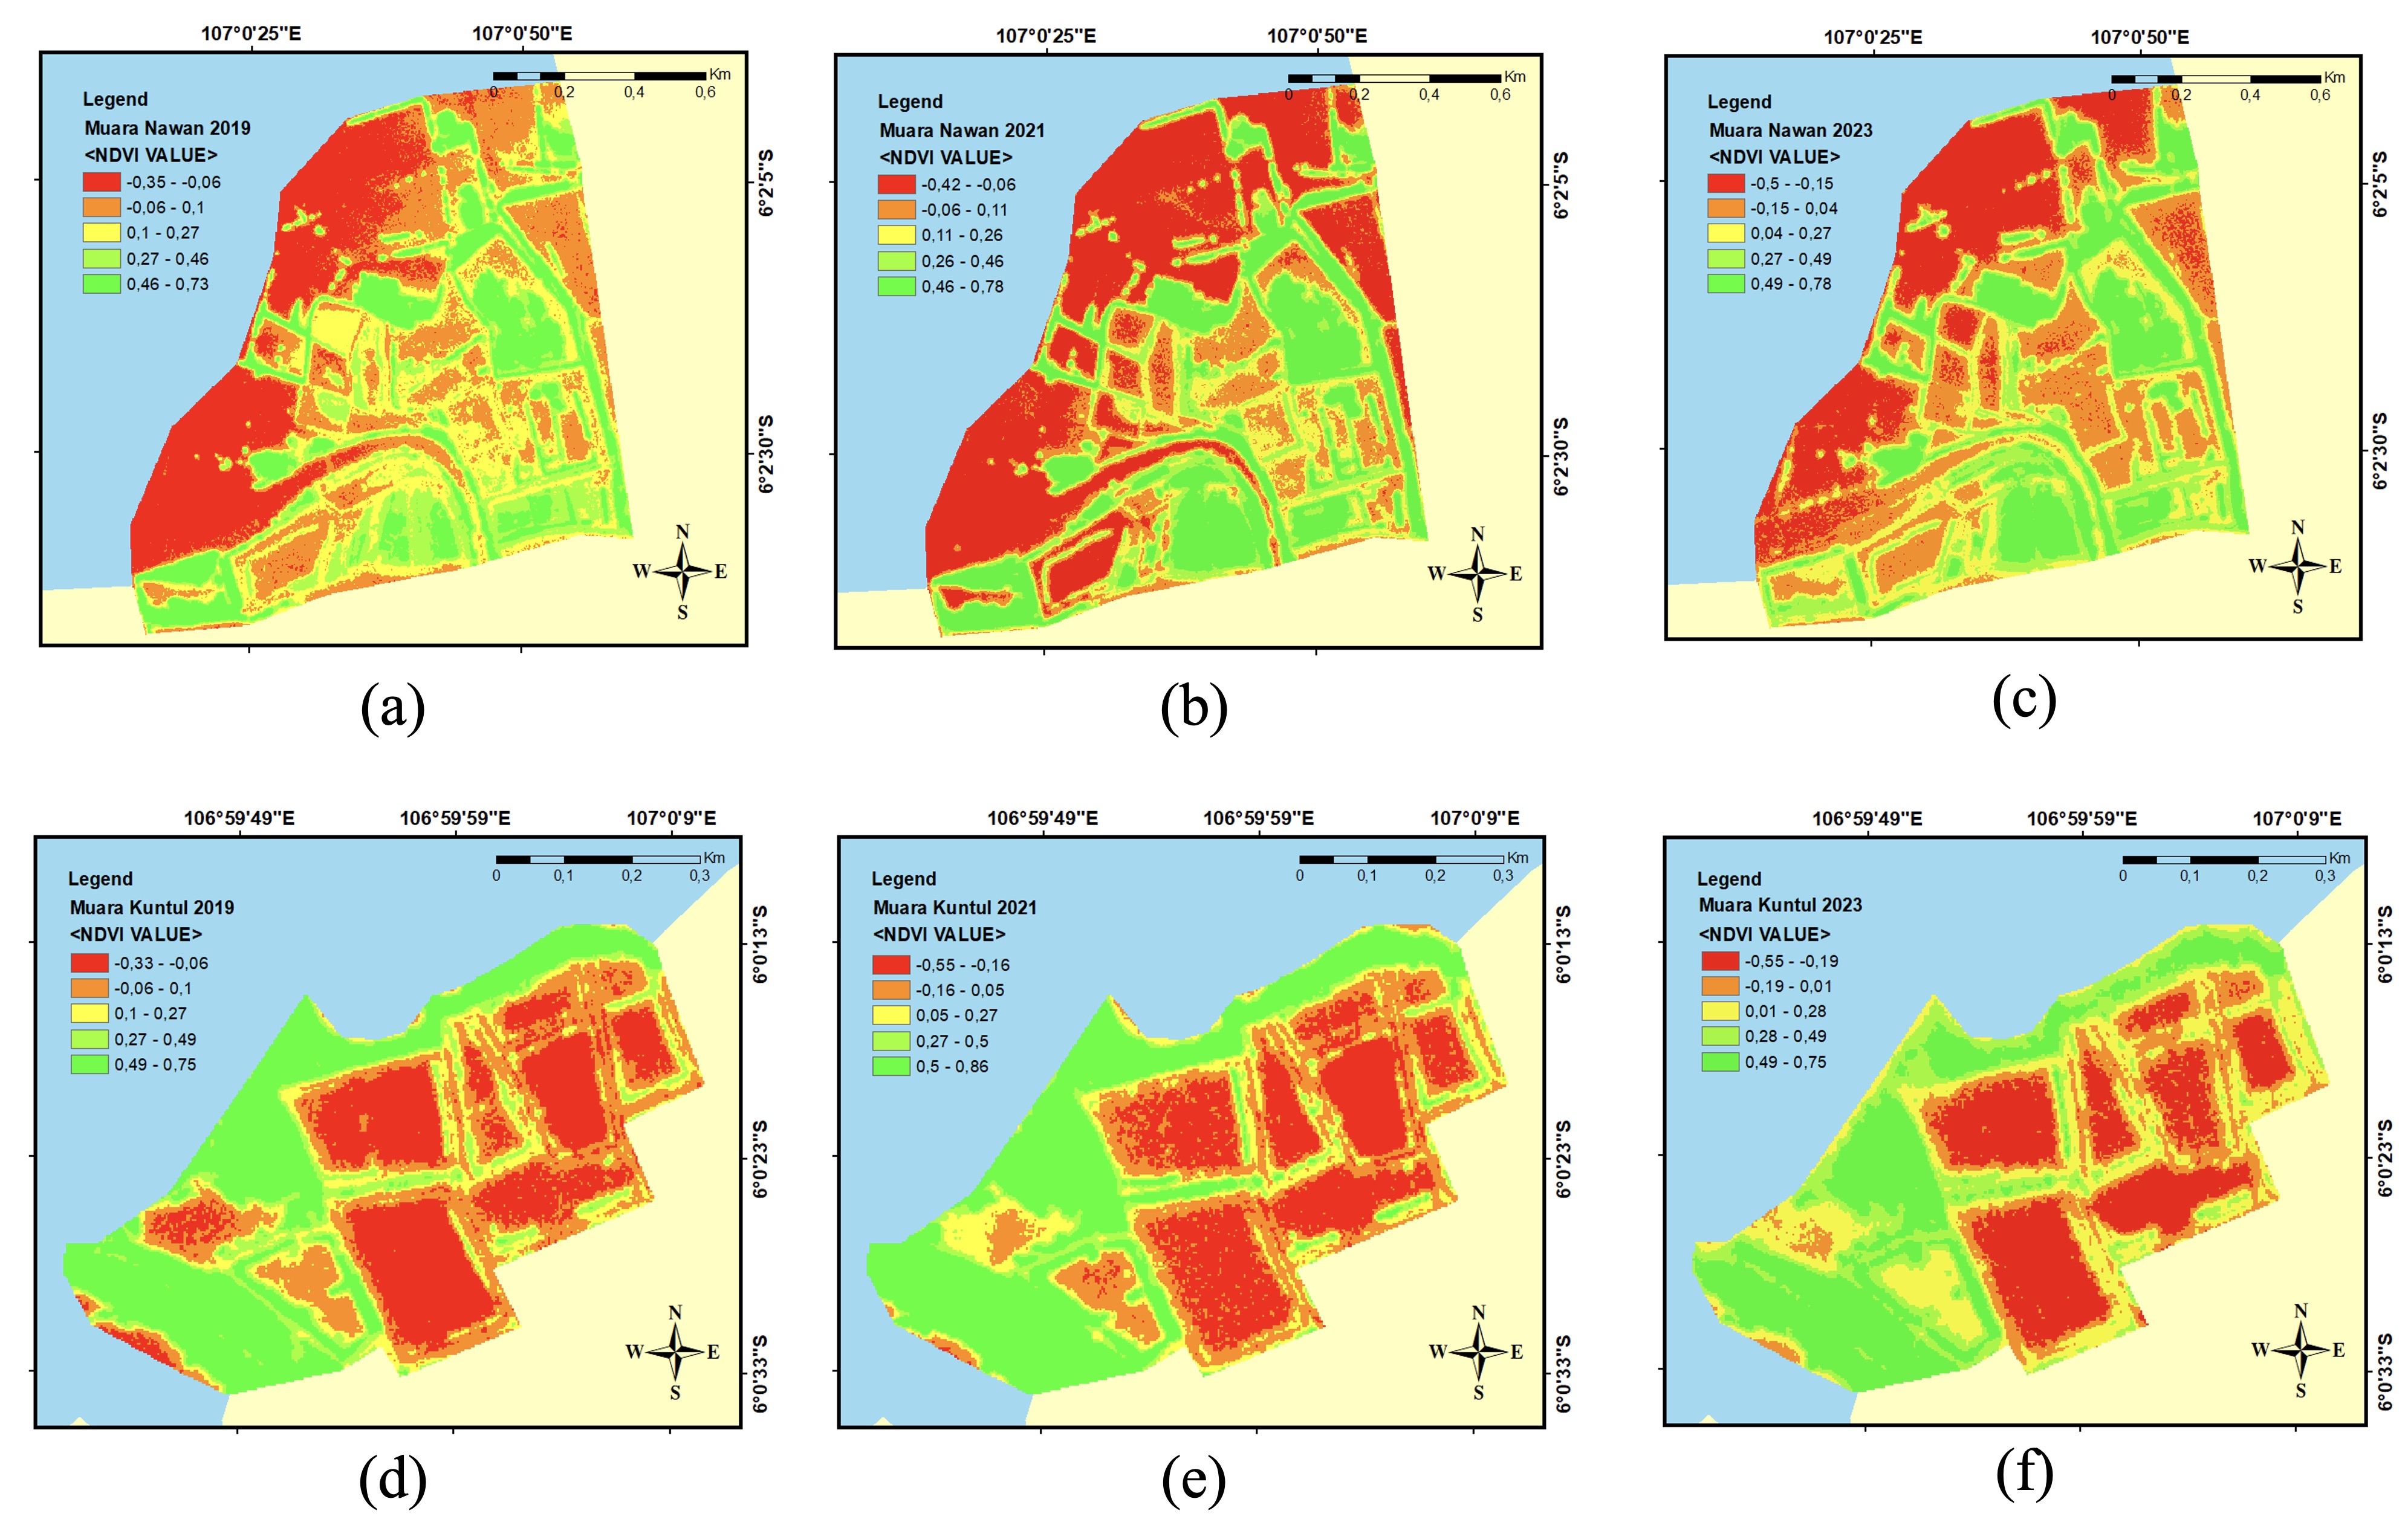
This demonstrates that Avicennia sp. and Rhizophora sp. genera exhibit distinct reflectance characteristics. Based on a study by Faizal and Amran (2005), the NDVI value produced by Rhizophora sp. has a range of 0.27–0.33. Based on processed data, Rhizophora sp. exhibits a spectral reflectance range of 0.2–0.45, while Avicennia sp. reflects brighter spectral light and has a higher NDVI value with a range of > 0.45 (Fig 6). This is due to Avicennia sp. reflecting more NIR radiation, approximately 20–50%, compared to Rhizophora sp., which reflects only about 15–35% (Kuenzer et al., 2011). The higher the density value of the mangrove community, the denser the mangrove population in the area and the more optimal carbon absorption. Conversely, lower NDVI values may indicate potential mangrove degradation, which anthropogenic activities or natural factors can cause (Yulius et al., 2019).
4.4 Drone Data Validation
The data acquisition process for orthophoto generation and field validation in Muara Kuntul covers a relatively small area of 13.5 km with 3 flight times, which produced 246 aerial photos. This study used drone imagery as a validation reference for the classified satellite imagery data. Avicennia sp. has a higher spectral reflectance than Rhizophora sp., which causes Rhizophora sp. to have a higher chlorophyll content, making the absorption of red light greater with a wavelength of 660 nm (Java, 2020). Furthermore, a recent study by Chen et al. (2025) reported that Rhizophora sp. typically has a nearly round shape with a dark green colouration. In contrast, Avicennia sp. is characterized by a lighter green colour (Fig 7).
Conclusion
This study concludes that the classification conducted using a machine learning approach with the SVM algorithm detected two types of mangrove communities: Avicennia sp. and Rhizophora sp.. From the classification results, the mangrove area in Muara Nawan tended to increase due to rehabilitation activities by local communities in 2019 and 2022. In contrast, Muara Kuntul experienced a significant decrease in the mangrove area mainly due to the economical use of Rhizophora sp. and the land conversion into shrimp and fish ponds. Types of mangroves have different spectral responses following band compositions using RGB. Avicennia sp., which reflected higher levels of NIR light than Rhizophora sp., caused Rhizophora sp. to absorb more red light. Data validation obtained the highest Kappa value, reaching 0.83 and an Overall accuracy of 89%. The lowest accuracy recorded at a Kappa value was 0.66, and the Overall accuracy was 78%, confirming the reliability of the SVM classification integrated with NDVI and drone validation. These results indicate the effectiveness of combining satellite imagery, drone data, and machine learning to monitor mangrove types dynamics over time.
Acknowledgements
We would like to express our sincere gratitude to the Study Program of Marine Science at Universitas Padjadjaran for the opportunity to contribute to research in Muaragembong, facilitated by the National Research and Innovation Agency (BRIN). Their support and collaboration have been invaluable in the successful completion of this study. The authors also to thank Planet Labs PBC for providing the high-resolution PlanetScope imagery under a student license through the Planet Education and Research Program.
References
- Adugna, T., Xu, W., Fan, J. 2022. Comparison of random forest and support vector machine classifiers for regional land cover mapping using coarse resolution FY-3C images. Remote Sensing, 14(3), 574. DOI: https://doi.org/10.3390/rs14030574
- Atun, R., Kalkan, K., Gürsoy, Ö. 2020. Determining The Forest Fire Risk with Sentinel 2 Images. Turkish Journal of Geosciences, 1(1), 22-26. https://dergipark.org.tr/en/pub/turkgeo
- Audina, N., Siregar, V. P., Nurjaya, I. W. 2019. Analisis Perubahan Sebaran Mangrove Menggunakan Algoritma Support Vector Machine (Svm) dengan Citra Landsat di Kabupaten Bintan Kepulauan Riau. Jurnal Ilmu dan Teknologi Kelautan Tropis, 11(1), 49-63. DOI: https://doi.org/10.29244/jitkt.v11i1.22468
- Azzahra, R. Y., Yulius, Agus S. B., Aditama F. A., Arifin T., Putra A., Rahmania R., Heriati A., Prihantono J., Purbani D., Salim H. L., Ramdhan M., Wahyono A., Sadad, Ningsih A., Asyiri A. 2025. Advancing Mangrove Carbon Stock Monitoring With Drone and Pleiades Imagery on Gilibakau Island-Saleh Bay, Indonesia. Journal of Marine and Island Cultures, 14(1), 88–101. DOI: https://doi.org/10.21463/jmic.2025.14.1.06
- Beniwal, D., Dhull, S. S., Gulia, V. Rani, J. 2024. Avicennia: a mangrove genus unveiled through its phytochemistry, pharmacological, and ecological importance. Rendiconti Lincei. Scienze Fisiche e Naturali, 1-23. DOI: https://doi.org/10.1007/s12210-024-01278-1
- Cao, J., Leng, W., Liu, K., Liu, L., He, Z., Zhu, Y. 2018. Object-based mangrove species classification using unmanned aerial vehicle hyperspectral images and digital surface models. Remote Sensing, 10(1), 89. DOI: https://doi.org/10.3390/rs10010089
- Cao, J., Liu, K., Liu, L., Zhu, Y., Li, J., He, Z. 2018. Identifying mangrove species using field close-range snapshot hyperspectral imaging and machine-learning techniques. Remote Sensing, 10(12), 2047. DOI: https://doi.org/10.3390/rs10122047
- Cerri, F., Mohamed, S., Nicolai, R., Galli, P., Fallati, L., Mazumdar, A., Adam, A. S., Louis, Y. D., Siena, F., Zitouni, M. S., Lavorano, S. 2024. Mangroves of the Maldives: a review of their distribution, diversity, ecological importance and biodiversity of associated flora and fauna. In Aquatic Sciences (Vol. 86, Issue 2). DOI: https://doi.org/10.1007/s00027-024-01061-2
- Chen, X., Zhang, X., Zhuang, C., Dai, X., Kong, L., Xie, Z., Hu, X. 2025. An Approach for Detecting Mangrove Areas and Mapping Species Using Multispectral Drone Imagery and Deep Learning. Sensors, 25(8), 2540. DOI: https://doi.org/10.3390/s25082540
- Congalton, R. G. 1991. A review of assessing the accuracy of classifications of remotely sensed data. Remote Sens Environ 37(1):35–46. DOI: https://doi.org/10.1016/0034-4257(91)90048-B
- Faizal, A., Amran, M.A. 2005. Model Transformasi Indeks Vegetasi yang Efektif Untuk Prediksi Kerapatan Mangrove Rhizophora mucronata. Prosiding PIT MAPIN XIV ITS, Surabaya, 14-15 September 2005.
- Gabr, B., Ahmed, M., Marmoush, Y. 2020. PlanetScope and landsat 8 imageries for bathymetry mapping. Journal of Marine Science and Engineering, 8(2), 143. DOI: https://doi.org/10.3390/jmse8020143
- Hanan, A. F., Pratikto, I., Soenardjo, N. 2020. Analisa distribusi spasial vegetasi mangrove di desa Pantai Mekar Kecamatan Muara Gembong. Journal of Marine Research, 9(3), 271-280. DOI: https://doi.org/10.14710/jmr.v9i3.27573
- Herawati, H., Sahidin, A., Nurruhwati, I., Hamdani, H., Aprliniani, I. M., Dewanti, L. P. 2022. Penyuluhan pentingnya green belt dan penanaman mangrove di Muara Gembong Kabupaten Bekasi. Farmers: Journal of Community Services, 3(1), 36-40. DOI: https://doi.org/10.24198/fjcs.v3i1.37813
- Indarjani, R., Wibowo, A. 2021. Studi Etnobotani Mangrove pada Masyarakat Pesisir Muara Gembong, Bekasi, Jawa Barat. Journal of Tropical Ethnobiology, 2021 (Prosiding Seminar Nasional PMEI V 2020), 111–115. http://jte.pmei.or.id/index.php/jte/article/view/131
- Java, C. A. 2020. Studi Adaptasi Mangrove Jenis Rhizophora mucronata Terhadap Limbah Organik Berdasarkan Variasi Karakteristik Daun Di Kawasan Mangrove Wonorejo Kota Surabaya (Doctoral dissertation, Institut Teknologi Sepuluh Nopember).
- Kuenzer, C., Bluemel, A., Gebhardt, S., Quoc, T. V., Dech, S. 2011. Remote sensing of mangrove ecosystems: A review. Remote Sensing, 3(5), 878-928. DOI: https://doi.org/10.3390/rs3050878
- Lee, J. S., Kim, J. W. 2018. Dynamics of zonal halophyte communities in salt marshes in the world. Journal of Marine and Island Cultures, 7, 84-106. DOI: https://doi.org/10.21463/jmic.2018.07.1.06
- Lisein, J., Michez, A., Claessens, H., Lejeune, P. 2015. Discrimination of deciduous tree species from time series of unmanned aerial system imagery. PLoS ONE, 10(11), 1–20. DOI: https://doi.org/10.1371/journal.pone.0141006
- Lukman, K. M., Quevedo, J. M. D., Rifai, H., Alifatri, L. O., Ulumuddin, Y. I., Sofue, Y., Uchiyama Y., Kohsaka, R. 2025. Mangrove forest food products as alternative livelihood measures: mangrove conservation by community in Muara Gembong, Bekasi Regency, Indonesia. Discover Sustainability, 6(1), 1-14. DOI: https://doi.org/10.1007/s43621-025-01049-4
- Malaysia, K. 2021. Morphological Structures of Rhizophora Apiculata Blume and Rhizophora Mucronata Lam. Science, 5(1), 01-04. DOI: http://doi.org/10.26480/gws.01.2021.01.04
- Maulana, G. F., Saputra, R., Raynaldo, A. 2024. Monitoring Mangrove Forest Conditions Using Satellite Imagery in Kemboja Village. Journal Laot Ilmu Kelautan. Vol 6(2). DOI: https://doi.org/10.35308/jlik.v6i2.10060
- Ngo, D., Nguyen, H., Nguyen, K., Dang, C., Nguyen, H., Dang, N., Pham, T. 2023. Application of multispectral UAV to estimate mangrove biomass in Vietnam: A case study in Dong Rui commune, Quang Ninh Province. One ecosystem, 8, e103760. DOI: https://doi.org/10.3897/oneeco.8.e103760
- Persada, A. T., Agus, S. B., Salim, H. L., Dillenia, I., Arifin, T., Heriati, A., Prihantono, J., Purbani, D., Purnamaningtyas, S. E., Tjahjo, D. W. H., Ramdhan, M., Suryawati, S. H., Wahyono, A., Wisha, U. J., Zulfiandi, Kurniawan, F. 2025. Olipier cultural site vulnerability analysis in East Belitung, Indonesia: Cultural resources vulnerability (CRV) methods. The Egyptian Journal of Remote Sensing and Space Sciences, 28(2), 167-184. DOI: https://doi.org/10.1016/j.ejrs.2025.03.001
- Pratama, B. A., Pratikto, I., Santoso, A., Suryono, S. 2022. Sebaran Spasial Mangrove di Desa Pantai Bahagia, Kecamatan Muara Gembong, Kabupaten Bekasi. Journal of Marine Research, 11(2), 167-175. DOI: https://doi.org/10.14710/jmr.v11i2.33765
- Purnamasari, E., Kamal, M., Wicaksono, P., Hidayatullah, M. F., Susetyo, B. B. 2024. Multi-spatial Resolution Imagery to Estimate Above-Ground Carbon Stocks in Mangrove Forests. JOIV: International Journal on Informatics Visualization, 8(3), 1118-1125. https://doi.org/10.62527/joiv.8.3.2237
- Rachmawati, D., Setyobudiandi, I., Hilmi, E. 2014. Potensi Estimasi Karbon Tersimpan pada Vegetasi Mangrove di Wilayah Pesisir Muara Gembong Kabupaten Bekasi. [The Potency of Carbon Stock in Mangrove Vegetation at Muara Gembong Coastal Area, Bekasi Regency] 10(2). DOI: https://doi.org/10.20884/1.oa.2014.10.2.22
- Rahmawati, A. D., Asy'Ari, R., Dzulfigar, A., Destia, R. A. F., Ananda, R., Faridah, D., Adilla, J. C., Firmansyah, L. M. P., Marfi, K. P., Puspitasari, R. F., Ulfa, A., Puspita, S., Gustawan, A. H., Rival, F. A., Fadhil, M. H., Zamani, N. P., Pramulya R., Setiawan, Y. 2024. Agricultural and fishery activities on mangrove ecosystem area, Bekasi Regency: exploration studies of land use conditions in the coastline buffer area. SSRS Journal A: Agro-Environmental Research, 2, 48-69.
- Rahmawati, S., Irawan, A., Supriyadi, I. H., Azkab, M. H. 2014. Seagrass monitoring guidelines. In M. Hutomo& A. Nontji (Ed.). First Edition. COREMAP-CTI. Indonesian Institute of Sciences. Main Communication Facilities. Bogor. Viii, 37hlm.
- Ramdhan, M., Maftukhaturrizqoh, O., Arifin, T., Purbani, D., Akhwady, R., Yulius, Y., Rahmania, R., Gunawan, D., Asyiri, A., Hidayat, S. 2024. Hubungan Antara Indeks Pengindraan Jauh Dengan Tingkat Pencemaran Udara di Kota Jakarta Pasca Pandemi: Correlation Between Remote Sensing Index and Air Pollution Levels in the City of Jakarta Post-Pandemic. Jurnal Riset Jakarta, 16(2), 59-68. DOI: https://doi.org/10.37439/jurnaldrd.v16i2.91
- Razaque, A., Ben Haj Frej, M., Almi’ani, M., Alotaibi, M., Alotaibi, B. 2021. Improved support vector machine enabled radial basis function and linear variants for remote sensing image classification. Sensors, 21(13), 4431. DOI: https://doi.org/10.3390/s21134431
- Rwanga, S. S., Ndambuki, J. M. 2017. Accuracy assessment of land use/land cover classification using remote sensing and GIS. International Journal of Geosciences, 8(04), 611. DOI: https://doi.org/10.4236/ijg.2017.84033
- Salim, H., Adi, N., Kepel, T., Ati, R. 2020. estimating mangrove biomass using drone in karimunjawa islands. IOP Conference Series Earth and Environmental Science, 561(1), 012054. DOI: https://doi.org/10.1088/1755-1315/561/1/012054
- Soifer, V. A., Sergeev, V. V., Kopenkov, V. N., Chernov, A. V. 2023. Earth Remote Sensing and Geographic Information Systems. Pattern Recognition and Image Analysis, 33(4), 1129-1141. DOI: https://doi.org/10.1134/S1054661823040454
- Suryadi, T., Yulianda, F., Susanto, H. A. 2021. Analisis Kesesuaian Kawasan Konservasi Mangrove di Muara Gembong, Kabupaten Bekasi Provinsi Jawa Barat. EnviroScienteae, 17(3), 11-24. DOI: https://doi.org/10.20527/es.v17i3.11635
- Sutrisno, D., Rifaie, F., Rudiastuti, A. W., Rahadiati, A., Purwandani, A., Rahman, A., Pratama, B. B. 2024. A Systematic Review of the Scientific Literature to Identify Challenges for the Sustainable Development of Seaweed Farming in Indonesia. Journal of Marine and Island Cultures, 13(3), Pp 136–159. DOI: https://doi.org/10.21463/jmic.2024.13.3.08
- Suwargana, N. 2008. Analisis perubahan hutan mangrove menggunakan data penginderaan jauh di Pantai Bahagia, Muara Gembong, Bekasi. Jurnal Penginderaan Jauh, 5(1), 64-74. DOI: https://doi.org/10.30536/inderaja.v5i1.3238
- Torres-Aguirre, E., Flores-de-Santiago, F., Valderrama-Landeros, L., Amezcua, F., Flores-Verdugo, F. 2024. Semiarid mangrove species classification using machine learning algorithms and visible UAV data. Indian Journal of Geo-Marine Sciences (IJMS), 53(03), 109-118. DOI: https://doi.org/10.56042/ijms.v53i03.8184
- Wulandari, Y. P., Suhardjito, D., Kriswantriyono, A., Riyadi, R., Aulia, F., Wibisono, T. 2024. Strategi Pemberdayaan Masyarakat Dalam Konservasi Mangrove Di Pantai Bungin, Muara Gembong Kabupaten Bekasi. Jurnal Resolusi Konflik, CSR dan Pemberdayaan (CARE), 9(1), 20-29. https://journal.ipb.ac.id/index.php/jurnalcare/article/view/61763
- Wu, Q., Zhou, D. X. 2005. SVM soft margin classifiers: linear programming versus quadratic programming. Neural computation, 17(5), 1160-1187. DOI: https://doi.org/10.1162/0899766053491896
- Ye, Y., Tam, N. F. Y., Lu, C. Y., Wong, Y. S. 2005. Effects of salinity on germination, seedling growth and physiology of three salt-secreting mangrove species. Aquatic Botany, 83(3), 193-205. DOI: https://doi.org/10.1016/j.aquabot.2005.06.006
- Yulius, Y., Amri, S.N., Daulat, A., Putri, S. I. 2019. Assessment of Mangrove Ecosystem Potency and Its Utilization in Dompu Regency Coastal Waters, West Nusa Tenggara Province Using Satellite Imagery Application. Jurnal Segara, 15(2), pp.89-98. DOI: https://doi.org/10.15578/segara.v15i2.7461
- Yulius, Y., Arifin, T. 2014. Analisis sistem informasi geografis (SIG) untuk potensi wisata pantai di Kota Makasar, Provinsi Sulawesi Selatan. Tataloka, 16(3), 145-152. DOI: https://doi.org/10.14710/tataloka.16.3.145-152
- Yusof, A. A., Nor, M. K. M., Mohd Shaari Azyze, N. L. A., Kassim, A. M., Shamsudin, S. A., Sulaiman, H., Hanafi, M. A. 2022. Land clearing, preparation and drone monitoring using Red-Green-Blue (RGB) and thermal imagery for Smart Durian Orchard Management project. Journal of Advanced Research in Fluid Mechanics and Thermal Sciences, 91(1), 115-128. DOI: https://doi.org/10.37934/arfmts.91.1.115128
- Zhang, X., Estoque, R. C., Murayama, Y. 2017. An urban heat island study in Nanchang City, China based on land surface temperature and social-ecological variables. Sustainable Cities and Society, 32(January), 557–568. DOI: https://doi.org/10.1016/j.scs.2017.05.005