Advancing Mangrove Carbon Stock Monitoring With Drone and Pleiades Imagery on Gilibakau Island-Saleh Bay, Indonesia
Abstract
Mangrove ecosystems play a pivotal role in climate change mitigation due to their exceptional carbon sequestration capacity and the vital ecosystem services they provide. This study examines changes in mangrove cover and estimates carbon stocks on Gilibakau Island, Saleh Bay, Indonesia, utilizing Pleiades satellite imagery and drone-derived data. Analysis of Pleiades imagery from 2020 and 2022 identified an increase in mangrove area from 6.53 hectares to 6.71 hectares, attributed primarily to rehabilitation initiatives, including replanting programs. Biomass was quantified using drone-based data collected in 2024, employing a tree height-based allometric model. The estimated biomass ranged from 23.63 to 192.69 tonnes per hectare, reflecting the high-density mangrove cover and its significant carbon storage potential. Regression analysis revealed a strong correlation (R² = 0.863) between Normalized Difference Vegetation Index (NDVI) values and biomass, validating NDVI as an effective proxy for mangrove biomass estimation.
Keywords
Mangrove, Allometric Model, Carbon Stock, Pleiades, NDVI, Saleh Bay
Introduction
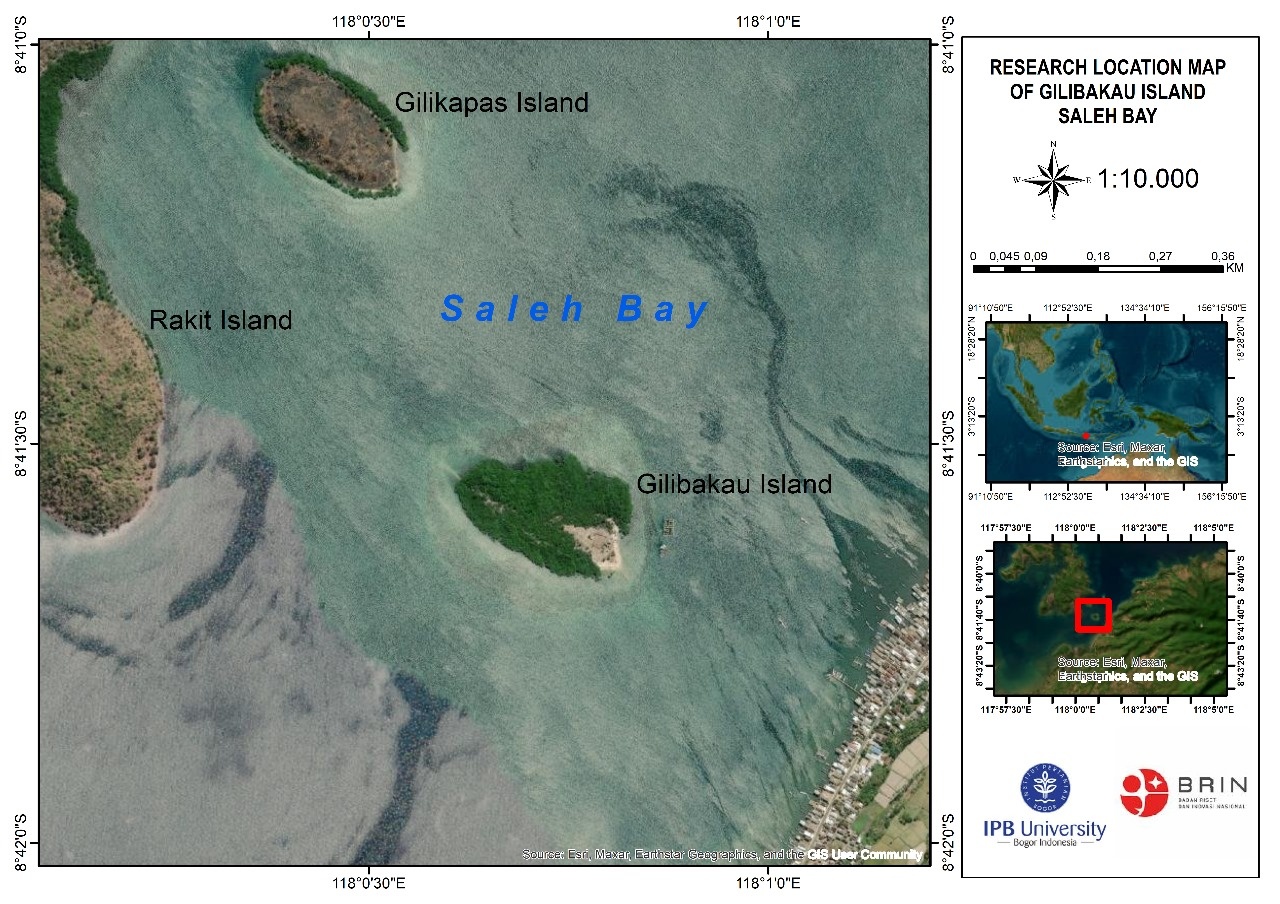
Saleh bay, located on the island of Sumbawa in West Nusa Tenggara Province, is the largest bay in the region. This semi-enclosed bay is directly connected to the Flores Sea, with Moyo Island acting as a natural barrier (Yulius, 2017). In 2019, UNESCO designated Saleh Bay, Moyo Island, and Mount Tambora as part of a World Biosphere Reserve. The bay spans an area of approximately 1,495 square kilometers and extends 282 kilometers in length. It is renowned for its rich marine biodiversity and diverse coastal ecosystems, including extensive mangrove forests and vibrant coral reefs (Satria and Mujiyanto, 2011). The unique geographical features of Saleh Bay, surrounded by numerous small islands such as Dangar Rea Island, Liang Island, Ngali Island, and Rakit Island, contribute to its ecological significance and biological richness.
Mangrove ecosystems hold significant ecological, biological, and physical importance in coastal regions. They provide a wide range of ecosystem services, including carbon sequestration, which is critical for climate change mitigation (Fourqurean et al., 2019). Additionally, mangroves play essential roles in the fisheries sector by protecting shorelines, preventing seawater abrasion, providing habitats for diverse aquatic species, and regulating local microclimates (Kepel, 2017). These ecosystems are capable of storing substantial quantities of carbon in their biomass (Alongi, 2012). However, data from the Food and Agriculture Organization (FAO) indicate a decline in Indonesia's mangrove forest area from 4.2 million hectares in 2007 to 2.9 million hectares, largely driven by anthropogenic activities. Mangrove forests also contribute to reducing emissions and mitigating air pollution by absorbing significant amounts of CO₂. The extent of CO₂ absorption can be assessed by estimating the total carbon stock within mangrove biomass (Suardana et al., 2022).
Blue carbon refers to the carbon stored in coastal ecosystems, including mangrove forests, tidal marshes, and seagrass meadows, within various carbon pools such as soil, aboveground living biomass (leaves, branches, stems), belowground living biomass (roots), and non-living biomass (e.g., litter and dead wood) (McLeod et al., 2011). The proportion of carbon originating from within the ecosystem versus external sources varies across blue carbon systems, with mangroves and tidal salt marshes primarily sequestering carbon produced by plants within the ecosystem. Coastal blue carbon ecosystems provide critical services, such as coastal protection through wave attenuation and erosion prevention (Gedan et al., 2011). These systems also regulate water quality, support habitats for numerous fish and shellfish species, supply timber and other resources for local communities, and sustain high biodiversity. The term "carbon stocks" refers to the amount of organic carbon (Corg) stored within blue carbon ecosystems. Monitoring the condition of these ecosystems can be achieved using various methods, including Geographic Information Systems (GIS) and remote sensing technologies. Remote sensing serves as an alternative approach to estimating carbon stock in mangrove ecosystems (Pham et al., 2019). Satellite imagery with sensors sensitive to green vegetation can address challenges in carbon stock estimation, as it allows for the identification of relationships between pixel values and biomass. For example, Utari et al. (2020) demonstrated that estimating carbon stocks in mangrove forests can be achieved by correlating image pixel values with biomass data.
Pleiades satellite imagery was utilized in this study due to its high-resolution capabilities for change detection and mapping (Jenerowicz et al., 2019). Pleiades satellites are classified as very high-resolution systems, featuring panchromatic bands with a spatial resolution of 50 cm and four multispectral bands (red, green, blue, and near-infrared) with a spatial resolution of 2 meters (Materne et al., 2001).
The study aims to analyze changes in mangrove cover within the Saleh Bay region between 2020 and 2022 using Pleiades imagery and to evaluate the potential carbon stock of mangroves by mapping biomass and above ground carbon using drone-derived data collected in 2024. The findings are intended to support the early identification of rehabilitation efforts and provide insights into the carbon storage potential of mangroves in Saleh Bay.
Material and Methods
Study Area
Methods
2.1 Tools and Materials
| Tools | Information |
|---|---|
| Laptop | Device for data processing |
| Webodm | Drone data processing |
| QGIS | Pleiades image data processing |
| Drone | MEVIC 2 Pro Zoom |
| ENVI | Pleiades image data processing |
| Materials | Information |
|---|---|
| Citra Pleiades | Image data for data processing |
| Aerial photography | Drone photo results on July 24, 2024 |
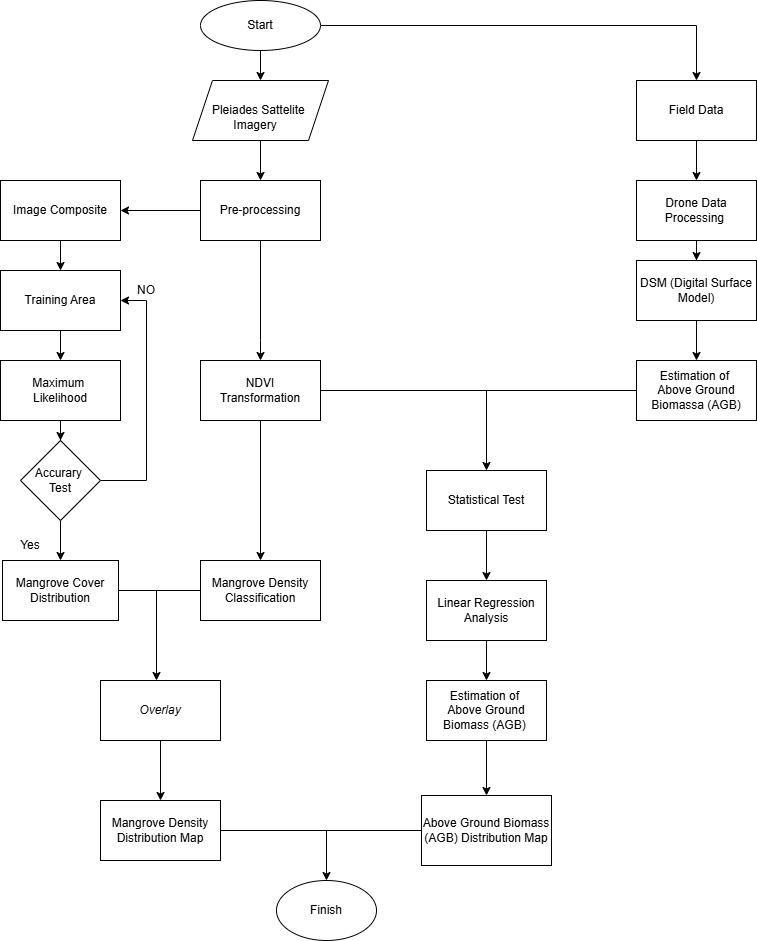
2.2 Work Procedure
The data processing for analyzing changes in mangrove area cover involved collecting satellite imagery and aerial photography from drone surveys. Pleiades image data were processed using QGIS software, where the Normalized Difference Vegetation Index (NDVI) was calculated. Mangrove biomass was then estimated by determining the height of mangrove stands derived from drone data. The final steps included accuracy testing and model validation, followed by the creation of a map depicting changes in mangrove ecosystem cover.
2.3 Data Collection
The data utilized in this study include both satellite imagery and in situ data. The secondary data consist of Pleiades satellite imagery from 2020 and 2022, which were processed using QGIS software. In addition to the satellite data, in situ data from drone surveys and aerial photographs were processed using webODM software. The processing steps involved photo alignment, texture generation, the creation of Digital Surface Models (DSM) and Digital Terrain Models (DTM), and the export of images into orthomosaic map format.
2.4 Image Data Processing
The processing of image data involves multiple stages, including data pre-processing, band compositing, supervised image classification using the Maximum Likelihood (MLH) algorithm, and analysis of Normalized Difference Vegetation Index (NDVI) values. The NDVI is utilized due to its simplicity and sensitivity to chlorophyll, making it an effective indicator of active photosynthetic activity (Albasit et al., 2022). The NDVI classification for satellite imagery is calculated using the following formula:
\[NDVI = \frac{NIR - Red}{NIR + Red}\]
Description:
- NDVI:
- Normalized Difference Vegetation Index (NDVI) value
- NIR:
- Spectral reflectance value in channel 4 of Pleaides Image
- Red:
- Spectral reflectance value in channel 3 of Pleaides Image
The results of the analysis using the NDVI method are subsequently reclassified into predefined categories based on the criteria specified in the 2012 Indonesian Minister of Forestry Regulation, as detailed in Table 3.
| No | Condition | Category | NDVI |
|---|---|---|---|
| 1 | Poor | Sparse | \(0.15 \leq x \leq 0.25\) |
| 2 | Medium | Medium | \(0.25 \leq x \leq 0.35\) |
| 3 | Good | Dense | \(0.35 \leq x \leq 1.00\) |
2.5 Mangrove Tree Biomass Calculation
Mangrove biomass estimation can be performed using allometric equations, which commonly require tree diameter as a primary parameter, along with wood density and tree height. However, as the aerial photography data collected via drones provided only tree height, the Saenger and Snedaker equation was employed, which uses tree height as the primary parameter. Tree height measurements were derived from the Digital Surface Model (DSM) and subsequently corrected using the Digital Terrain Model (DTM). The Saenger and Snedaker equation (Saenger and Snedaker, 1993) for estimating biomass based on tree height is as follows:
\(BIOMASS (t.ha - 1) = 10,8*High (m) + 34,994\)
2.6 Linear Regression Statistical Test Analysis
\( Y = a + bx \)
Description:
- \(a\):
- Intercept
- \(b\):
- Regression coefficient (slope)
- \(x\):
- NDVI value (Normalized Difference Vegetation Index)
- \(Y\):
- Actual biomass value of field data
Where the values of a and b are calculated using the formula:
|
\[ a = \frac{(\sum Y)(\sum Y^2) - (\sum X)(\sum XY)}{n(\sum X^2) - (\sum X)^2} \] |
|
\[ b = \frac{n(\sum XY) (\sum X)(\sum Y)}{n(\sum X^2) - (\sum X)^2} \] |
Results
This research utilizes Pleiades satellite imagery acquired on July 1, 2020. The selected images are of optimal quality, devoid of cloud interference, which can otherwise obscure portions of the imagery and hinder accurate interpretation. The pre-processed Pleiades imagery undergoes band compositing and image cropping to prepare it for further analysis.

The analysis of mangrove distribution and density on Gilibakau Island, Saleh Bay, in 2020, using Pleiades imagery, categorized mangrove density into three classes: dense, medium, and sparse. The dense mangrove class was the most predominant, covering a total area of 6.0555 hectares. This was followed by the medium-density class, which covered 0.3693 hectares, and the sparse class, with an area of 0.1106 hectares. The analysis highlights the clear dominance of the dense mangrove class within the study area.
| Category | Area (Ha) |
|---|---|
| Dense | 6.055539 |
| Medium | 0.3693 |
| Sparse | 0.110622 |
| Total | 6.535461 |
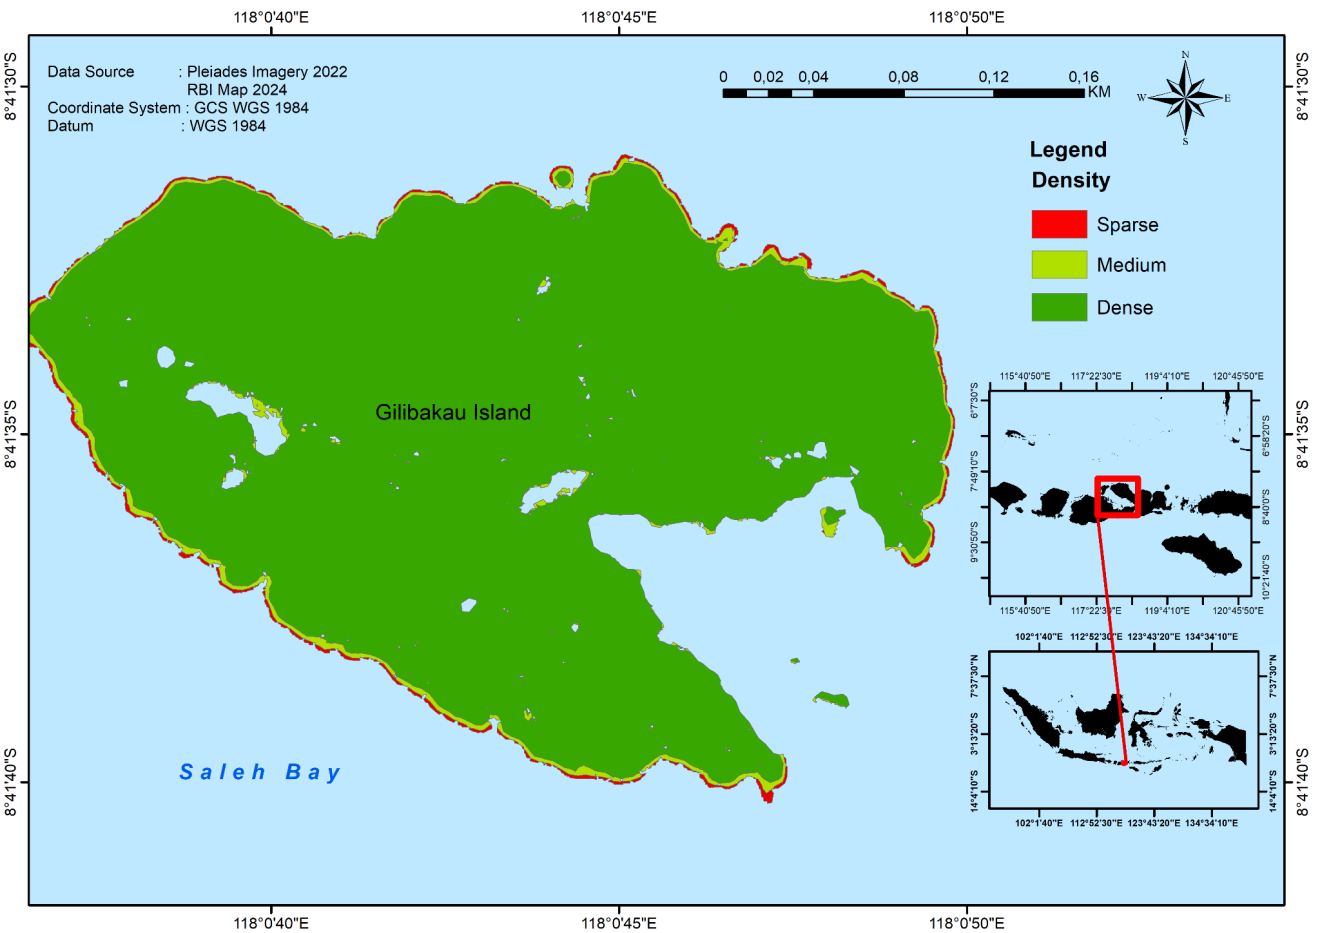
The analysis of mangrove distribution and density on Gilibakau Island, Saleh Bay, in 2022, based on Pleiades imagery, classified mangrove density into three categories: dense, medium, and sparse. The dense class predominated, covering a total area of 6.4203 hectares. This was followed by the medium-density class, occupying 0.2026 hectares, and the sparse class, with an area of 0.0885 hectares (Table 5). The results indicate that the dense class is the dominant mangrove density category.
| Category | Area (Ha) |
|---|---|
| Dense | 6.420254 |
| Medium | 0.202591 |
| Sparse | 0.088483 |
| Total | 6.711328 |
The results of mangrove density distribution analysis on Gilibakau Island revealed three density classes: dense, medium, and sparse. The dense class is represented in solid green, the medium class in light green, and the sparse class in red (Figure 4). Data from 2020 and 2022 indicate the dominance of the dense class. The total area of mangrove ecosystems on Gilibakau Island increased from 6.5355 hectares in 2020 to 6.7113 hectares in 2022, reflecting an increase of 0.175 hectares. This growth is attributed to factors such as mangrove replanting efforts on previously barren land (Asri, 2022). The expansion of mangrove forests on Gilibakau Island, Saleh Bay, has been significantly influenced by ecotourism development in West Nusa Tenggara. As mangroves serve as a primary attraction, their protection has become a priority. This has led to intensified conservation efforts, including replanting programs and the reduction of harmful activities impacting these ecosystems. Ecotourism initiatives have not only heightened awareness of the ecological value of mangroves but have also provided economic incentives for their preservation. Consequently, local communities and stakeholders are increasingly engaged in sustainable practices to ensure the long-term health and resilience of mangrove forests in the region (Yulianto I et al., 2016).
Field Data Biomass Estimation
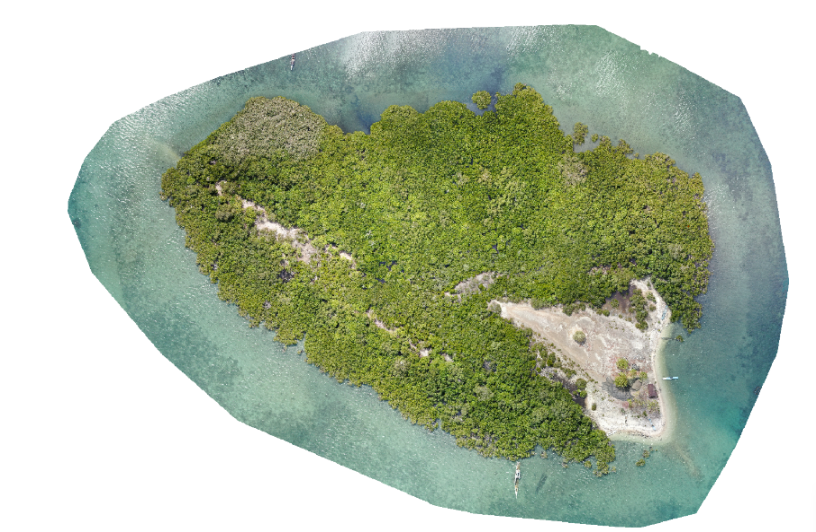
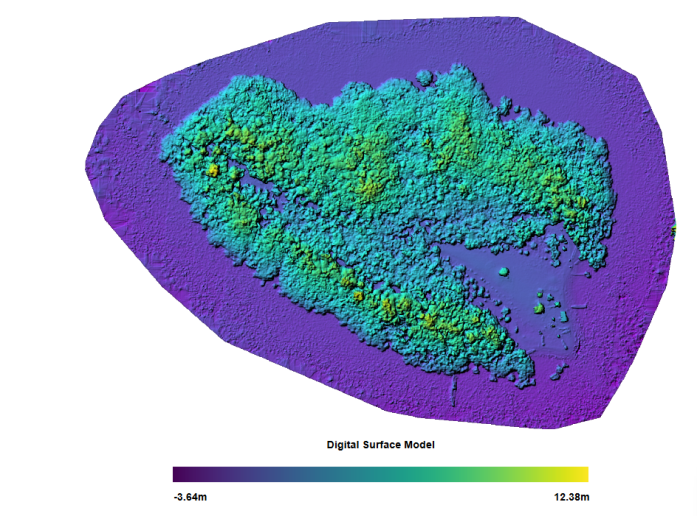
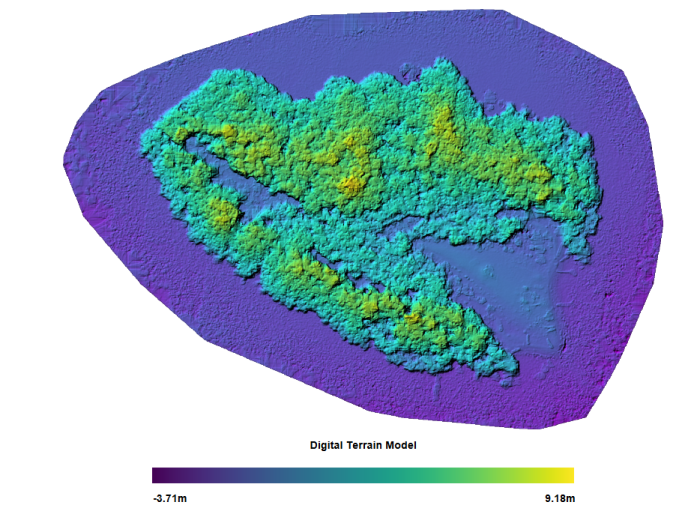
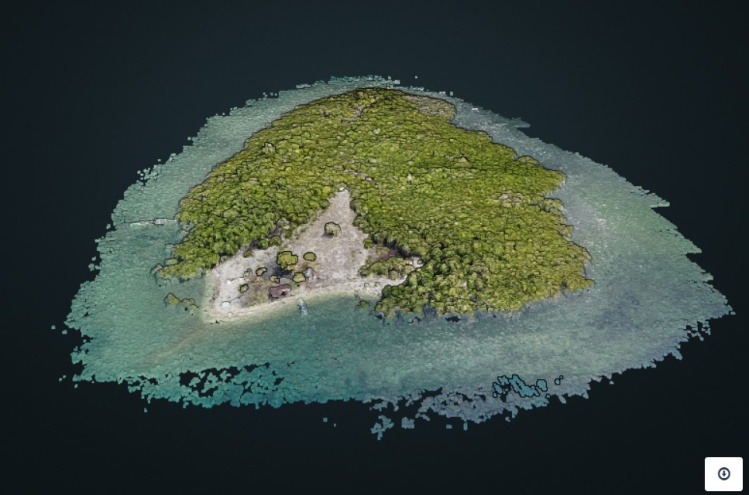
A total of 127 photographs were captured, resulting in the generation of a 3D view and a mosaic map of the study area. The mosaic data and aerial imagery were processed using WebODM software, alongside the creation of Digital Surface Model (DSM) data (Figure 6). Additionally, Digital Terrain Model (DTM) data, which represent the elevation of the Earth's surface in meters, were produced (Figure 7).
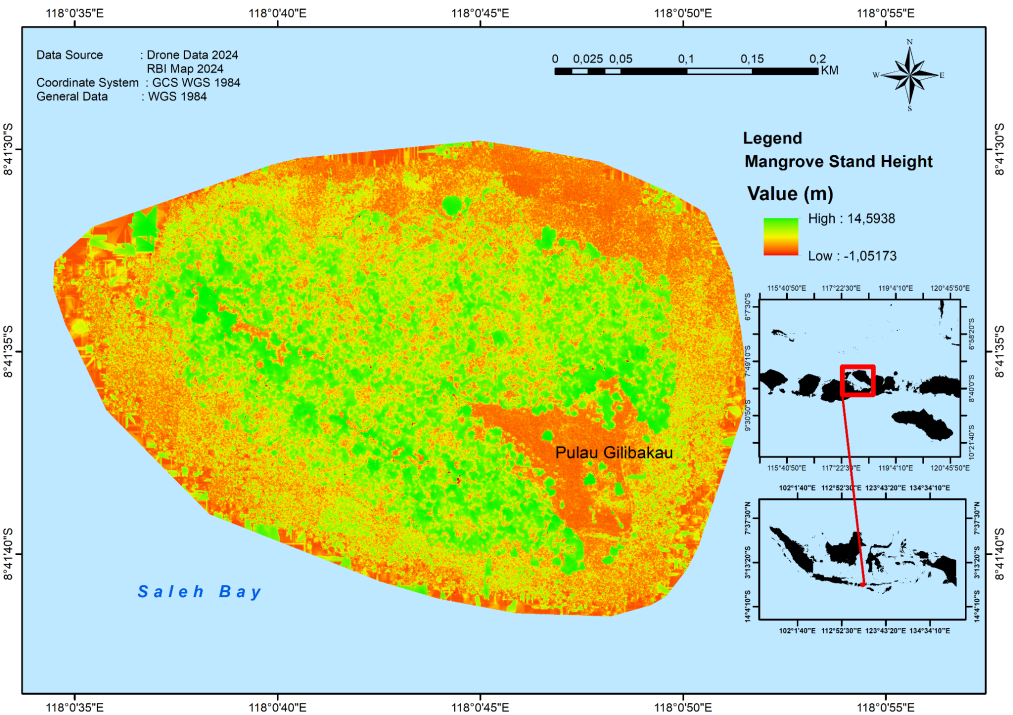
The height of mangrove trees at the study site ranges from 1 to 14.5 meters, reflecting variations in growth patterns. Average tree height serves as an indicator of the overall condition of the mangrove ecosystem, influenced by factors such as soil fertility, nutrient availability, salinity, and inundation levels. These environmental factors significantly impact tree growth and, consequently, the estimation of biomass. Mangrove biomass was estimated to range from 23.63 to 192.69 tonnes per hectare. Lower biomass values were observed in areas with low tree density, smaller trees, or less fertile soil conditions. In contrast, higher biomass values were associated with regions of greater tree density, larger trees, and more fertile environments. The primary determinants of biomass variations are soil fertility and mangrove density. Fertile soils provide abundant nutrients, supporting faster growth and larger tree size. Furthermore, higher tree densities result in greater total biomass, as more trees contribute to the overall estimate. These findings highlight the substantial capacity of mangrove ecosystems for carbon storage. However, their contribution to carbon sequestration depends on environmental conditions and effective management practices within the area.
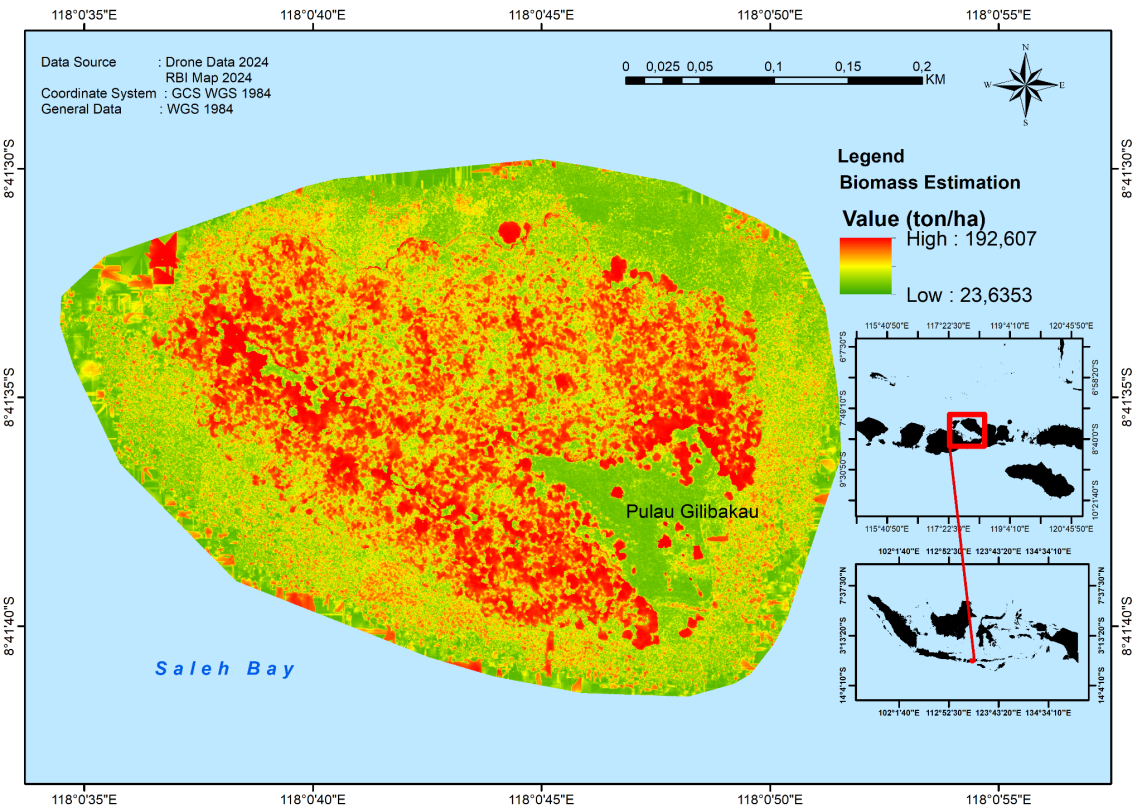
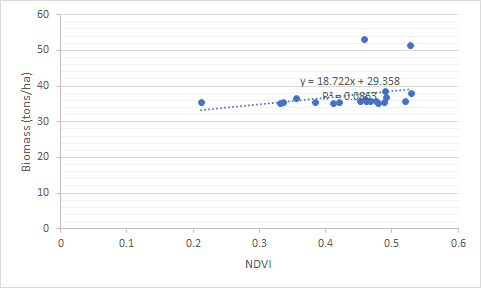
The coefficient of determination (R²) of 86.3% indicates a highly statistically significant relationship between NDVI values and biomass. This suggests that 86.3% of the variation in biomass can be explained by the NDVI values derived from the 2020 Pleiades imagery. NDVI values, which measure vegetation greenness and health, serve as a reliable indicator of mangrove density and condition, demonstrating a strong correlation with biomass. The remaining 13.7% of the variation is attributable to factors not addressed in this study. These may include environmental variables such as salinity, water logging, topography, plant characteristics such as: mangrove species, tree age, or stem diameter, soil properties including nutrient content and structure, and potential inaccuracies in remote sensing data due to image resolution or field data limitations.
The graph depicting the relationship between biomass and NDVI illustrates the linear regression equation, providing insight into the correlation between these two variables. Generally, the regression line indicates a positive trend, where higher NDVI values correspond to greater estimated biomass. However, deviations from the regression line may arise due to additional factors influencing biomass that are not accounted for by NDVI alone.
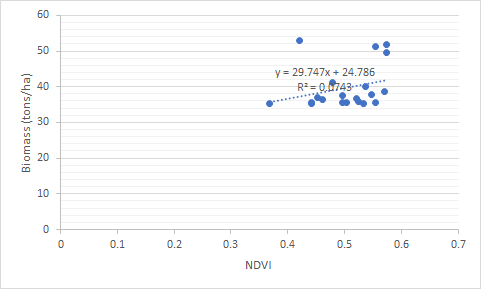
The coefficient of determination (R²) indicates that 74.3% of the variation in biomass values is explained by the independent variable, NDVI, derived from the 2022 Pleiades imagery. The remaining 25.7% is attributed to other variables not included in this study. The graph depicting the relationship between biomass and NDVI, as defined by the linear regression equation, is presented in Figure 12. NDVI reflects vegetation greenness based on the reflectance values in the imagery, whereas the biomass (or carbon) value quantifies the carbon content of tree stands. NDVI is represented in two dimensions, while biomass or carbon values are three-dimensional measures (Rahmawati, 2012). This dimensional discrepancy contributes to the less-than-optimal R² value. The R² value serves as a statistical measure of the relationship between NDVI and biomass or surface carbon values.
Conclusion
The area of mangrove forest on Gilibakau Island increased from 6.535 hectares in 2020 to 6.711 hectares in 2022, with most of this expansion occurring in the dense density category. The analysis revealed a strong correlation between Normalized Difference Vegetation Index (NDVI) values derived from 2020 Pleiades imagery and estimated mangrove biomass, with an R² value of 86.3%, confirming NDVI as an effective tool for biomass estimation. Mangrove biomass values ranged from 23.64 to 192.69 tonnes per hectare, with variations attributed to differences in tree height, soil fertility, and vegetation density. This study provides valuable data to support mangrove rehabilitation efforts and the sustainable management of carbon stocks, contributing to climate change mitigation and the conservation of mangrove ecosystems.
Acknowledgments
This research was supported by the RIIM G-2 / 2022, LPDP Grant and BRIN, grant number (82/II.7/HK/2022). We also thanks to the Research Center for Conservation of Marine and Inland Water Resources, BRIN; Sumbawa Regency Government (PEMDA) and Faculty of Fisheries and Marine Sciences, IPB University.
References
- Aliviyanti D, Isdianto A, Asadi MA, Saputra DK, Kristanti FD, Haykal MF (2020). Composition and density of mangroves in the Momparang islands conservation area. Indonesian Journal of Conservation. 9(2): 63-67. https://doi.org/10.15294/ijc.v9i2.26547
- Dompu Marine and Fisheries Department (2009). Strategic Plan of the Marine and Fisheries Service of Dompu District 2010-2015. Dompu.
- Arifin T, Yulius Y, Ramdhan M, Johan O, Gunawan D P, Heriati A, Mustikasari E, Rahmania R, Purbani D, Dillenia I, Agus S B, Asaf R, Hatta M, Marzuki I, Akhwady R, Sufyan A, Fihrin H, Septiningsih E, Wahyono A, Athirah A (2025). Mariculture site selection based on water quality, cultivation and ecological condition. Global J. Environ. Sci. Manage., 11(1): 1-18. DOI: https://doi.org.10.22034/gjesm.2025.01.08
- Comley BWT, McGuinness KA (2005). Aboveand below-ground biomass, and allometry, of four common northern Australian mangroves. Australian Journal of Botany. 53(5):431-436. DOI: https://doi.org/10.1071/BT04162
- Clough BF, Scott K (1989). Allometric relationships for estimating above-ground biomass in six mangrove species. Forest ecology and management. 27(2):117–127. DOI: https://doi.org/10.1016/0378-1127(89)90034-0
- [IPCC] The Intergovernmental Panel on Climate Change (2014). Supplement to the 2006 IPCC Guidelines for National Greenhouse Gas Inventories: Wetlands: Methodological Guidance on Lands with Wet and Drained Soils, And Constructed Wetlands For Wastewater Treatment.
- [IUCN] The International Union for Conservation of Nature is an international organization working in the field of nature conservation and sustainable use of natural resources. Founded in 1948. http://www.ipcc-nggip.iges.or.jp
- Jenerowicz, A., Kaczyński, R., Siok, K., Palkiewicz, K (2019). Change detection of urban area based on multisensor imagery. , 11157, 111570N - 111570N-7. DOI: https://doi.org/10.1117/12.2533379.
- Kauffman JB, Cole TG (2010). Micronesian mangrove forest structure and tree responses to a severe typhoon. Wetlands. 30(6):1077–1084. DOI: https://doi.org/10.1007/s13157-010-0114-y
- Kauffman JB, Donato DC (2012). Protocols for the measurement, monitoring and reporting of structure, biomass and carbon stocks in mangrove forests (Vol.86). Bogor(ID): CIFOR.
- Kangkuso A, Jamili J, Septiana A, Raya R, Sahidin I, Rianse U, Rahim S, Alfirman A, Sharma S, Nadaoka K (2016). Allometric models and aboveground biomass of Lumnitzera racemosa Willd forest in RawaAopaWatumohai National Park, Southeast Sulawesi, Indonesia. Forest Science and Technology. 12(1):43–50. DOI: https://doi.org/10.1016/j.gecco.2018.e00417
- Kangkuso A, Sharma S, Jamili J, Septiana A, Sahidin I, Rianse U, Rahim S, Nadaoka K (2018). Trends in allometric models and aboveground biomass of family Rhizophoraceae mangroves in the Coral Triangle ecoregion, Southeast Sulawesi, Indonesia. Journal of Sustainable Forestry. 37(7):691- 711. DOI: https://doi.org/10.1080/10549811.2018.1453843
- Kepel TL, Suryono DD, Ati RN, Salim HL, Hutahean A (2017). Importance and economic value estimation of mangrove vegetation carbon stocks in Kema, North Sulawesi. National Marine Journal. 12(1): 19-26. DOI: https://doi.org/10.15578/jkn.v12i1.6170
- Decree of the Minister of Marine Affairs and Fisheries Number 20/KEPMEN-KP/2020 (2020) concerning Marine Protected Areas of Liang Island, Ngali Island, and Their Surrounding Waters in West Nusa Tenggara Province.
- Komiyama A, Poungparn S, Kato S (2005). Common allometric equations for estimating the tree weight of mangroves. Journal of Tropical Ecology. 21(4):471–477. DOI: https://doi.org/10.1017/S0266467405002476
- Materne A, Gili B, Laubier D, dan Gimenez, T (2001). Quadrilinear CCD sensors for the multispectral channel of spaceborne imagers. , 4540. DOI: https://doi.org/10.1117/12.450673.
- Muharam (2014). Mangrove Planting as an Effort to Rehabilitate Land and Environment in the North Coastal Area of Karawang Regency. Scientific Journal of Solutions, 1(1): 1-14.
- Ong JE, Gong WK, Wong CH (2004). Allometry and partitioning of the mangrove, Rhizophora apiculata. Forest Ecology and Management. 188(1-3):395–408. DOI: https://doi.org/10.1016/j.foreco.2003.08.002
- Regulation of the Minister of Forestry of the Republic of Indonesia No. P.35/Menhut-II/2010 on the Amendment to the Regulation of the Minister of Forestry No. P.32/Menhut-II/2009 on the Procedures for the Preparation of Technical Plans for Forest and Land Rehabilitation in Watersheds (RTRHL-DAS).
- Pham T, Yokoya N, Bui D, Yoshino K, Friess D (2019). Remote Sensing Approaches for Monitoring Mangrove Species, Structure, and Biomass: Opportunities and Challenges. Remote. Sens., 11: 230. DOI: https://doi.org/10.3390/rs11030230.
- Rahmawati S, Irawan A, Supriyadi I H, Azkab MH (2014). Seagrass monitoring guidelines. In M. Hutomo& A. Nontji (Ed.). First Edition. COREMAP-CTI. Indonesian Institute of Sciences. Main Communication Facilities. Bogor. Viii, 37hlm.
- Saenger P dan Snedaker SC (1993). Pantropical trends in mangrove above-ground biomass and annual literfall. Oecologia. 9(3): 99-293. DOI: https://doi.org/10.1007/BF00317496
- Satria H, Mujiyanto (2011). Reef fish community structure in artificial reef sites in Saleh Bay Waters, West Nusa Tenggara. Proceedings of the National Forum on Fish Stocks III: Stability of Fish Production. Cooperation of BP2KSI, FPIK, UNPAD, LIPI and MII. October 18, 2011. Pp. KSI-10. 1-16 pp. DOI: https://doi.org/10.12962/j25481479.v9i3.21512
- Yulius, Heriati A, Mustikasari E, Zahara RI (2017). Tidal and wave characteristics in the waters of Saleh Bay, West Nusa Tenggara. J Segara. 13(1):65–73. DOI: https://doi.org/10.15578/segara.v13i1.6423.
- Yulianto I., Kartawijaya, T., Rafandi, M.T Agustina, S., Pingkan, J. Nurjamil, A., Sabariyono, Widodo, Ramadhan R. Hilyana, S (2016). Profile of capture fisheries in Saleh Bay and Cempi Bay, West Nusa Tenggara Province. Marine and Fisheries Service of West Nusa Tenggara Province and Wildlife Conservation Society Indonesia. Bogor. DOI: https://doi.org/10.9734/ajfar/2020/v9i230156