Estimating tourism’ social carrying capacity from the perspective of residents’ and tourists: The case of Pari Islands, Jakarta Capital Province, Indonesia
Abstract
The concept of tourism carrying capacity (TCC) has increasingly been used as a solution to the challenges of tourism development and growth, particularly in the case of small islands. However, social aspects have not been sufficiently emphasized in TCC assessment. This paper aims to assess the social carrying capacity in small island tourism, using the Pari Islands in Jakarta, the capital of Indonesia, as a case study. Social carrying capacity was estimated using a management and experience perspective approach of local residents and tourists. The perception of positive impacts from tourists and local residents indicates that tourism on Pari Island has yet to reach the limit of its social carrying capacity, with an accepted standard tourism density of 52 people per ha. Efforts, however, are still needed to improve sustainable tourism management on these islands, one of which is through a quota system. This paper is expected to strengthen tourism management strategies, especially in national tourism strategic areas.
Keywords
social carrying capacity, small islands tourism, quota system, Pari islands
1. Introduction
Amidst the rapidly growing tourism industry over the past few years (WTTC, 2023), inadequate mobilization of tourists in large numbers and overcrowded situations can negatively impact environmental quality (Baloch et al., 2023). Tourist arrivals exceeding capacity would pose issues such as natural resources exhaustion, waste build-up, soil erosion, and air pollution, as well as posing a threat to biological, social, and cultural diversity (Andlib and Salcedo-Castro, 2021; Shaheen et al., 2019; Stefănica and Butnaru, 2015). In the context of small islands, the growth of tourism and the high intensity of tourist activities can threaten their fragile ecosystems (Zhang et al., 2023). Tourism on small islands is a “double-edged sword”, on the one hand providing significant economic benefits, while on the other hand creating local vulnerabilities due to the aforementioned threats (Hampton and Jeyacheya, 2020). Sustainability principles are, therefore, crucial in the context of small islands (Adrianto and Matsuda, 2002; Kurniawan et al., 2019).
The concept of tourism carrying capacity has become one way to address sustainable tourism on small islands (Yusoh et al., 2021). Tourism carrying capacity (from here onwards abbreviated as TCC) is described as the maximum number of people that can visit a tourist destination and feel satisfied without damaging the physical, economic, and socio-cultural environment (UNWTO, 2019). Multiple studies recommended the development of a tourism destination for not exceeding its TCC (Lone et al., 2013; Malik and Bhat, 2015; Sayan and Atik, 2011), some even consider it critical due to its role in facilitating communication between tourism operators and stakeholders (Jurado et al., 2013; Ma et al., 2017; Sousa et al., 2017; Zelenka and Kacetl, 2014).
Currently, TCC assessments are becoming more comprehensive, covering a holistic and technocratic approach with increasingly complex variables (Adrianto et al., 2021). However, social aspects are still not emphasized enough in assessing TCC of a tourist destination. This is even though the perspectives of tourists and local residents cover critical issues in tourism density and quality, as well as the fact that interactions between tourists and local residents touch on issues around the quality of life for local residents (Yusoh et al., 2021). Saveriades (2000) describes this ‘blind spot’ as social carrying capacity, namely "the maximum level of use (in terms of numbers and activities) that can be absorbed by an area without an unacceptable decline in the quality of experience of visitors and without an unacceptable adverse impact on the society of the area”. The phenomenon of overtourism occurs when the number of tourists in a destination exceeds its social carrying capacity (UNWTO, 2019).
Although the social carrying capacity framework has been applied in managing tourism impacts and overcrowding issues in tourist destinations, its application in tourism destination management is relatively new (Xiao et al., 2023). Tourist destinations are looking for new methods that can be easily applied to identify and measure social carrying capacity before overtourism occurs (Peeters et al., 2018). Social carrying capacity needs to be expanded by integrating and considering various indicators of social carrying capacity, for example quality of life, satisfaction, and others. A study from Tokarchuk et al. (2021), for instance, measured social carrying capacity through the perceived impacts of tourism on residents’ lives, as well as the inclusion on satisfaction of life. Social carrying capacity is also associated with multiple factors, such as visitors’ motivations, experience use history, socio-demographic factors, characters of encounters, situation factor, multiple emotion variables, and extension to integrate novel methods and diverse indicators such as quality of life and satisfaction (Xiao et al., 2023).
This paper aims to fill the gap of tourism study, in particular to estimate social TCC by integrating the perspectives of local residents and tourists. Social TCC is usually seen from the perspective of tourist’s satisfaction alone, using indicators based on the number of tourists who are satisfied or dissatisfied (Choi and Sirakaya, 2006; Coccossis et al., 2001). However, the concept of tourist’s satisfaction level and service quality is very broad, and more accurate indicators are needed to measure its carrying capacity (Yusoh et al., 2021). In determining social carrying capacity, both tourists and local residents must be equally acknowledged (Kakazu, 2008; Marzetti and Mosetti, 2005; Saveriades, 2000). In addition, to determine tourism’s social carrying capacity, there are two components that need to be looked at: (1) the quality of the visitor’s experience that can be accepted before looking for alternative destinations, and (2) the level of tolerance of local residents towards the presence of tourists (Saveriades, 2000).
With that particular background, the objectives of this research are (1) to identify the motivation, level of interest and satisfaction of tourists as well as the attitudes of local residents towards tourism; (2) to examine the relationship between tourists and local residents; and (3) to investigate the extent to which tourism erodes social order and encourages anti-social behavior. The perception of positive impacts from tourists and local residents is an indicator that a particular destination has yet to reach the limit of its social carrying capacity (Saveriades, 2000).
As one of the small islands in Jakarta, Pari Islands offers an actual case study that depicts the status of social TCC on small islands. As part of the Seribu Islands, which has been designated as one of the national tourism strategic areas through Government Regulation Number 50 of 2011, ensuring that tourism activities on Pari Island are managed professionally, including the consideration of the social carrying capacity, will be a critical pathway towards sustainable tourism development.
2. Methods
2.1. Study site
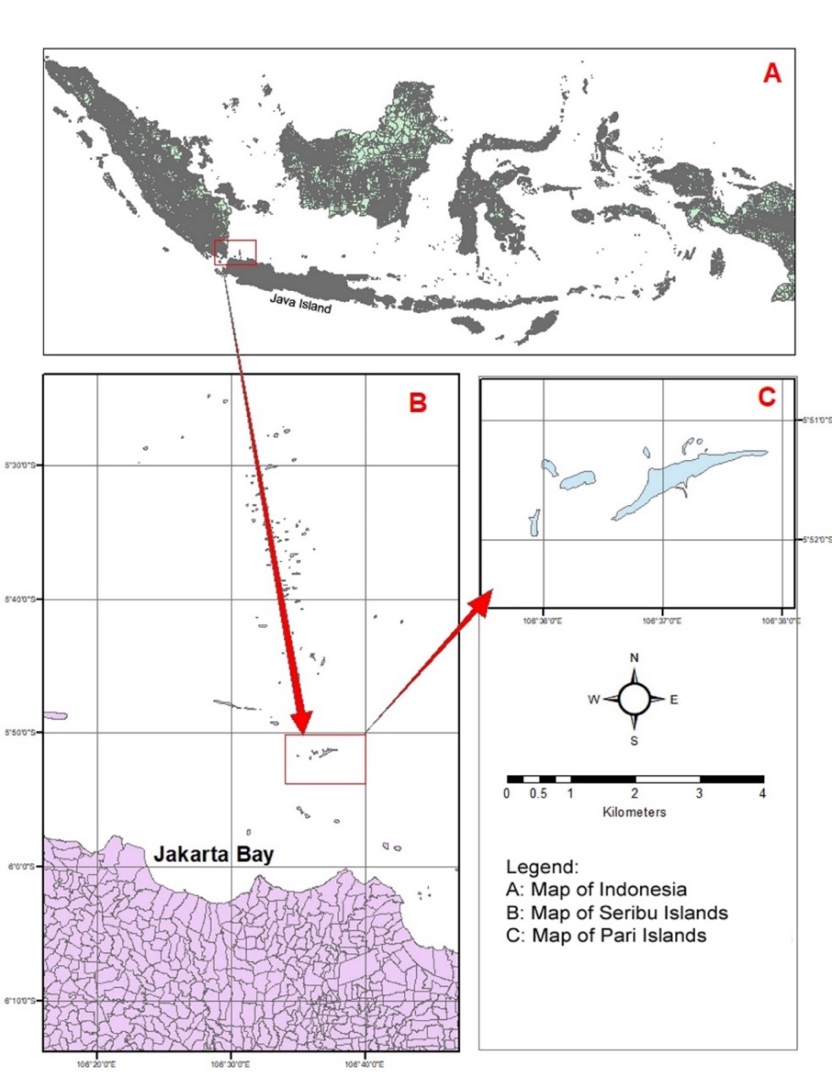
Pari Island is a group of islands consisting of small islands that are part of the Seribu Islands region (Fig. 1). The Pari Islands are located in the north of Jakarta Bay and are administratively part of the Southern Seribu Islands District, Seribu Islands Administrative Regency, Special Capital Region of Jakarta Province. A popular tourist attraction on this island is Pasir Perawan Beach, which offers various tourist activities. The small islands in the Pari Island group include Burung, Tikus, Tengah, Kongsi, Kudus and Pari Islands, with Pari being the largest among the six, consisting of an area of 41.32 ha and is the only residential island. The population reaches 1,423 people in 2022, an increase of 32% compared to 2017. Since 2010, tourism has grown with the support of local residents looking for alternative livelihoods amidst the decreasing seaweed production. Based on data from the Seribu Islands Tourism and Creative Economy Department (Table 1), the number of tourists visiting Pari Island in 2023 was recorded at 89,986 people, an increase of 44.98% compared to 2022, with the peak tourism season occurring around June, July, and December. The peak days for tourist visits to Pari Island are generally Saturdays and Sundays.
| Month | Year | ||
|---|---|---|---|
| 2021 | 2022 | 2023 | |
| Jan | 5,877 | 3,085 | 3,312 |
| Feb | 6,775 | 1,762 | 3,544 |
| Mar | 3,600 | 2,479 | 3,982 |
| Apr | 2,247 | 1,775 | 9,708 |
| May | 4,193 | 13,146 | 5,980 |
| Jun | 1,878 | 7,220 | 10,461 |
| Jul | 155 | 8,652 | 10,992 |
| Aug | 0* | 6,167 | 8,146 |
| Sept | 0* | 5,357 | 8,625 |
| Oct | 794 | 4,383 | 7,497 |
| Nov | 2,385 | 3,725 | 7,321 |
| Dec | 2,627 | 4,318 | 10,418 |
| Total | 30,531 | 62,069 | 89,986 |
2.2. Data collection
To assess the perceptions of local residents and tourists, a structured questionnaire survey was conducted among the two groups. The local population survey was conducted in July and August 2021. A group of trained local residents went to households to ask the questions listed in the questionnaire to the head of the household or other representative family members. The enumerator wrote the responses, and the census method was used to collect questionnaires from the population. However, due to the social restriction policy due to the COVID-19 pandemic and some residents being in self-quarantine, only 317 questionnaires from 421 heads of households on Pari Island were collected and then retained for final analysis.
The survey for the tourist group was conducted on weekends in crowded tourist conditions, namely the 2nd and 3rd weeks of July 2022. Enumerators were dispatched at Pasir Perawan Beach, the harbor, homestays or other areas on Pari Island to approach tourists. This survey uses a convenience sampling technique to collect questionnaires from tourists. A survey link with a QR code was given to visitors, with which the respondents could complete the survey via their mobile devices. A total of 143 complete and valid questionnaires were collected and then retained for final analysis. There are, of course, some limitations with this survey strategy. Although clearly more efficient, convenience sampling often misses to represent the entire population as some tourists might not be readily accessible in the public area. The weekend survey would also miss representing some of the tourists that seek a more quiet time and have more flexibility. These limitations notwithstanding, we believe that the method could provide a strong overview of the tourist activities in the area.
Ethical clearance number 67/VII/2021 for the questionnaires was granted by the Ethics Clearance Committee, Indonesian Institute of Sciences. Before collecting data, research permission was obtained from the Rukun Warga (Resident Association, RW) 04 Pari Island office. Verbal consent was obtained from each respondent, both tourists and local residents.
The survey instrument referred to the work by Adrianto et al. (2021), in which the questionnaire for the local population consists of three main sections: socio-demographic characteristics, attitudes and perceptions of local residents toward tourism, and the level of satisfaction of local residents regarding various aspects of tourism on Pari Island. The questionnaire for the tourist group consists of three similar sections, with the second section focusing on tourist behavior and the third exploring tourists’ assessment of various aspects of tourism on Pari Island. This research questionnaire contains closed questions using a categorical scale (for example, yes/no) and a 5-point Likert scale, as modified from Manning (2011). Before conducting the analysis, Cronbach's alpha was used to test the validity and reliability of the questionnaire (Taber, 2018; Tavakol and Dennick, 2011), showing that the questionnaire was valid and reliable.
2.3. Data analysis
The collected data were processed using SPSS statistics software and Microsoft Excel, which were then elaborated with descriptive statistical analysis. Graphs were made with the R statistical program (R Core Team, 2024) with the library ggstats (Larmarange, 2024). To analyze tourists' and local residents' assessments of tourism, the mean and standard deviation for each statement were used, which were obtained using equations (1) and (2) as in previous research (Smith and Pinkerton, 2021; Timothy and Said, 2023):
\[\bar{x} = \frac{\sum x_i}{N}\]
\[ SD = \sqrt{ \frac{ \sum (x_i - \bar{x})^2 }{ N - 1 } } \]
Where, \(x_i\) = number of respondents who selected the it response; \(N\) = total number of respondents.
The approach to the level of satisfaction and encounter acceptability was assessed to estimate the social carrying capacity (Adrianto et al., 2021). Sustainability will be achieved if conditions are at or below carrying capacity (Rey-Valette et al., 2007). When usage levels exceed these standards, a perception of overcrowding will occur and management strategies will need to be implemented to maintain the quality of the visitor experience (Xiao et al., 2023).
3. Results
3.1. Profile of respondents
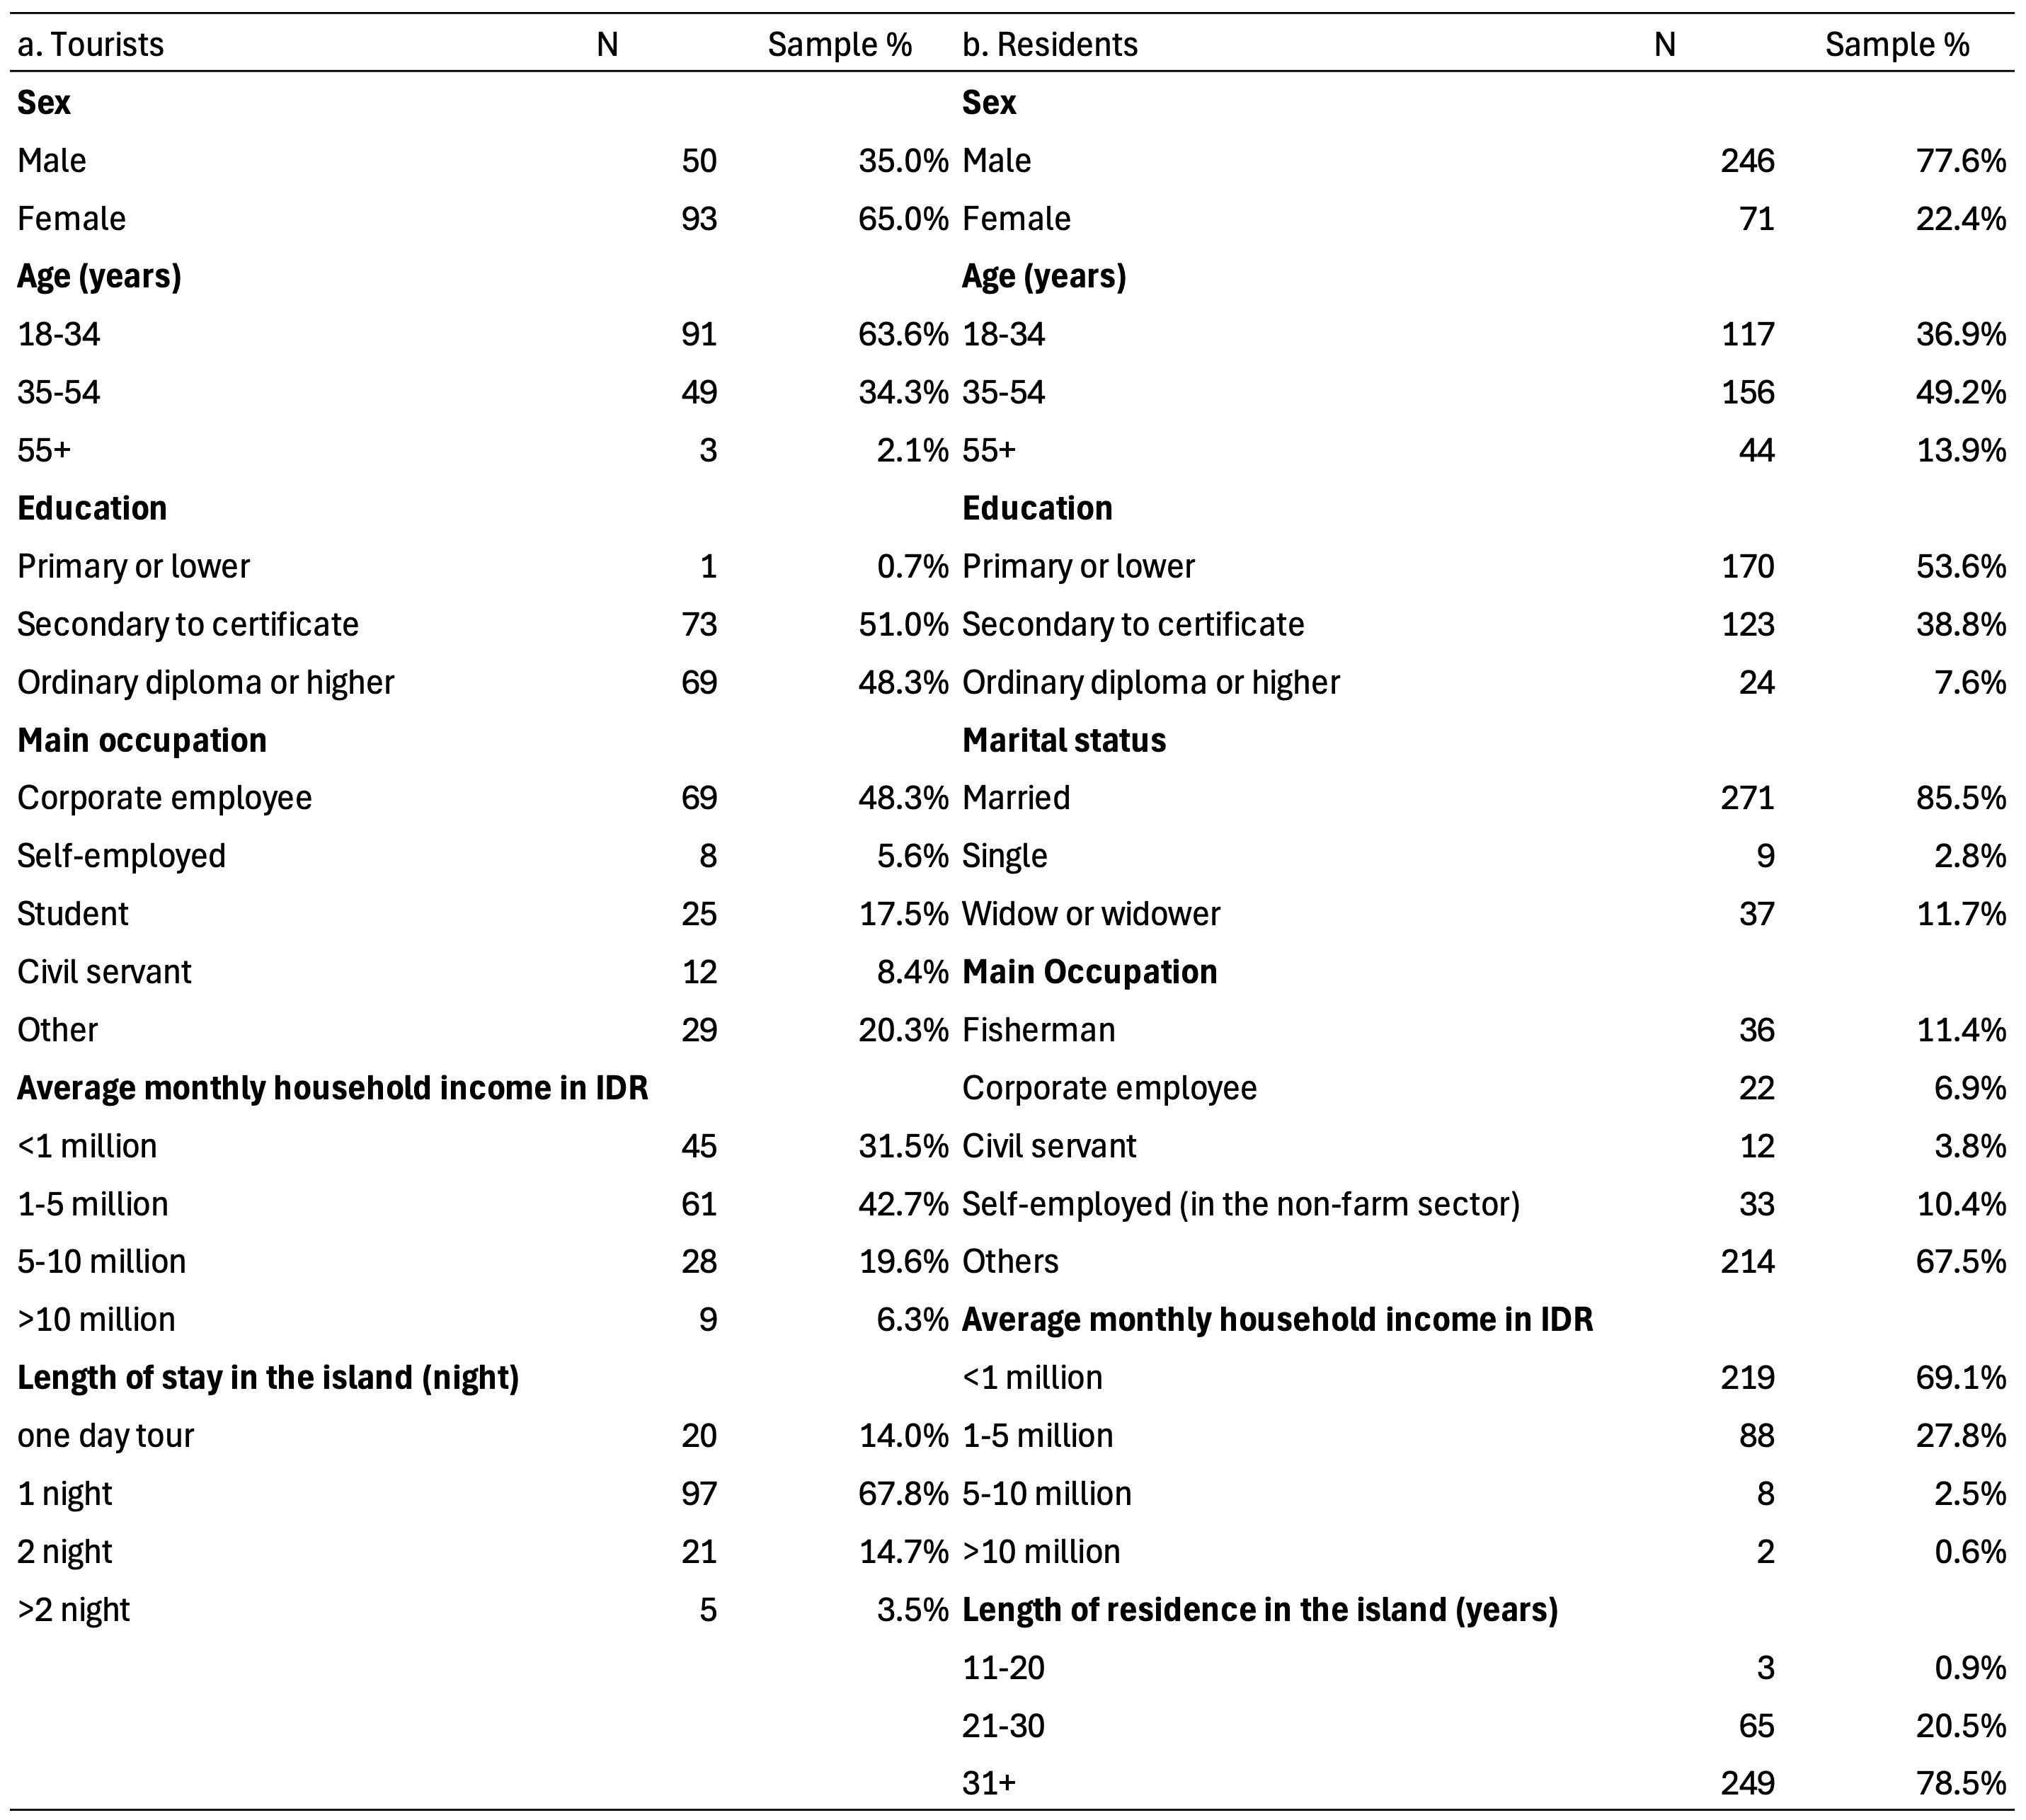
From the questionnaire results (Fig. 2), we identified subtle differences between the tourists and local population in terms of age range, education level, sources of income, and average monthly household income. Tourist respondents were more varied in age, with the majority between the age of 18 and 34 years old. The local population, on the other hand, were mostly between 35-54 years old. The majority of tourists were employees (48.3%), and earned an average monthly income of 1-5 million rupiah (42.7%). The local population consist mostly of fishermen (11.4%) and entrepreneurs in non-fishing sector (10.4%), with an overwhelming majority having an average monthly income of less than 1 million rupiah (69.1%). Most respondents have lived in the study area for over 31 years (78.5%, n=249). We also notice that most tourist respondents travelled and stayed in the research area overnight (67.8%, n=97). There were 20 respondents who followed a one-day tour to Pari Islands. This difference in length of stay (i.e., between overnight and day visitors), as we have noticed, also relates to how tourists perceive Pari Islands tourism (see also, e.g., Canavan, 2013), as will be explored in the following sections.
3.2. Tourist perception
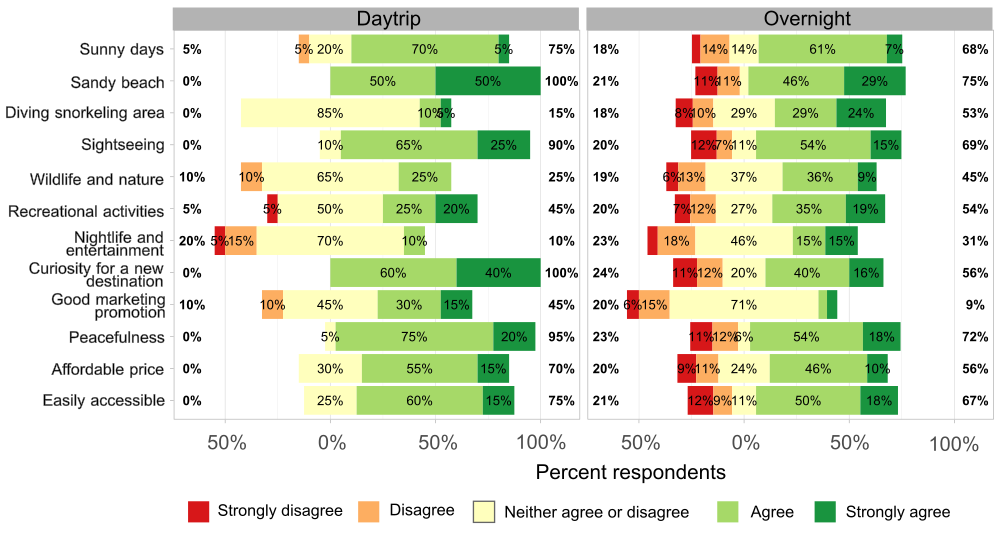
The majority of tourist respondents believe that their main motivation for coming to Pari Island is because of the sandy beach (mean = 3.83), sightseeing (mean = 3.61), peacefulness (mean = 3.60), easily accessible (mean = 3.57), and sunny days (mean = 3.57). These factors have a very significant relationship with tourists’ motivation for visiting (p<0.05). When we look at the difference between daytrip and overnight visitors (Fig. 3), overnight visitors have more negative tones in overall motivation categories, especially concerning good marketing. Meanwhile, the most negative motivation response in daytrip was nighttime and entertainment. Overall, daytrip visitors are more motivated by various reasons, mainly due to their curiosity for a new destination, the presence of sandy beaches, and economic reasons (e.g., price and easily accessible).
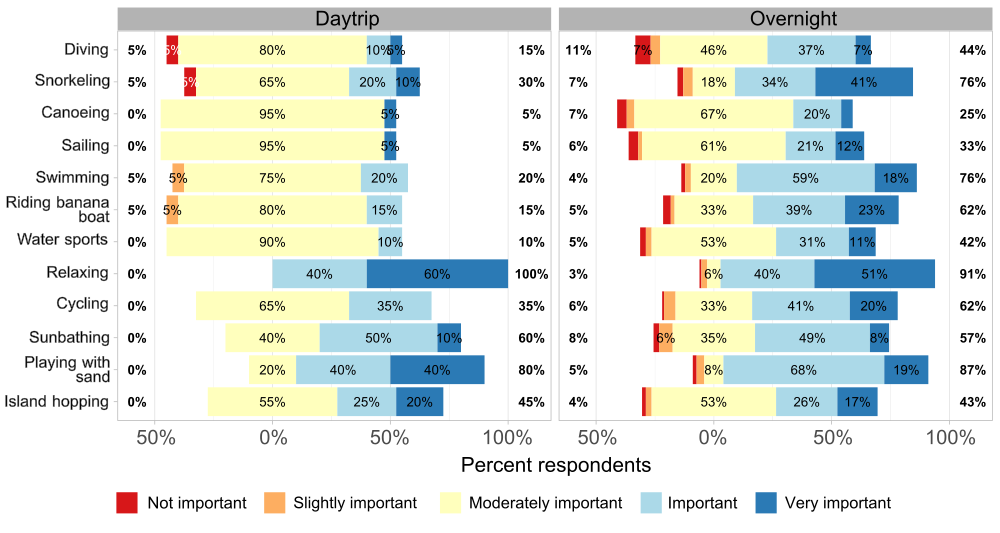
All tourists consider that relaxing and playing with sand on the beach are essential tourist attractions during a trip to Pari Island, with mean values of 4.41 and 4.02, respectively, followed by snorkeling (mean = 3.97), swimming (mean = 3.78), and cycling (mean = 3.70). For day trip visitors, simpler activities such as playing with sand and relaxing are considered important, whereas for overnight visitors, relaxing and snorkeling are two of the most important activities (Fig. 4).
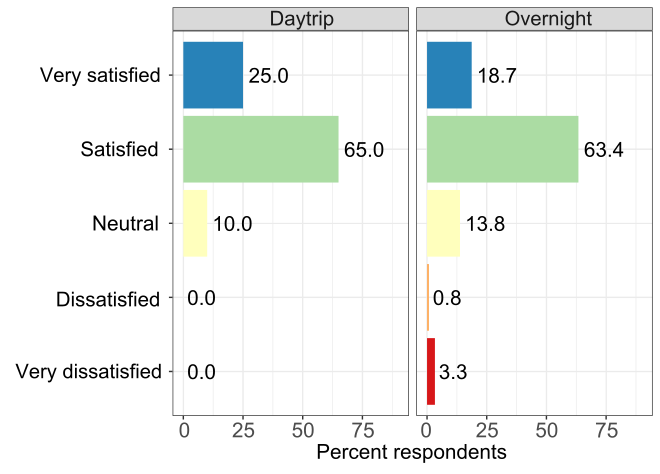
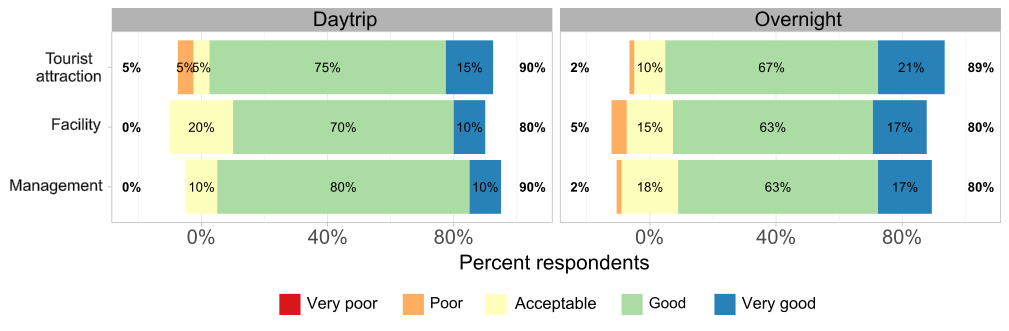
The survey results also show that the majority of tourists during their visit to Pari Island obtained satisfaction as expected, both for the day trip and overnight visitors (Fig. 5a). However, there are still tourists who cannot receive the anticipated satisfaction both in terms of objects, facilities and tourism management (Fig. 5b), thus affecting tourists' willingness to return to the Pari Islands. Based on the survey results, around 10% of tourists do not want to return to the Pari Islands, and 36% are unsure. This percentage could demonstrate a potential economic loss.
3.3. Attitudes of residents toward tourism
The socio-economic impact of tourism manifests in the economic and social benefits or costs that arise or are incurred by residents as a result of tourism development (Charag et al., 2021; Ngowi and Jani, 2018). Positive socio-economic impacts include the emergence of entrepreneurial opportunities, job creation, increased wage levels, population income, standard of living and population access to basic services (Cardoso and Silva, 2018; Charag et al., 2021; Gonzalez et al., 2018; Hammad et al., 2017; Muganda et al., 2010; Ngowi and Jani, 2018; Nguyen, 2022; Rasoolimanesh and Jaafar, 2016; Wu et al., 2020). A similar situation was also seen in the socio-economic impact of tourism felt by most Pari Island residents (Fig. 6), where they often expressed it in their daily conversation: "tourism is changing the economy of the people of Pari Island"; "tourism generates money, especially since we no longer cultivate seaweed", and "tourism makes the population more prosperous".
The survey results (Fig. 6) showed that the majority of resident respondents (84.9%, n=269) admitted that tourism on Pari Island reduced the unemployment rate by creating various new businesses and job opportunities. Most residents (84.2%, n=267) stated that tourism increased job opportunities, including tour operators, tour guides, and opening businesses for multiple renting services of homestays, boats, snorkeling equipment, and bicycles. It also impacted wage levels and, ultimately, the income of Pari Island’s residents. Indeed, most residents (53%, n=168) admitted that wage levels had increased since the introduction of tourism on Pari Island and positively impacted the income of Pari Island residents (89.6%, n=284). The positive impact of tourism on the socio-economic aspects above has a multiplier effect on the standard of living of the residents of Pari Island. Most residents (86.1%, n=273) admitted that their quality of life improved with the integration of the tourism sector.
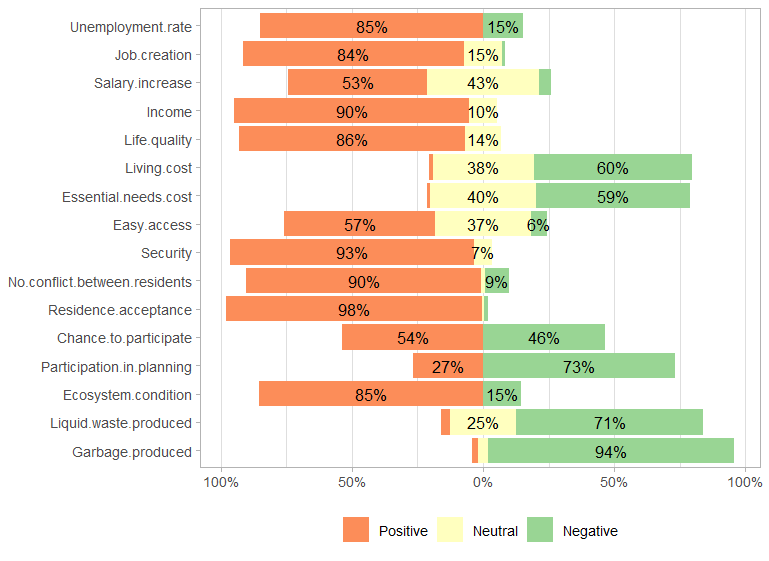
Just as tourism development is considered to increase the income of local communities, it is also considered to pose negative impacts as it increases the cost of living (Hammad et al., 2017; Nguyen, 2022; Rasoolimanesh and Jaafar, 2016; Wu et al., 2020). Most residents of Pari Island feel the cost of living has increased due to tourism. Most resident respondents (60.3%, n=191) admitted that the cost of living increased with tourism on this island. According to them, the increase in the cost of living was due to increased prices of goods triggered by increased demand for basic needs (such as drinks, staple foods, and side dishes), especially during the peak season with abundant tourists. The increase in the cost of living was recognized by most resident respondents (58.7%, n=186).
The socio-economic impact of tourism was also apparent from the increasing access to various basic services. Most residents agreed that tourism is vital for Pari Island residents to access basic facilities/services such as transportation, education, health, and clean water. Massive development of basic infrastructures has occurred over the last decade, along with tourism development on this island. The survey results showed that most residents (57.4%, n=182) stated they have easy access to several facilities built due to tourism. Infrastructure development of road maintenance, communal waste channels, optimizing reverse osmosis water installations, handling cleanliness, and waste management are considered very beneficial for local residents.
Tourism development impacted socio-cultural aspects, especially changes in community norms and values (Kibicho, 2005; Saarinen and Manwa, 2008). The negative impacts of tourism on socio-culture include the influx of tourists into local communities, the decline of traditional culture, morality, and community values, as well as the increase in crime and other social problems due to tourism development (Charag et al., 2021; Hammad et al., 2017; Gonzalez et al., 2018; Nguyen, 2022; Rasoolimanesh and Jaafar, 2016; Wu et al., 2020). Tourism on Pari Island is not yet considered to have an impact on the socio-cultural aspects of the community. The survey results showed that most residents (93.0%, n=295) felt that Pari Island was safe, even with tourism. Likewise, most residents (89.6%, n=284) stated that there had been no conflicts between Pari Island residents due to tourism. Other findings showed that residents did not feel like strangers on their island. Most of the resident respondents felt accepted as part of the community (97.8%, n=310) with the opportunity to participate in various decision-making in the community (53.6%, n=170), although only few were involved in the planning process (26.8%, n=85).
In terms of the environment, the positive impacts of tourism relate to the increasing environmental awareness of the population in promoting the conservation of natural resources (Charag et al., 2021; Hammad et al., 2017; Ngowi and Jani, 2018; Nguyen, 2022; Wu et al., 2020). However, tourism also negatively impact the environment through deforestation and increased land and water pollution due to development (Charag et al., 2021; Gonzalez et al., 2018; Hammad et al., 2017; Ngowi and Jani, 2018; Nguyen, 2022; Rasoolimanesh and Jaafar, 2016; Wu et al., 2020). In that regard, the majority of resident respondents (85.5%, n=271) felt that the condition of the ecosystem, marine resources and environment on Pari Island was still in good condition. Only 14.5% (n=46) considered Pari Island's environment in bad condition, and 58.7% of the 46 respondents thought that tourism activities were the cause of this condition. However, most residents started to see an increase in solid waste (93.7%, n=297) and wastewater in their environment (71.3%, n=226) due to tourism.
Although the negative impact of tourism on the condition of the ecosystem, marine resources, and the environment has not been widely recognized by local residents, the existence of tourism on Pari Island has encouraged an increase in their awareness of the importance of conservation efforts for tourist attractions and the environment on Pari Island. The survey results show that most residents (99.4%, n=315) were aware of the need for conservation efforts for tourist attractions and the environment on Pari Island due to the negative impacts of tourism. Furthermore, most residents (91.5%, n=290) also stated their willingness to be involved in conservation efforts.
3.4. The tourist-host inter-relationship
Tourism sector involves direct and indirect relationships between tourists and residents (Timothy and Said, 2023). The findings from this study (Fig. 6) indicate that enthusiasm describes the feelings of the majority of the population. All resident respondents (100%, n=317) supported tourism on Pari Island. The majority of resident respondents (93.4%, n=296) did not feel that tourism had disturbed their daily lives. Furthermore, most residents (80.4%, n=255) mentioned harmonious interactions with tourists. Through an adaptation process of more than a decade, the community has become accustomed to the presence of tourists. The impression of good interaction between residents and tourists was also recognized by most tourist respondents (93.0%, n=133).
3.5. The effects of tourism on social behaviour and values
Tourism is widely recognized as a sector that can cause changes in lifestyle, traditions, social behavior, and moral values, especially in the younger generation. In many cases, the younger generation adopts values about sex, clothing, and morality that are very different from traditional values (Saveriades, 2000). Observations at the research site showed no significant changes in the traditions and social behavior of the people of Pari Island. However, changes in the lifestyle of some Pari Island residents started to appear due to increasing income from businesses in the tourism sector. Most residents used income from the tourism sector to renovate their houses into permanent buildings, including equipping them with electronic equipment such as televisions, washing machines, and air conditioners (AC). In the past, before the development of tourism on Pari Island, most of the residents' houses were non-permanent buildings (with house walls made of woven bamboo) to semi-permanent (with part of the house walls made of walls and the rest still retaining woven bamboo), including not many housings used air conditioning.
The traditional values of the Pari Island’s communities have not been much affected by tourism. The diversity of ethnic origins causes the culture and traditions of the people of Pari Island to be quite heterogeneous. However, its location close to Jakarta and Banten means that the culture and traditions of the people are dominated by Betawi and Sundanese culture, both of which are heavily influenced by Islamic values. An interview with the Head of Resident Association (RW) 04 Pari Island revealed that tourism development on Pari Island has not significantly eroded the traditional values of the community. However, according to him, the local’s engagement in mutual cooperation activities decreased, especially when coinciding with periods of relatively high tourist visits.
3.6. Social TCC
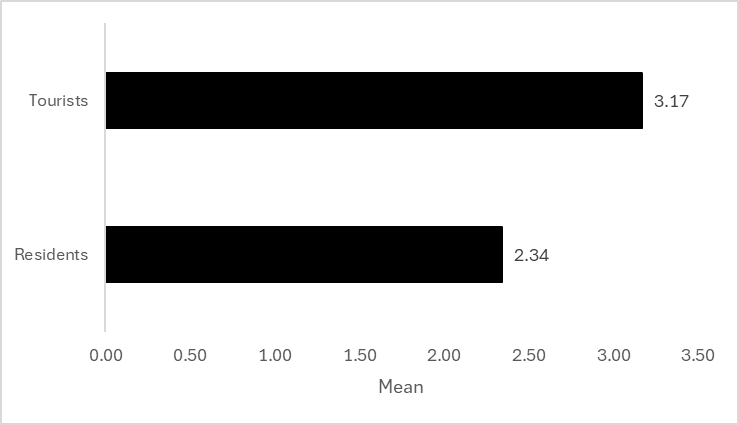
Social TCC in this research used a management and experience perspective approach (Adrianto et al., 2021; Utami and Maheswari, 2021; Yusoh et al., 2021). The management perspective is the result of a cumulative assessment of local residents as service providers and tourism operators regarding tourism development for more than a decade on Pari Island, while the experience perspective is the result of tourists' assessments when they visited this island. Both local residents and tourists were asked to assess the tourism conditions on Pari Island using a Likert point scale where "1" represented very dense, "2" represented dense, "3" represented fair/moderate, "4" represented not crowded, and "5" represented very not crowded. Based on the mean value of the two groups and adapting the determination of the Likert scale value of previous research (Smith and Pinkerton, 2021; Timothy and Said, 2023), both local residents and tourists tend to state that the level of tourism density on Pari Island is within the category of fair/moderate conditions (Fig. 7).
Based on the data of the visitors’ number in July 2022 (as a proxy for visitation level data when collecting tourist perception data), the average number of visitors was 8,625 visitors per month or 2,163 visitors per week (assuming there are four weeks in one month), which will be the standard conditions of acceptable density levels. Based on the perception data analysis and considering Pari Island’s total area of 41.32 ha, the acceptable level of social carrying capacity on the island is 52 visitors per hectare. This finding is not much different from the findings of Adrianto et al. (2021) on Tidung Island, where the acceptable level of social CC ranges from 25 to 75 visitors per hectare, with the highest acceptance level being 50 visitors per hectare. Referring to the Decree of the Governor of DKI Jakarta Number 1592 of 1991 concerning the function of Pari Island that stated 50% of the area (20.66 ha) was allowed for tourism, the number of tourists that can be received on this island is 4,296 visitors per month or 1,074 visitors per week.
4. Discussion
Based on the calculated value of social carrying capacity, the number of tourists in 2023 generally exceeds social carrying capacity monthly and weekly (Fig. 8), except from January to March. January to March are months with an average of 90% cloudy skies. January has the highest precipitation, averaging 25.4 days of rain with a rainfall level of 316 mm. January to March are also the windiest months of the year, with an average wind speed reaching 14.9 km/hour (Triyono et al., 2024b). Therefore, it is natural that the level of tourist visits to Pari Island is lower in that month compared to other months.
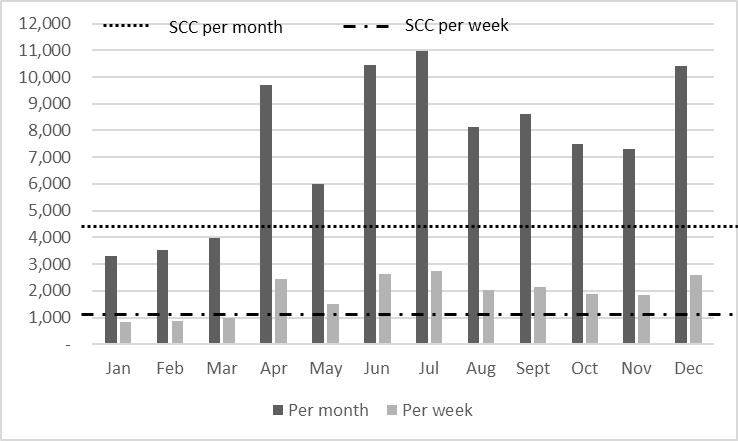
Tourist visits to Pari Island increased from April to December due to various factors. July, for example, was the brightest month of the year on Pari Island, where the sky was mostly clear and only 35% of the time was partly cloudy. August has the fewest wet days, averaging 6.6 days of rain and 46 mm of rainfall. March to December had the calmest winds of the year, while October had the strongest wind, averaging 10.2 km/hour (Triyono et al., 2024b). The nicer weather conditions may explain the high number of tourist visits to Pari Island during these months, which exceeds the social carrying capacity. On the other hand, periods when visitors exceed the social carrying capacity coincide with the school holidays, such as in June, July, and December.
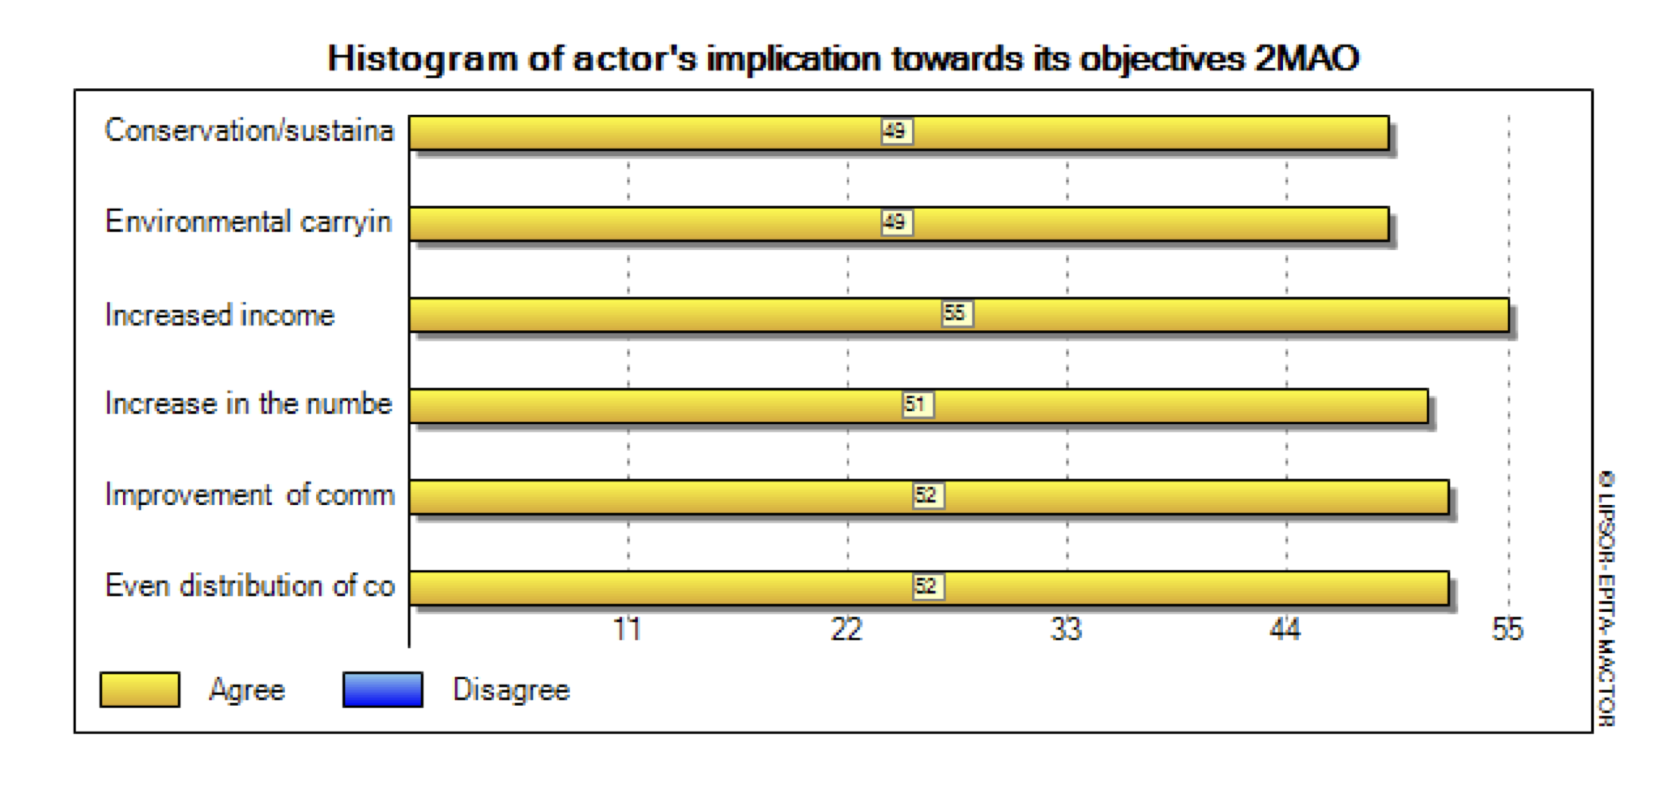
Currently, the number of visitors to Pari Island is not limited by any regulations. The findings from Triyono et al. (2023) showed that Pari Island residents preferred increasing their income as the goal of tourism development on this island (Fig. 9). Other findings from this study showed that residents’ opinions were evenly divided between those who want to increase tourist volume, community welfare, and equality. However, the finding of this study showed that conservation and environmental carrying capacity were less frequently chosen as the orientation of tourism development on Pari Island (Fig. 9).
The number of visitors exceeding social carrying capacity may impact the condition of coral reefs on Pari Island. Snorkeling, which is one of the important and mandatory activities on this island, causes high-intensity interaction between tourists and coral reefs, which may negatively impact the ecosystem. Most tourists have no experience interacting with coral reefs (97% of tourists without diving certificates), which can potentially harm the coral reef due to their lack of knowledge. Naufal et al. (2015) showed that tourism activities negatively impacted the percentage of coral cover on Pari Island, where the coral cover in tourism areas (42%-61%) was lower compared to non-tourism areas (73-75%). Apart from that, the total number of cases of coral disease, coral bleaching, and similar coral health problems were also found to be higher at stations within tourism locations. Another study from Khoirunnisa et al. (2023) showed that tourism is one of the sources of marine waste on Pari Island. The abundance of marine waste on Pari Island was estimated to reach 0.52 items/m2 and categorized as polluted.
The level of tourist’s visits that exceeds the social carrying capacity showed that Pari Island needs proper management efforts adjusted to the value of social carrying capacity, ecological conditions, and the island's vulnerability while also taking into account the impacts caused by tourism. Policy intervention is needed by reducing the number of tourists to prevent environmental damage (Nakajima and Ortega, 2016), for example, by implementing the quota system (Adrianto et al., 2021; Viñals et al., 2016). The value of social carrying capacity can be used as a basis for developing tourism management strategies on Pari Island. The value of social carrying capacity as a safe limit provides insights into the total number of visitors who can come while still maintaining visitor satisfaction and local residents as hosts who are still tolerant of the presence of tourists. However, the implementation of social carrying capacity will cause a decrease in income from the tourism sector, especially for the local communities, because the number of visitors simultaneously decreases due to restrictions from the quota system. Therefore, the application of the quota system must be carried out carefully. Similar to the case on Tidung Island (Adrianto et al., 2021), tourist visits can be distributed on weekdays, which are currently below the carrying capacity value, by offering various unique tourism programs that attract tourists, such as coral reef, seagrass, and mangroves conservation programs, in addition of engagement activities which involve tourists in long-term conservation programs such as adopting corals, planting mangroves and other activities. This will encourage tourists to return to Pari Island to see the growth of corals or mangroves in the future.
An inter-island integration program can also be carried out by directing tourists to disperse to the other surrounding islands in the Seribu Islands region while still promoting the tourist attractions on Pari Island. This strategy aims to prevent tourists from focusing on one particular island or tourist attraction. Policies in the form of directing tourist flows to other areas that have not yet exceeded the carrying capacity threshold will enable these areas to benefit from an increase in the number of tourists while reducing tension or social conflict in areas where tourists are concentrated (Tokarchuk et al., 2021).
Climate change impact on coastal and small islands’ tourism activities
To expand the discussion to a broader context, we need to understand that island sustainability in the context of tourism sector development should consider several environmental challenges in the future. One is related to the climate change impact on coastal ecosystems and small islands. Climate change has received an increased interest in the sustainable tourism literature, especially with the reliance of tourism activities on the natural environment, making the industry susceptible to the effects of climate change, such as through warming temperatures (Craig and Oxarart, 2024). The issue of climate change brings both threats and opportunities to the tourism industry, among others, in the form of threats from surface air temperature change, uncertainties in annual precipitation, frequent and severe storms, and vulnerability to sea-level rise (Dodds and Kelman, 2008).
Considering the severity of coastal damage to tourism and the vulnerability of tourism-dependent communities to climate change, important measures should therefore be considered to minimize the vulnerability and achieve long-term sustainable development (Mycoo, 2014). An alternative for developing sustainable tourism under various environmental challenges is by improving coastal management. Integrated Coastal Zone Management (ICZM) can assist in planning for adaptation to climate change, for example, in facilitating a response to concerns from the sea-level rise (Mycoo, 2014). Furthermore, the tourism industry needs to be more active in climate change mitigation (Craig and Oxarart, 2024). That being said, climate change, among other environmental issues, is often a lower priority compared to short-term economic gains and political battles (Dodds and Kelman, 2008). The limited level of awareness from tourism operators and decision-makers can influence such phenomenon. Therefore, developing an awareness program for relevant stakeholders will improve climate change adaptation and mitigation strategies (Sagoe-Addy and Addo, 2013).
Dodds and Kelman (2008) have highlighted that the issue of climate change in sustainable tourism policies can be addressed by (a) ensuring climate change policies are implemented, (b) improving education and awareness, (c) placing sustainable tourism within the broader policy frameworks, (d) economic incentives for climate change adaptation measures, and (e) participatory approaches for incorporating climate change in sustainable tourism policies. Various approaches to tackle the environmental challenges, such as climate change and sea-level rise, will be needed to ensure sustainable tourism in coastal ecosystems and small island settings, considering also other environmental threats in the future. For example, salinization and sanitation problems along the coastal regions can adversely affect tourism (Sagoe-Addy and Addo, 2013), while temperature increase can influence the health and safety of tourists, especially considering that travelers are often not acclimated to the conditions (Craig and Oxarart, 2024).
5. Conclusions and Recommendations
This research has provided evidence from Pari Island that the local residents feel positive benefits from the tourism sector. There is no evidence or facts from this research about the negative feelings of local residents towards the presence of tourists, including those who want to reduce the level of visits. That being said, tourism on Pari Island has not significantly caused changes in the traditions or social behavior of the community, even though the tourism sector has caused an increase in costs and lifestyle. However, this is considered unavoidable considering the economic benefits obtained by the population. The feeling of being accepted as part of tourism development and easy access to various basic facilities proves that local residents do not feel outcasts or feel that the presence of tourists/tourism hampers their lives. Travel experience also shows that tourists feel satisfaction during their visit.
Based on the perceptions of local people and tourists, our study has shown that tourism density is still reasonable for both groups. The perception of positive impacts from tourists and local residents is an indicator that tourism on Pari Island has not yet reached the limit of its social carrying capacity. However, this study has also calculated a proxy value of social carrying capacity as a threshold for the number of tourists that can be accepted on this island without reducing visitor satisfaction and causing detrimental social impacts on the local population. When referring to this value, the level of tourist visits to Pari Island in general has exceeded the threshold value.
As time progresses and the tourism volume increases, the findings of the carrying capacity value can be used to monitor tourism development in the context of optimal levels of tourist capacity to ensure its sustainability. However, this study only discusses one of the many elements of a region's carrying capacity, namely the social aspect. In order for a study to reflect the overall picture of a region, all capacity thresholds, i.e., physical, environmental, and economic, must also be studied. Therefore, a comprehensive carrying capacity study of a region must also cover these issues.
The success of a carrying capacity study depends on the ability to express carrying capacity in standard units that are clear and suitable for use in tourism planning and management. Therefore, further research is needed for the concept of carrying capacity to obtain an appropriate standard unit to express the carrying capacity of a destination in relation to tourist’s presence. Future investigations need to be carried out, especially comparing tourist destinations to explore the determining factors that influence the carrying capacity of different and varied tourist destinations.
Acknowledgments
The study was fully funded by The COREMAP-CTI Project 2021-2022 (17/A/DK/2021) with the project title of “Ketahanan Sumber Daya Air dan Lingkungan Pulau Pari Menuju Resilient Small Island”. The author thanks to the enumerators who have assisted in data collection: Sumiati, Diana Ningsih, Hanifa A. Putri, Tiswani, Salma N. Khairunissa, Rifqi U. Nikmah, and Khusniatul Ainiyah.
References
- Adrianto, L., Matsuda, Y., 2002. Developing economic vulnerability indices of environmental disasters in small island regions. Environ. Impact Assess. 22(4): 393–414. https://doi.org/10.1016/S0195-9255(02)00012-4.
- Adrianto, L., Kurniawan, F., Romadhon, A., Bengen, D. G., Sjafrie, N. D. M., Damar, A., Kleinertz, S., 2021. Assessing social-ecological system carrying capacity for urban small island tourism: The case of Tidung Islands, Jakarta Capital Province, Indonesia. Ocean Coast. Manage. 212: 105844. https://doi.org/10.1016/j.ocecoaman.2021.105844.
- Andlib, Z., Salcedo-Castro, J., 2021. The Impacts of Tourism and Governance on CO 2 Emissions in Selected South Asian Countries. Etikonomi. 20(2): 385–396. https://doi.org/10.15408/etk.v20i2.17499.
- Baloch, Q. B., Shah, S. N., Iqbal, N., Sheeraz, M., Asadullah, M., Mahar, S., Khan, A. U., 2023. Impact of tourism development upon environmental sustainability: a suggested framework for sustainable ecotourism. Environ. Sci. Pollut. R. 30(3): 5917–5930. https://doi.org/10.1007/s11356-022-22496-w.
- Canavan, B., 2013. The extent and role of domestic tourism in a small island: The case of the Isle of Man. J. Travel. Res. 52(3): 340-352. https://doi.org/10.1177/0047287512467700.
- Cardoso, C., Silva, M., 2018. Residents’ perceptions and attitudes towards future tourism development. Worldwide Hospitality and Tourism Themes. 10(6): 688–697. https://doi.org/10.1108/WHATT-07-2018-0048.
- Charag, A. H., Fazili, A. I., Bashir, I., 2021. Residents’ perception towards tourism impacts in Kashmir. International Journal of Tourism Cities. 7(3): 741–766. https://doi.org/10.1108/IJTC-11-2019-0202.
- Choi, H. C., Sirakaya, E., 2006. Sustainability indicators for managing community tourism. Tourism Manage. 27(6): 1274–1289. https://doi.org/10.1016/j.tourman.2005.05.018.
- Coccossis, H., Mexa, A., Collovini, A., Parpairis, A., Konstandoglou, M., 2001. Defining, measuring, and evaluating carrying capacity in European tourism destinations. University of the Aegean, Greece. https://www.ucm.es/data/cont/media/www/pag-49173/2001_CAPACIDAD%20DE%20CARGA_Uni%C3%B3n%20Europea_Informe%20COCCOSIS%20(informe).pdf (accessed 14 June 2024).
- Craig, C.A., Oxarart, R.A., 2024. The Sustainability of Island Tourism during Climate Change: The Case of Hawaii, United States. Sustainability. 16: 4680. https://doi.org/10.3390/su16114680.
- Dodds, R., Kelman, I., 2008. How climate change is considered in sustainable tourism policies: a case of the Mediterranean Islands of Malta and Mallorca. Tourism Review International. 12: 57—70. https://doi.org/10.3727/154427208785899920.
- Gonzalez, M. V., Coromina, L., Galí, N., 2018. Overtourism: residents’ perceptions of tourism impact as an indicator of resident social carrying capacity - case study of a Spanish heritage town. Tourism Review. 73(3): 277–296. https://doi.org/10.1108/TR-08-2017-0138.
- Hammad, N. M., Ahmad, S. Z., Papastathopoulos, A., 2017. Evaluating perceptions of residents’ towards impacts of tourism development in Emirates of Abu Dhabi, United Arab Emirates. Tourism Review. 72(4): 448–461. https://doi.org/10.1108/TR-03-2017-0046.
- Hampton, M. P., Jeyacheya, J., 2020. Tourism-Dependent Small Islands, Inclusive Growth, and the Blue Economy. One Earth. 2(1): 8–10. https://doi.org/10.1016/j.oneear.2019.12.017.
- Jurado, E. N., Damian, I. M., Fernández-Morales, A., 2013. Carrying capacity model applied in coastal destinations. Ann. Tourism. Res. 43: 1–19. https://doi.org/10.1016/j.annals.2013.03.005.
- Kakazu, H., 2008. Social carrying capacity for sustainable island tourism: The case of Okinawa. The Journal of Island Studies. 7: 53–88.
- Khoirunnisa, T. A., Riani, E., Cordova, M. R., 2023. Kelimpahan dan komposisi sampah laut terdampar di Pulau Pari, Kepulauan Seribu, DKI Jakarta. IPB University, Bogor.
- Kibicho, W., 2005. Impact of tourism development in Malindi an analysis of gender differences in perception. ASEAN Journal on Hospitality and Tourism. 4: 83–96.
- Kurniawan, F., Adrianto, L., Bengen, D. G., Prasetyo, L. B., 2019. The social-ecological status of small islands: An evaluation of island tourism destination management in Indonesia. Tourism Management Perspectives. 31: 136–144. https://doi.org/10.1016/j.tmp.2019.04.004.
- Larmarange, J., 2024. ggstats: Extension to 'ggplot2' for Plotting Stats. R package version 0.7.0, https://github.com/larmarange/ggstats (accessed 01 March 2025).
- Lone, S., Lone, F. A., Asif, M., 2013. Carrying capacity assessment for the promotion of ecotourism in Bangus Valley : a future tourist destination of J&K-India. International Journal of Scientific Research. 2(3): 187–188.
- Ma, P., Ye, G., Peng, X., Liu, J., Qi, J., Jia, S., 2017. Development of an index system for evaluation of ecological carrying capacity of marine ecosystems. Ocean. Coast. Manage. 144: 23–30. https://doi.org/10.1016/j.ocecoaman.2017.04.012.
- Malik, M. I., Bhat, M. S., 2015. Sustainability of tourism development in Kashmir — Is paradise lost? Tourism Management Perspectives. 16: 11–21. https://doi.org/10.1016/j.tmp.2015.05.006.
- Manning, R. E., 2011. Studies in outdoor recreation: search and research for satisfaction, third ed. Oregon State University Press, Corvallis.
- Marzetti, S., Mosetti, R., 2005. Social carrying capacity of mass tourist sites: theoretical and practical issues about its measurement. FEEM Working Paper, 144.05. http://dx.doi.org/10.2139/ssrn.856024.
- Muganda, M., Sahli, M., A Smith, K., 2010. Tourism’s contribution to poverty alleviation: A community perspective from Tanzania. Dev. South. Afr. 27(5): 629–646. https://doi.org/10.1080/0376835X.2010.522826.
- Mycoo, M., 2014. Sustainable tourism, climate change and sea level rise adaptation policies in Barbados. Nat. Resour. Forum. 38: 47—57. https://doi.org/10.1111/1477-8947.12033.
- Nakajima, E. S., Ortega, E., 2016. Carrying capacity using emergy and a new calculation of the ecological footprint. Ecol. Indic. 60: 1200–1207. https://doi.org/10.1016/j.ecolind.2015.08.054.
- Naufal, F. I., Subhan, B., Zamani, N. P., 2015. Pengaruh kawasan pariwisata terhadap kesehatan karang di Pulau Pari, Kepulauan Seribu. IPB University, Bogor.
- Ngowi, R. E., Jani, D., 2018. Residents’ perception of tourism and their satisfaction: Evidence from Mount Kilimanjaro, Tanzania. Dev. South. Afr. 35(6): 731–742. https://doi.org/10.1080/0376835X.2018.1442712.
- Nguyen, V. H., 2022. Segmenting local residents by perceptions of tourism impacts in Sapa, Vietnam: a cluster analysis. International Journal of Tourism Cities. 8(1): 153–167. https://doi.org/10.1108/IJTC-03-2021-0046.
- Peeters, P., Gössling, S., Klis, J., Milano, C., Novelli, M., Dijkmans, C., Eijgelaar, E., Hartman, S., Heslinga, J., Isaac, R., Mitas, O., Moretti, S., Nawijn, J., Papp, B., Postma, A., 2018. Research for TRAN Committee - Overtourism: impact and possible policy responses. European Parliament, Policy Department for Structural and Cohesion Policies, Brussels. https://www.europarl.europa.eu/RegData/etudes/STUD/2018/629184/IPOL_STU(2018)629184_EN.pdf (accessed 14 June 2024).
- R Core Team., 2024. R: A language and environment for statistical computing. R Foundation for Statistical Computing, Vienna, Austria.
- Rasoolimanesh, S. M., Jaafar, M., 2016. Residents’ perception toward tourism development: a pre-development perspective. Journal of Place Management and Development. 9(1): 91–104. https://doi.org/10.1108/JPMD-10-2015-0045.
- Rey-Valette, H., Damart, S., Roussel, S., 2007. A multicriteria participation-based methodology for selecting sustainable development indicators: an incentive tool for concerted decision making beyond the diagnosis framework. Int. J. Sus. Dev. World. 10(1–2): 122–138. https://doi.org/10.1504/IJSD.2007.014418.
- Saarinen, J., Manwa, H., 2008. Tourism as a Socio-Cultural Encounter: Host-Guest Relations in Tourism Development in Botswana. Botswana Notes and Records. 39: 43–53. http://www.jstor.org/stable/41236632.
- Sagoe-Addy, K., Addo, K. A., 2013. Effect of predicted sea level rise on tourism facilities along Ghana’s Accra coast. J. Coast. Conserv. 17: 155—166. https://doi.org/10.1007/s11852-012-0227-y.
- Saveriades, A., 2000. Establishing the social tourism carrying capacity for the tourist resorts of the east coast of the Republic of Cyprus. Tourism Manage. 21(2): 147–156. https://doi.org/10.1016/S0261-5177(99)00044-8.
- Sayan, M. S., Atik, M., 2011. Recreation carrying capacity estimates for protected areas: a study of Termessos National Park. Ekoloji. 78: 66–74. https://doi.org/10.5053/ekoloji.2011.7811.
- Shaheen, K., Zaman, K., Batool, R., Khurshid, M. A., Aamir, A., Shoukry, A. M., Sharkawy, M. A., Aldeek, F., Khader, J., Gani, S., 2019. Dynamic linkages between tourism, energy, environment, and economic growth: evidence from top 10 tourism-induced countries. Environ. Sci. Pollut. R. 26(30): 31273–31283. https://doi.org/10.1007/s11356-019-06252-1.
- Smith, K. T., Pinkerton, A., 2021. Apartment selection by college students. International Journal of Housing Markets and Analysis. 14(1): 55–71. https://doi.org/10.1108/IJHMA-12-2019-0124.
- Sousa, R. C. de, Pereira, L. C. C., Costa, R. M. da, Jiménez, J. A., 2017. Management of estuarine beaches on the Amazon coast though the application of recreational carrying capacity indices. Tourism Manage. 59: 216–225. https://doi.org/10.1016/j.tourman.2016.07.006.
- Stefănica, M., Butnaru, G. I., 2015. Research on Tourists’ Perception of the Relationship between Tourism and Environment. Proc. Econ. Finance. 20: 595–600. https://doi.org/10.1016/S2212-5671(15)00113-6.
- Taber, K. S., 2018. The Use of Cronbach’s Alpha When Developing and Reporting Research Instruments in Science Education. Res. Sci. Ed. 48(6): 1273–1296. https://doi.org/10.1007/s11165-016-9602-2.
- Tavakol, M., Dennick, R., 2011. Making sense of Cronbach’s alpha. International Journal of Medical Education. 2: 53–55. https://doi.org/10.5116/ijme.4dfb.8dfd.
- Timothy, V. L., Said, S. K., 2023. Perception of residents on the impacts of beach tourism: The case of Nungwi village in Zanzibar, Tanzania. Heliyon. 9(11). https://doi.org/10.1016/j.heliyon.2023.e21816.
- Tokarchuk, O., Gabriele, R., Maurer, O., 2021. Estimating tourism social carrying capacity. Ann. Tourism. Res. 86. https://doi.org/10.1016/j.annals.2020.102971.
- Triyono, Utami, P. B., Barid, V. B., Lukman, K. M., Gunawan, B., Ihsan, Y. N., Jogaswara, H., Sjafrie, N. D. M., 2024a. The paradox between economic gain and environmental sustainability: A case of small island tourism in Pari Island, Indonesia. Tourism in Marine Environments. 19(1): 1-21. https://doi.org/10.3727/154427323X17026460566015.
- Triyono, Gunawan, B., Ihsan, Y. N., Jogaswara, H., 2024b. Keberlanjutan pariwisata di Pulau Pari: perspektif ekologi politik. Universitas Padjadjaran, Bandung.
- Triyono, Gunawan, B., Ihsan, Y. N., Jogaswara, H., Rahmadi, P., Lukman, K. M., Utami, P. B., Sjafrie, N. D. M., Barid, V. B., 2023. The opportunities of stakeholders’ cooperation in marine tourism governance in small tropical islands of Indonesia. Journal of Marine and Island Cultures. 12(3): 187–209. https://doi.org/10.21463/jmic.2023.12.3.13.
- UNWTO., 2019. ‘Overtourism’? understanding and managing urban tourism growth beyond perceptions, 2019th ed., Vol. 2. UNWTO, Madrid. https://doi.org/10.18111/9789284420629.
- Utami, P. B., Maheswari, A., 2021. Kajian daya dukung wisata pantai dan wisata pengamatan penyu bertelur di KKP3K Taman Pesisir Paloh 2021. Yayasan WWF Indonesia, Denpasar.
- Viñals, M. J., Planelles, M., Alonso-Monasterio, P., Morant, M., 2016. Recreational carrying capacity on small mediterranean islands. Cuadernos de Turismo. 0(37): 437–463. https://doi.org/10.6018/turismo.37.256341.
- WTTC., 2023. The environmental impact of global tourism. https://researchhub.wttc.org/product/the-environmental-impact-of-global-tourism-2023 (accessed 22 May 2024).
- Wu, H., Kim, S. (Sam), Wong, A. K. F., 2020. Residents’ perceptions of desired and perceived tourism impact in Hainan Island. Asia Pac. J. Tour. Res. 25(6): 583–601. https://doi.org/10.1080/10941665.2020.1752749.
- Xiao, X., Gao, J., Lu, J., Li, P., Zhang, Y., 2023. Social carrying capacity and emotion dynamics in urban national parks during the COVID-19 pandemic. Journal of Outdoor Recreation and Tourism. 41: 100451. https://doi.org/10.1016/j.jort.2021.100451.
- Yusoh, M. P. bin, Mapjabil, J., Hanafi, N., Idris, M. A. bin M., 2021. Tourism carrying capacity and Social Carrying capacity: A literature review. SHS Web of Conferences. 124: 02004. https://doi.org/10.1051/shsconf/202112402004.
- Zelenka, J., Kacetl, J., 2014. The concept of carrying capacity in tourism. Amfiteatru Economic Journal. 16(36): 641–654. http://creativecommons.org/licenses/by/4.0/.
- Zhang, H., Liu, Y., Li, J., Tian, P., Zhong, J., Gong, H., 2023. Evaluation and analysis of coastal complex ecological resilience based on multidimensional data: A case study of East China Sea. Ecol. Indic. 155: 110981. https://doi.org/10.1016/j.ecolind.2023.110981.