Sustainable Development to Reduce Socio-Economic Disparities between Land and Sea Areas in the Jakarta Province Amidst Climate and Environmental Change
Abstract
Most regions in Indonesia have land and sea areas where most of the population lives on the mainland, and the rest live in the sea area on small islands. Jakarta is a province with land and sea areas comprising 113 small islands called Kepulauan Seribu Regency. This study aims to capture the dynamics of urban communities amidst climate and environmental change. The research uses a descriptive analysis approach based on statistical data from related agencies. Regarding socio-economic status, there are fundamental differences between Kepulauan Seribu Regency and the mainland Jakarta area. The land area has a metropolitan economic character, while the sea area has a rural character. The service sector largely dominates economic activity on the mainland. The fisheries sector dominates economic activities in the sea area. The main occupation and education of the population also varies. The number of urban facilities is much greater on land than at sea. This gap gives rise to differences in levels of welfare. To reduce the socio-economic disparities between the people of Kepulauan Seribu Regency and those living on the mainland of Jakarta province, a sustainable development policy is needed, including economic, social, and climate and environmental change factors.
Keywords
socio-economic disparity, land and sea areas, climate and environmental change, Sustainable Development, HDI, economic structure
1. Introduction
Based on geographical conditions, land and sea are part of the earth, where the comparison is 29% land and 71% sea. The food needs of the world's are met from agricultural areas in parts of the earth (Kalt et al., 2021; Michalscheck et al., 2020). Many countries around the world possess both land and sea territories, such as Indonesia, Madagascar, New Zealand, including Australia, which is renowned for its vast land and maritime domains (Normyle et al., 2022). Another country is Bangladesh, which currently makes its land and sea ownership an advantage for the country's economy (Ahmed et al., 2022). The existence of land and sea areas will affect a country in terms of its development policies and strategies. For example, China has carried out technological innovations in coastal areas and its national spatial planning through its land and sea coordination strategy (Gao et al., 2022; Xia et al., 2019).
Likewise, Indonesia's territory consists of land and sea areas. Many regions in Indonesia are located on the mainland (large islands) but have administrative areas in the form of small islands around them. Henceforth, in this paper, the area located on the big island is called the land area, and the area located on the small islands is called the sea area. Indonesia's land and sea areas stretch for about 6,400 km long from Sabang, Aceh in the west to Merauke, Papua in the east (Barasa, 2023).
Development in areas that have land and sea areas is usually adjusted to the economic pattern of the land population and the sea/island residents who inhabit it (Tisdell, 2009). The tertiary sector dominates the economy of the land area, while the primary sector dominates the economy of the sea area. The difference between land and sea areas can create socio-economic gaps (Baldacchino, 2006; Del Gatto & Mastinu, 2018). Among them are the causes that have a significant influence on the level of public health (Shao & Dou, 2023), and the level of income of the community (Nugraha et al., 2020). Therefore, to improve their economy, several cities that have land and sea areas are reclaiming land for the benefit of tourism, fisheries, and mining (Innocenti & Musco, 2023).
Jakarta is one of Indonesia's provinces, which has land and sea areas. Jakarta has been the country's capital since Indonesia's independence. Jakarta is in the western part of the island of Java, Indonesia. The province has a land area of 660.98 km2 and a sea area of 6,997 km2. The ocean area is administratively a separate district called Kepulauan Seribu Regency, comprising around 113 small islands. The population of Kepulauan Seribu Regency is around 28,523 people (BPS DKI Jakarta, 2024; Kementerian Dalam Negeri Indonesia, 2022). Most of the population (about 70%) lives on the main island, namely Pramuka Island. The remaining population lives on other islands, which are mostly small and isolated. Through Law Number 2 of 2024 concerning the Province of the Special Region of Jakarta, the city of Jakarta has become a national economic center and a global city that functions as a trade center, a center for service and financial services activities, and a center for national, regional, and global business activities (Pemerintah Republik Indonesia, 2024). However, the national economic turnaround is still centered in Jakarta, where the economic sector in Jakarta's urban development has grown rapidly in the last thirty years (Abidin et al., 2011; Nasution et al., 2022). Developments in various sectors are expected to encourage economic growth (Lan & Tseng, 2018).
In Jakarta, the economic pattern of the land area is different from the economic pattern of the sea area (Kepulauan Seribu). The tertiary sector dominates the economy of the land area, while the primary sector dominates the economy of the sea area. This has implications for two contrasting things in Jakarta – the land area is metropolitan, while the sea area is rural. The metropolitan economic pattern relies mainly on the provision of the service sector to drive economic growth and is supported by increased efficiency (Lan & Tseng, 2018). Meanwhile, the rural economic pattern is mainly supported by household entrepreneurship and agricultural businesses (Yang et al., 2022). In addition, there is also a socio-economic gap between land and sea areas in Jakarta, where land areas are more prosperous than sea areas.
Natural disasters in the Jakarta Province, particularly hydrometeorological-induced disasters, mainly in the mainland area. Kepulauan Seribu has a low number of natural disasters compared to the mainland (BNPB, 2024). However, Kepulauan Seribu, just like many other small islands, is classified as vulnerable to economic, social, and physical aspects of environmental change and natural hazards (Tompkins et al., 2005). Small islands are typically land-resource-constrained due to their small sizes. Spaces for life, infrastructure, waste disposal, agriculture, and industry are limited. Based on historical data from 1980 to 2021, Kepulauan Seribu experienced an increased minimum temperature of 2.2°C, 3.5 times more frequent extreme temperature and precipitation events, and 4.17 mm/year of sea level rise (Setiawati et al., 2023). Current and future global warming is believed to affect the world's climate and other extreme conditions, including sea level rise, changes in rainfall patterns, and a more acidic sea (Houghton, 2005; Meehl et al., 2005; Tebaldi et al., 2021; Wang et al., 2017) that negatively affects the marine ecosystem (Venegas et al., 2023), not to mention storm waves and tropical cyclones that are expected to be more intense and frequent (Shimura et al., 2022; Wu et al., 2020).
It is not enough to use an economic approach to reduce the socio-economic gap in Jakarta because it will only be a momentary solution. A comprehensive and sustainable solution is needed. In other words, the policy that must be carried out is sustainable development, which can improve economic, social, and environmental indicators (Rahma et al., 2019). Pay attention to health, education, and income equality policies, and consider environmental changes caused by global warming. Sustainable development is a development process that focuses on meeting the needs of today's life without eliminating the potential for future generations of development resources (Zahedi, 2019). This implies that development in a country should not be carried out by ignoring the sustainability of future life. Even now, with considerations for environmental sustainability and the global economy, the international community has begun to demand the implementation of a sustainable development process in all countries (Chien, 2023). Sustainable development has three interrelated dimensions, namely the environment, the economy, and the community (Mensah, 2019). Therefore, the formulation of sustainable development is an integration of environmental sustainability, economic development, and social development (Singh et al., 2021).
Climate and environmental change can have negative impacts on economic, social, and health (van de Haterd et al., 2021), and undermine previous development (Jamero et al., 2018). Sustainable development can help to reduce the impact (Beg et al., 2002; Bizikova et al., 2007). Twelve of the 17 Sustainable Development Goals involve taking action on climate change, and agenda 13 of the Sustainable Development Goal (SDG 13) is specifically aimed at regulating emissions and strengthening resilience and adaptive capacity towards climate change-related disasters (Campbell et al., 2020). Climate change could lead a city to be wiser in its use of various resources (Kristiadi et al., 2022), and considering the existing potential environmental hazards such as land subsidence (Abidin et al., 2011), and the risk of sea level rise (Du et al., 2020; Rözer et al., 2022).
Amid the current global environmental issues, this study is critical because it will explore the socio-economic gap between Jakarta's mainland and sea area. The results can recommend sustainable development policies to reduce the existing gap, paying attention to climate change.
2. Methodology
Formulating sustainable development policies to reduce socio-economic disparities requires attention to several aspects of development. Sustainable development policy is the result of analysis based on components in the Human Development Index (HDI), people's economic activities described in their economic structure, as well as the potential for climate and environmental change in the future (Permana et al., 2021). In line with this, Robaina et al. (2024) said that there is a tendency to have a strong relationship between the level of human development as measured by HDI and environmental sustainability, thus becoming a challenge for sustainable development.
Based on the research objectives described in the introduction and description of sustainable development above, Figure 1 describes the procedure for preparing sustainable development policies to reduce the disparities between land and sea areas. The research uses a descriptive analysis approach based on statistical data from related agencies.

The steps in Figure 1 can be described as follows:
- Analyzing socio-economic disparities in land and sea areas. Socio-economic life boils down to the quality of human beings. Therefore, this analysis uses the HDI to indicate disparities. HDI is described as its components, namely purchasing power, education, and health. In various countries, the measurement of the HDI is also carried out on the components of health, education, and income (Nai Ruscone & Fernández, 2021).
- Analyzing the economic structure of Jakarta's land and sea areas. This will ensure that the focus of economic activities in the two regions is different and will also be the basis for economic policies to reduce disparities between them.
- Conduct environmental change analysis in response to global warming. Global warming will affect wind speed, sea wave height, temperature, rainfall, and sea level rise.
- Based on the above analyses, formulate sustainable development policies to reduce socio-economic disparities between land and sea areas.
HDI measurements have been carried out internationally. United Nations Development Programme (UNDP) guides the calculation of the HDI that can be used by all countries and for a particular time (Amini et al., 2021). In this paper, the HDI used is the HDI calculated by Statistic Indonesia (BPS), which refers to the UNDP guidelines. UNDP uses three dimensions for measuring HDI, namely longevity and healthy living, knowledge and a decent standard of living (Indeks Pembangunan Manusia 2022, 2022). With this reference, BPS uses four HDI calculation components: life expectancy at birth, expected years of schooling, mean years of schooling, and adjusted per capita expenditure.
BPS calculates HDI, which consists of four components, then composites them into three HDI dimensions, and finally composites them again into an HDI value. The first component is life expectancy, which measures the health index. The health index of a region \(r\) is formulated as:
$$ HI_r = \frac{LE_r - LE_{min}}{LE_{max} - LE_{min}} $$
where, \(HI_r\) is the health index of region \(r\), \(LE_r\) is the life expectancy at birth of region \(r\), \(LE_{max}\) is the maximum life expectancy of birth and \(LE_{min}\) is the minimum life expectancy at birth.
The expected years of schooling index (EYSI) is formulated as:
$$ EYSI_r = \frac{EYS_r - EYS_{min}}{EYS_{max} - EYS_{min}} $$
where, \(EYSI_r\) is the expected years of schooling index of region \(r\), \(EYS_r\) is the expected years of schooling of region \(r\), \(EYS_{max}\) is the maximum expected years of schooling, and \(EYS_{min}\) is the minimum expected years of schooling.
The mean years of schooling index (MYSI) is formulated as:
$$ MYSI_r = \frac{MYS_r - MYS_{min}}{MYS_{max} - MYS_{min}} $$
where, \(MYSI_r\) is the mean years of schooling index of region \(r\), \(MYS_r\) is the mean years of schooling of region \(r\), \(MYS_{max}\) is the maximum mean years of schooling, and \(MYS_{min}\) is the minimum mean years of schooling.
The education index, which is the average of the second (EYS) and third (MYS) components above, is calculated as:
$$ EI_r = \frac{EYSI_r + MYSI_r}{2} $$
where, \(EI_r\) is the education index of region \(r\).
The fourth component, which is also the third dimension of HDI, is the adjusted per capita expenditure index, formulated as:
$$ AEI_r = \frac{AE_r - AE_{min}}{AE_{max} - AE_{min}} $$
where, \(AEI_r\) is the adjusted per capita expenditure index of region \(r\), \(AE_r\) is the adjusted per capita expenditure of region \(r\), \(AE_{max}\) is the maximum adjusted per capita expenditure, and \(AE_{min}\) is the minimum adjusted per capita expenditure.
The HDI is the geometric mean of three dimensions: health index, education index, and adjusted per capita expenditure.
$$ HDI_r = \sqrt[3]{HI_r \times EI_r \times AEI_r} \times 100 $$
where \(HDI_r\) is the human development index of region \(r\).
This study used HDI data issued by BPS-Statistics DKI Jakarta Province (BPS DKI Jakarta, 2023, 2024). Meanwhile, it used calculated data from the BPS of each related region in the form of GRDP data and the People's Welfare Index for each HDI component and its details by region (BPS Jakarta Barat, 2023, 2024; BPS Jakarta Pusat, 2023, 2024; BPS Jakarta Selatan, 2023, 2024; BPS Jakarta Timur, 2023, 2024; BPS Jakarta Utara, 2023, 2024; BPS Kepulauan Seribu, 2023, 2024a).
The economic structure differences between Jakarta’s land and sea areas are observable from their GRDPs. The GRDP of the land area is the sum of the GRDP of Central Jakarta City, East Jakarta City, North Jakarta City, West Jakarta City, and South Jakarta City. Meanwhile, the GRDP of the sea area is the GRDP of the Kepulauan Seribu Regency. The latest GRDP data published by BPS for each city or district in Jakarta was detailed in business fields, making sector-based GRDP analysis possible. To see the economic structures of Jakarta’s land and sea areas, the GRDP values of each economic sector, which were initially expressed in rupiah (Rp), were changed to percent.
The contribution of sector n in the GRDP is:
$$ S_n = \frac{GRDP_n}{GRDP} \times 100\% $$
where \(S_n\) is the contribution of sector n, \(GRDP_n\) is the value of GRDP of sector n, and \(GRDP\) is the total value of GRDP.
Global warming also impacts environmental changes in the waters of the Kepulauan Seribu. In this research, changing environments are represented by changes in surface temperature, sea level rise (SLR), and wave height. The increase in temperature following global warming has significant implications for water resources due to the increase in potential evapotranspiration, which is directly related to surface temperature in addition to changes in rainfall patterns (Erol & Randhir, 2012; Koutroulis et al., 2016). Wind speed data is used because Kepulauan Seribu wave height data is unavailable. Wind speed is known to correlate positively with significant wave height (Gunaratna, 2012; Sugianto et al., 2017; Veer & Gachet, 2011).
Identification of environmental changes was carried out by comparing future environmental conditions using future climate and SLR projection data against historical data. The data were obtained with the following procedures:
- The observed temperature and rainfall data were obtained from the Meteorology Office station in Pari island, Kepulauan Seribu (5.8573°S and 106.6184°E). The complete data set from 1985 to 2014 as the baseline for analysis can be obtained by filling in significant gaps in data. The POWER Access Data (https://power.larc.nasa.gov/data-access-viewer/) with a resolution of 0.5° × 0.625° latitude–longitude and data from the Meteorology Office station at Tanjung Priok marine weather station (about 40 km southeast of Pari island) were used to fill the gaps using a multiple linear regression method. The future climate projection data used the statistically downscaled 25 km spatial resolution CNRM for the Coupled Model Intercomparison Project Phase 6 (CMIP6) provided by NASA Exchange Global Daily Downscaled Projections (Thrasher et al., 2021, 2022), and accessible through the Google Earth Engine (GEE). The SSP2-45 scenario to represent the mid-range of probable projections was mainly used in the analysis (IPCC, 2021; Riahi et al., 2017). Bias correction was carried out on the projection data before use using the change factor method (Ho et al., 2012; Navarro-Racines et al., 2015; Tabor & Williams, 2010).
- Historical sea level data from 1993 to 2023 were obtained from AVISO+ (https://www.aviso.altimetry.fr/en/data/products/sea-indicators-products/mean-sea-level/data-acces.html). The sea level projection data from the IPCC 6th Assessment Report (AR6) (IPCC, 2021) were downloaded through the NASA Sea Level Projection Tool (https://sealevel.nasa.gov/ipcc-ar6-sea-level-projection-tool).
- Historical wind speed data used 11 km resolution reanalysis data of ERA5 generated by the European Centre for Medium-Range Weather Forecasts (ECMWF) (Hersbach et al., 2020; Molina et al., 2021), and accessed through GEE. The analysis used the 1985-2014 data as the baseline. The wind speed projection data used the 25 km downscaled CNRM-CMIP6 obtained from the GEE with a similar procedure when obtaining the temperature and precipitation projection data. The bias of wind speed projection data was corrected by the quantile mapping method (Navarro-Racines et al., 2015; Piani et al., 2010).
The Standardized Precipitation-Evapotranspiration Index (SPEI) was calculated based on monthly rainfall and temperature data. It is an index for assessing wet and dry condition anomalies, which can also be used to assess the impact of global warming (Beguería et al., 2010; Vicente-Serrano, 2015; Vicente-Serrano et al., 2010, 2015).
The wind speed index was used to assess wind speed anomaly. This index was created by fitting long-term records of daily wind speed data with the Gamma probability distribution. When the probability relationship with wind speed from historical data was established, the probability of wind speed at each time was calculated, which was then converted to a normal distribution with a mean wind speed of zero and a standard deviation of one.
SLR plays an essential role in environmental change in the Kepulauan Seribu. The SLR was estimated by projecting historical data from 1993.
3. Result and Discussion
Socio-economic Disparities
The HDI description below shows the socio-economic gap in Jakarta, which has land and sea areas. The socio-economic gap can be seen in human quality, measured by HDI. The HDI of the Kepulauan Seribu has always been lower than that of Jakarta. Over the past three consecutive years, the HDI of the Kepulauan Seribu was 74.65 in 2021, 75.34 in 2022, and 75.91 in 2023. Far below Jakarta's overall HDI, which was 82.25 in 2021, 82.77 in 2022 and 83.55 in 2023 (BPS DKI Jakarta, 2024).
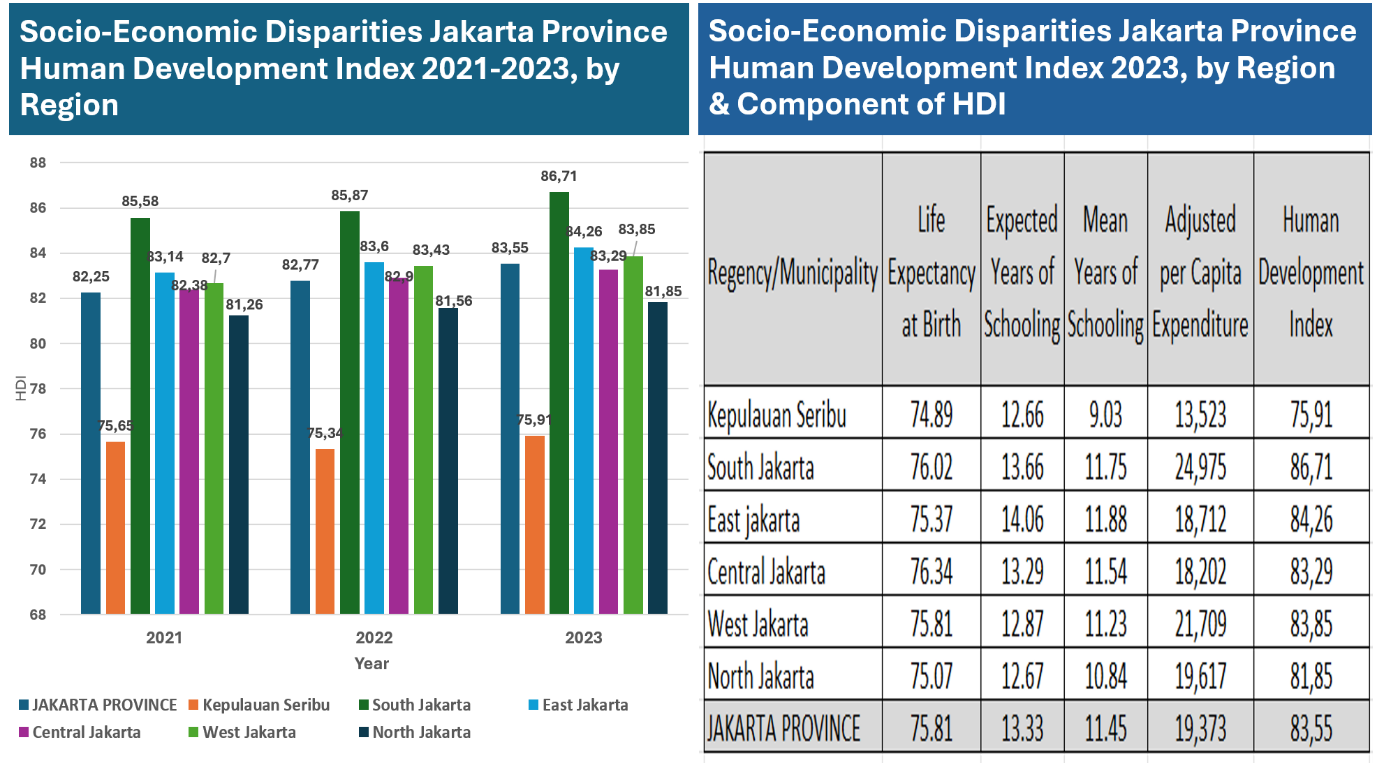
The HDI calculation is based on life expectancy at birth, expected years of schooling, mean years of schooling, and expenditure per capita. The magnitude of the HDI value and its components in Jakarta in 2023 is detailed by regency/municipality, as shown in Figure 2. The Kepulauan Seribu's HDI is always lower than the average of Jakarta and lower than any HDI in the municipality located in the mainland area. The same results can also be seen in each component of HDI.
For life expectancy at birth, which represents a health indicator, it can be seen that in 2023, the value of the Kepulauan Seribu is the lowest. The life expectancy of a newborn baby is 74.89 years, lower than the life expectancy of babies born inland areas.
Educational indicators are represented by the components of expected years and mean years of schooling. The expected years of schooling in Kepulauan Seribu is 12.66 years. Every student in the Kepulauan Seribu will study in school for 12.66 years. This figure is lower than any municipality located on the mainland. The mean years of schooling component of the Kepulauan Seribu is 9.03. This means that everyone in the Kepulauan Seribu has an average of 9.03 years of education. This figure is lower than the average length of schooling in each city on the mainland, which is more than 10 years.
The purchasing power indicator is represented by the per capita expenditure component. For this indicator, again, the Kepulauan Seribu ranks lowest. The per capita expenditure of the people of the Kepulauan Seribu in 2023 is Rp 13,523,000 (about US$ 830), much lower than any municipality in the mainland area—for example, the municipality of Central Jakarta, which is right above the Kepulauan Seribu Regency, the per capita expenditure of the people of Central Jakarta is Rp 18,202,000 (about US$ 1,115), far above the Kepulauan Seribu. The community income level must be increased to increase the value of this per capita expenditure. If the community has financial stability, their welfare will also increase (Hidayat & Sari, 2022).
To delve deeper into the disparities in the health and education sector, here is an overview of health and education facilities in Jakarta. According to BPS data (BPS DKI Jakarta, 2024), the number of health facilities in Kepulauan Seribu from 2018 to 2023 has not increased for the number of hospitals, as many as one unit, or for the number of health centers, as many as 6 units. This is different from the condition of the number of health facilities in 5 other Jakarta municipalities, which have increased the number of hospitals, while the number of Community Health Centers (Puskesmas) has decreased. The increase in the number of hospitals and decrease in the number of community health centers in the 5 areas of Jakarta municipalities can occur due to the increase in the status of community health centers in the 5 municipalities to hospitals.
Meanwhile, the number of Vocational High Schools (SMK) by the district in 2020-2023, the Kepulauan Seribu shows no increase in the number of school units during that period compared to other Jakarta Municipalities areas. Policymakers must consider these differences to effectively target the right interventions and resources to support all regions.
Another fact is that there is no university in Kepulauan Seribu. Meanwhile, higher education in other Jakarta areas has undergone various changes in the number of institutions, lecturers, and students. Several factors, including education policies, demographic trends, and economic development, can affect these changes. Facts and conditions like this indicate the need for a deeper investigation or special attention to the needs of higher education or vocational education for high school graduates in the Kepulauan Seribu so that it can be provision to continue education to higher education or the world of work.
Some descriptions of poverty levels are also needed to delve deeper into the disparities in purchasing power. According to BPS data (BPS DKI Jakarta, 2024), the poverty rate in Kepulauan Seribu is much higher than that of other municipalities in DKI Jakarta. In 2023, the percentage of poor people in the Kepulauan Seribu reached 13.13 percent, much higher than the poverty rate in the mainland, which does not reach 5 percent. This condition further strengthens the previous result, which is that Kepulauan Seribu's purchasing power is lower than that of other municipalities in the mainland area. Apart from that, the depth and severity of poverty in the sea area (Kepulauan Seribu) are also higher than in the land area. The Poverty Gap Index in 2023 in the Kepulauan Seribu will reach 1.52, while the average of Jakarta is only 0.70. On the other hand, the Poverty Severity Index in the Kepulauan Seribu reached 0.33, while the average of Jakarta reached 0.18.
Economic Structure
An overview of Jakarta's GRDP divided by land and sea areas can be seen in Figure 3. The two regions have different characteristics. The mainland area provides urban economic characteristics with the dominance of the trade sector (G), information and communication sector (J), manufacturing industry sector (C), financial services and insurance sector (K), and construction sector (F). Meanwhile, the sea area provides rural economic characteristics with the dominance of the mining and quarrying sectors (B) as well as the agriculture, forestry, and fisheries sectors (A).
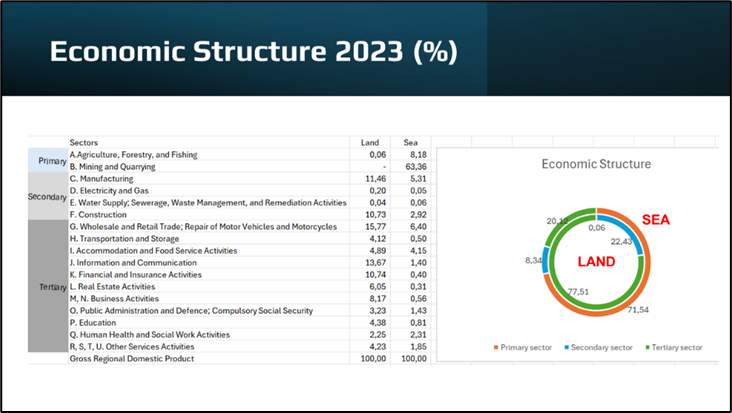
As shown in Figure 3, the economy is divided into three groups of activities. The first group is the primary sector, which comprises sectors A and B. The second group is the secondary sector, which comprises sectors C, D, E, and F. Meanwhile, the rest are tertiary sectors (services). With this grouping, the differences in the economic structure of the land and sea areas in Jakarta are even more evident. The tertiary sector dominates the land area, while the primary sector dominates the sea or sea area.
The primary sector in the Kepulauan Seribu is dominated by the mining and excavation sector, which is oil and gas mining on Pabelokan Island, a small uninhabited island. The mining activities are carried out by foreign companies that have little to do with the economic activities of the people of the Kepulauan Seribu. According to BPS Kepulauan Seribu, this sector has experienced negative growth in recent years.
Suppose oil and gas mining activities are excluded from the GRDP of the Kepulauan Seribu. In that case, the agriculture, forestry, and fisheries sectors are the most significant contributors to the economic activities of the Kepulauan Seribu. The fisheries subsector itself dominates the agriculture, forestry, and fisheries sectors. This follows the characteristics and patterns of the rural economy which is dominated by the agricultural and fisheries sectors (Yang et al., 2022). The difference in economic patterns above causes socio-economic disparities between land and sea areas in Jakarta. Other sectors that play a significant role in the Kepulauan Seribu are the trade sector, the processing industry sector, and the accommodation and food and beverage provision sector.
The main driver of economic growth in Kepulauan Seribu during 2023 is the wholesale and retail trade – repair of motor vehicles and motorcycles activities, accommodation and food services activities, and other service activities. Meanwhile, the main driver of economic growth during 2022 is the wholesale and retail trade – repair of motor vehicles and motorcycles, accommodation and food services activities, as well as agriculture, forestry, and fisheries activities (BPS Kepulauan Seribu, 2024b).
Climate and Environmental Change
-
Surface temperature and rainfall changes
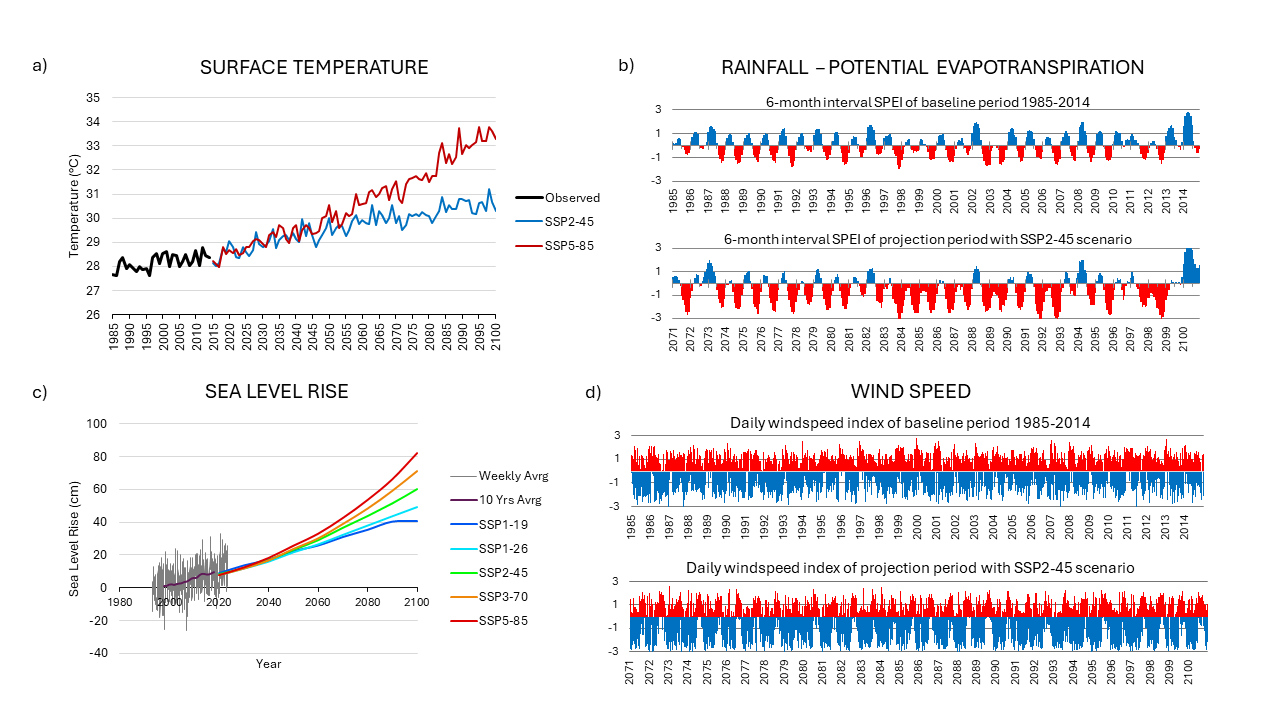
Global warming impacts changes in temperature and rainfall in Kepulauan Seribu. Calculating the average annual temperature shows a steadily increasing trend for both the moderate scenario SSP2-45 and the high scenario SSP5-85 (Figure 4a). Annual rainfall may increase but was not significant, from 1757 mm/yr during the baseline period to 1901 mm/yr in the 1971-2100 period for the SSP2-45 and to 1786 mm/yr for SSP5-85.
Surface temperature and rainfall changes affect the SPEI calculation (Figure 4b). Severe drought conditions (SPEI Index < -2.0) can be more frequent and longer in the future, impacting the availability of natural groundwater in Kepulauan Seribu and water-related sectors such as agriculture.
-
Sea level rise
The average sea level in Kepulauan Seribu has steadily increased since 1993, but the rise rates vary according to future emission scenarios. Figure 4c shows the expected rates of sea level rise in Kepulauan Seribu in the future based on the mid-range of probable sea level rise projections from each SSP scenario. The sea-level rise rates in 2020-2050 vary from 0.44 cm/year to 0.60 cm/yr. For the medium emission scenario SSP2-45, the rate is similar to the rate of sea level rise as recorded by the satellites in the last 20 years (1993-2022), i.e. 0.49 cm/yr. The rates are expected to be higher towards 2100, except for the lowest emission scenario SSP1-19.
With the medium emission scenario SSP2-45, the increase may reach 21 cm in 2050 and 50 cm in 2100. Suppose islands in Kepulauan Seribu have a 1 m elevation. Depending on the geometry of the island, these increases could result in severe land loss. The geometry of groundwater storage could be significantly reduced, reducing the capacity of water stored in the islands.
-
Changing wave heights
At the end of 2100, wind speeds in the Kepulauan Seribu tend to be weaker than baseline. The future wind speeds in the projection period average 2.31 m/s for the medium-range scenario (SSP2.45), whereas the wind speeds average 2.69 m/s in the baseline period. The plot of the wind speed index (Figure 4d) shows that the incidence of extremely high wind speeds (index value >2), or wind speeds exceeding 7.4 m/s, also decreased from 0.87% in the baseline period to 0.59% in the projection period. The 1 m/s increase in wind speed could generate about 0.26 m of significant wave height (Veer & Gachet, 2011). The findings suggest that future wave heights in Kepulaun Seribu could be slightly lower and that extremely high waves may be less frequent than in current conditions.
4. Conclusion
The study results show that first, there is a socio-economic disparity between the mainland population and the sea population in Jakarta, where this gap occurs in all components of HDI, namely health, education, and people's purchasing power. Second, there is a difference in economic structure where the economic activities of the residents of mainland Jakarta are concentrated in the tertiary sector, and the residents of the Kepulauan Seribu are concentrated in the primary sector. Third, in terms of climate and environment, it was found that there is a potential loss of land and groundwater resources due to sea level rise and more frequent and severe droughts. Meanwhile, extreme wave heights will be less frequent in the future.
Based on the description of the research findings submitted, this study recommends integrated development policies that can reduce the gap in all components of HDI, namely health, education, and purchasing power.
Economic development to improve purchasing power or income in the Kepulauan Seribu must focus on the tourism sector (where there are accommodation and food activities and fishery services). As described in the analysis of the economic structure, accommodation and food activities significantly contribute to the GRDP of the Kepulauan Seribu. These tourism activities are tourism activities that are based on the environment and related to fishery activities.
The mining sector also has the potential to increase the community's income level if the community is involved as a skilled workforce. Special education is needed to produce these skilled workers in the Kepulauan Seribu community through vocational schools.
Human resource development in Kepulauan Seribu is prioritized to improve skills through vocational schools that support the economic development of Kepulauan Seribu. This can be done by improving the curriculum by increasing tourism, mining, and fisheries content.
The development of the health sector is also an effort to improve the quality of human resources. In this case, the quality of health services needs to be improved through the ease of public accessibility to health services in Kepulauan Seribu.
The development of the economy, education, and health fields above is carried out by considering the potential for climate change and the environment. This is expected to increase community income, employment, and health simultaneously and sustainably. The potential for climate change and the environment in question includes natural resources and local wisdom as tourist attractions and the inclusivity of local communities. Local wisdom that has been going on for generations, for example, is ecotourism in mangrove and coral forest conservation areas, as well as seaweed cultivation and fishery activities, while still strengthening environmental protection in the Kepulauan Seribu and its surroundings from water pollution, waste, and hazardous contaminants.
As a preventive measure, a measurable action plan must be prepared to anticipate potential droughts and reductions in groundwater resources that can affect the amount of water needed for future consumption, health, and land activities.
Acknowledgments
The research and publication of this article were carried out independently in terms of funding, without support from any party.
Declarations of Conflict of Interest
The authors declared no potential conflicts of interest concerning the research, authorship, and/or publication of this article.
References
- Abidin, H. Z., Andreas, H., Gumilar, I., Fukuda, Y., Pohan, Y. E., & Deguchi, T. (2011). Land subsidence of Jakarta (Indonesia) and its relation with urban development. Natural Hazards, 59(3), 1753–1771. https://doi.org/10.1007/s11069-011-9866-9
- Ahmed, Z. U., Hasan, O., Rahman, M. M., Akter, M., Rahman, M. S., & Sarker, S. (2022). Seaweeds for the sustainable blue economy development: A study from the south east coast of Bangladesh. Heliyon, 8(3), e09079. https://doi.org/10.1016/j.heliyon.2022.e09079
- Amini, M., Zayeri, F., & Salehi, M. (2021). Trend analysis of cardiovascular disease mortality, incidence, and mortality-to-incidence ratio: results from global burden of disease study 2017. BMC Public Health, 21(1), 1–12. https://doi.org/10.1186/s12889-021-10429-0
- Indeks Pembangunan Manusia 2022, Badan Pusat Statistik (2022).
- Baldacchino, G. (2006). Managing the hinterland beyond: Two ideal-type strategies of economic development for small island territories. Asia Pacific Viewpoint, 47(1), 45–60. https://doi.org/10.1111/j.1467-8373.2006.00295.x
- Barasa, L. (2023). An Empirical Study on the Influence of Internal and External Factors on Port Enterprise Employee Performance: A Case Study in Indonesia. Journal of Eta Maritime Science, 11(4), 290–303. https://doi.org/10.4274/JEMS.2023.05657
- Beg, N., Morlot, J. C., Davidson, O., Afrane-Okesse, Y., Tyani, L., Denton, F., Sokona, Y., Thomas, J. P., La Rovere, E. L., Parikh, J. K., Parikh, K., & Rahman, A. A. (2002). Linkages between climate change and sustainable development. Climate Policy, 2(2–3), 129–144. https://doi.org/10.3763/cpol.2002.0216
- Beguería, S., Vicente-Serrano, S. M., & Angulo-Martínez, M. (2010). A multiscalar global drought dataset: The SPEI base: A new gridded product for the analysis of drought variability and impacts. Bulletin of the American Meteorological Society, 91(10), 1351–1356. https://doi.org/10.1175/2010BAMS2988.1
- Bizikova, L., Robinson, J., & Cohen, S. (2007). Linking climate change and sustainable development at the local level. Climate Policy, 7(4), 271–277. https://doi.org/10.1080/14693062.2007.9685655
- BNPB. (2024). Data Bencana Indonesia. Geoportal Data Bencana Indonesia. https://dibi.bnpb.go.id
- BPS DKI Jakarta. (2023). Indikator Kesejahteraan Rakyat Provinsi DKI Jakarta 2023. In Badan Pusat Statistik (Vol. 28).
- BPS DKI Jakarta. (2024). Provinsi DKI Jakarta Dalam Angka 2024. In Badan Pusat Statistik (Vol. 54).
- BPS Jakarta Barat. (2023). Indikator Kesejahteraan Rakyat Kota Jakarta Barat 2023. In Badan Pusat Statistik.
- BPS Jakarta Barat. (2024). Kota Jakarta Barat Dalam Angka 2024. In Badan Pusat Statistik (Vol. 51).
- BPS Jakarta Pusat. (2023). Indikator Kesejahteraan Rakyat Kota Jakarta Pusat Tahun 2023. In Badan Pusat Statistik.
- BPS Jakarta Pusat. (2024). Kota Jakarta Pusat dalam Angka 2024. In Badan Pusat Statistik (Vol. 40, pp. 1–583). https://jakpuskota.bps.go.id/publikasi.html
- BPS Jakarta Selatan. (2023). Indikator Kesejahteraan Rakyat 2023 Kota Jakarta Selatan. In Badan Pusat Statistik.
- BPS Jakarta Selatan. (2024). Kota Jakarta Selatan Dalam Angka 2024. In Badan Pusat Statistik (Vol. 33).
- BPS Jakarta Timur. (2023). Indikator Kesejahteraan Rakyat 2023 Kota Jakarta Timur. In Badan Pusat Statistik.
- BPS Jakarta Timur. (2024). Kota Jakarta Timur Dalam Angka 2024. In Badan Pusat Statistik.
- BPS Jakarta Utara. (2023). Indikator Kesejahteraan Rakyat Kota Jakarta Utara. In Badan Pusat Statistik (Vol. 3).
- BPS Jakarta Utara. (2024). Kota Jakarta Utara dalam Angka 2024. In Badan Pusat Statistik (Vol. 31, p. 1699).
- BPS Kepulauan Seribu. (2023). Indikator Kesejahteraan Rakyat Kabupaten Kepulauan Seribu 2023. In Badan Pusat Statistik (Vol. 11, Issue 1).
- BPS Kepulauan Seribu. (2024a). Kabupaten Kepulauan Seribu Dalam Angka 2024. In Badan Pusat Statistik (Vol. 17).
- BPS Kepulauan Seribu. (2024b). Produk Domestik Regional Bruto Kabupaten Kepulauan Seribu Menurut Lapangan Usaha 2019-2023. In Badan Pusat Statistik (Vol. 10).
- Campbell, J., Neuner, J., See, L., Fritz, S., Fraisl, D., Espey, J., & Kim, A. (2020). The role of combining national official statistics with global monitoring to close the data gaps in the environmental SDGs. Statistical Journal of the IAOS, 36(2), 443–453. https://doi.org/10.3233/SJI-200648
- Chien, F. (2023). The Impact of Green Investment, Eco-Innovation, and Financial Inclusion on Sustainable Development: Evidence from China. Engineering Economics, 34(1), 17–31. https://doi.org/10.5755/j01.ee.34.1.32159
- Del Gatto, M., & Mastinu, C. S. (2018). Geography, cultural remoteness and the second nature of within-country economic development: do island regions lag behind? Regional Studies, 52(2), 212–224. https://doi.org/10.1080/00343404.2017.1284310
- Du, S., Scussolini, P., Ward, P. J., Zhang, M., Wen, J., Wang, L., Koks, E., Diaz-Loaiza, A., Gao, J., Ke, Q., & Aerts, J. C. J. H. (2020). Hard or soft flood adaptation? Advantages of a hybrid strategy for Shanghai. Global Environmental Change, 61(December 2019), 102037. https://doi.org/10.1016/j.gloenvcha.2020.102037
- Erol, A., & Randhir, T. O. (2012). Climatic change impacts on the ecohydrology of Mediterranean watersheds. Climatic Change, 114(2), 319–341. https://doi.org/10.1007/s10584-012-0406-8
- Gao, J., An, T., Shen, J., Zhang, K., Yin, Y., Zhao, R., He, G., Hynes, S., & Jattak, Z. U. (2022). Development of a land-sea coordination degree index for coastal regions of China. Ocean and Coastal Management, 230(September), 106370. https://doi.org/10.1016/j.ocecoaman.2022.106370
- Gunaratna, P. (2012). A Wave Transformation Matrix Approach for Establishing Nearshore Wave Climate in the Dubai Coastal Zone. February 2012.
- Hersbach, H., Bell, B., Berrisford, P., Hirahara, S., Horányi, A., Muñoz-Sabater, J., Nicolas, J., Peubey, C., Radu, R., Schepers, D., Simmons, A., Soci, C., Abdalla, S., Abellan, X., Balsamo, G., Bechtold, P., Biavati, G., Bidlot, J., Bonavita, M., … Thépaut, J. N. (2020). The ERA5 global reanalysis. Quarterly Journal of the Royal Meteorological Society, 146(730), 1999–2049. https://doi.org/10.1002/qj.3803
- Hidayat, P., & Sari, R. L. (2022). Linkage between financial inclusion and Indonesian welfare: a recent evidence. Cogent Business and Management, 9(1). https://doi.org/10.1080/23311975.2022.2108299
- Ho, C. K., Stephenson, D. B., Collins, M., Ferro, C. A. T., & Brown, S. J. (2012). Calibration strategies a source of additional uncertainty in climate change projections. Bulletin of the American Meteorological Society, 93(1), 21–26. https://doi.org/10.1175/2011BAMS3110.1
- Houghton, J. (2005). Global warming. Reports on Progress in Physics, 68(6), 1343–1403. https://doi.org/10.1088/0034-4885/68/6/R02
- Innocenti, A., & Musco, F. (2023). Land–Sea Interactions: A Spatial Planning Perspective. Sustainability (Switzerland), 15(12). https://doi.org/10.3390/su15129446
- IPCC. (2021). Climate Change 2021 The Physical Science Basis Summary for Policymakers Working Group I Contribution to the Sixth Assessment Report of the Intergovernmental Panel on Climate Change. In Climate Change 2021: The Physical Science Basis. https://www.ipcc.ch/report/ar6/wg1/
- Jamero, M. L., Onuki, M., Esteban, M., & Tan, N. (2018). Community-based adaptation in low-lying islands in the Philippines: challenges and lessons learned. Regional Environmental Change, 18(8), 2249–2260. https://doi.org/10.1007/s10113-018-1332-8
- Kalt, G., Mayer, A., Haberl, H., Kaufmann, L., Lauk, C., Matej, S., Röös, E., Theurl, M. C., & Erb, K. H. (2021). Exploring the option space for land system futures at regional to global scales: The diagnostic agro-food, land use and greenhouse gas emission model BioBaM-GHG 2.0. Ecological Modelling, 459. https://doi.org/10.1016/j.ecolmodel.2021.109729
- Kementerian Dalam Negeri Indonesia. (2022). Kepmendagri-100.1.1-6117-Tahun-2022. Kementerian Dalam Negeri.
- Koutroulis, A. G., Grillakis, M. G., Daliakopoulos, I. N., Tsanis, I. K., & Jacob, D. (2016). Cross sectoral impacts on water availability at +2°C and +3°C for east Mediterranean island states: The case of Crete. Journal of Hydrology, 532, 16–28. https://doi.org/10.1016/j.jhydrol.2015.11.015
- Kristiadi, Y., Sari, R. F., Herdiansyah, H., Hasibuan, H. S., & Lim, T. H. (2022). Developing DPSIR Framework for Managing Climate Change in Urban Areas: A Case Study in Jakarta, Indonesia. Sustainability (Switzerland), 14(23), 1–30. https://doi.org/10.3390/su142315773
- Lan, S., & Tseng, M. L. (2018). Coordinated Development of Metropolitan Logistics and Economy Toward Sustainability. Computational Economics, 52(4), 1113–1138. https://doi.org/10.1007/s10614-017-9788-z
- Meehl, G. A., Washington, W. M., Collins, W. D., Arblaster, J. M., Hu, A., Buja, L. E., Strand, W. G., & Teng, H. (2005). How much more global warming and sea level rise? Science, 307(5716), 1769–1772. https://doi.org/10.1126/science.1106663
- Mensah, J. (2019). Sustainable development: Meaning, history, principles, pillars, and implications for human action: Literature review. Cogent Social Sciences, 5(1). https://doi.org/10.1080/23311886.2019.1653531
- Michalscheck, M., Groot, J. C. J., Fischer, G., & Tittonell, P. (2020). Land use decisions: By whom and to whose benefit? A serious game to uncover dynamics in farm land allocation at household level in Northern Ghana. Land Use Policy, 91(August 2019), 104325. https://doi.org/10.1016/j.landusepol.2019.104325
- Molina, M. O., Gutiérrez, C., & Sánchez, E. (2021). Comparison of ERA5 surface wind speed climatologies over Europe with observations from the HadISD dataset. International Journal of Climatology, 41(10), 4864–4878. https://doi.org/10.1002/joc.7103
- Nai Ruscone, M., & Fernández, D. (2021). Dynamics of HDI Index: Temporal Dependence Based on D-vine Copulas Model for Three-Way Data. In Social Indicators Research (Vol. 158, Issue 2). Springer Netherlands. https://doi.org/10.1007/s11205-021-02682-y
- Nasution, B. I., Saputra, F. M., Kurniawan, R., Ridwan, A. N., Fudholi, A., & Sumargo, B. (2022). Urban vulnerability to floods investigation in jakarta, Indonesia: A hybrid optimized fuzzy spatial clustering and news media analysis approach. International Journal of Disaster Risk Reduction, 83(February), 103407. https://doi.org/10.1016/j.ijdrr.2022.103407
- Navarro-Racines, C. ., Tarapures-Montenegro, J. ., & Ramirez-Villegas, J. . (2015). Bias-correction in the CCAFS-Climate portal: a description of methodologies. Decision and Policy Analysis (DAPA) Research Area. International Center for Tropical Agriculture (CIAT). Cali, Colombia., 11.
- Normyle, A., Doran, B., Vardon, M., Mathews, D., & Melbourne, J. (2022). Land cover and fire accounts to support Indigenous land management: A pilot study of Yawuru Country. Journal of Environmental Management, 313(February), 115003. https://doi.org/10.1016/j.jenvman.2022.115003
- Nugraha, A. T., Prayitno, G., Situmorang, M. E., & Nasution, A. (2020). The role of infrastructure in economic growth and income inequality in Indonesia. Economics and Sociology, 13(1), 102–115. https://doi.org/10.14254/2071-789X.2020/13-1/7
- Pemerintah Republik Indonesia. (2024). Undang-Undang Republik Indonesia Nomor 2 Tahun 2024 Tentang Provinsi Daerah Khusus Jakarta. In Lembaran Negara Republik Indonesia.
- Permana, M., Rochaida, E., Mire, M. S., & Suharto, R. B. (2021). Measurement of sustainable development with electrification of households in Indonesia. International Journal of Energy Economics and Policy, 11(3), 87–99. https://doi.org/10.32479/ijeep.10937
- Piani, C., Haerter, J. O., & Coppola, E. (2010). Statistical bias correction for daily precipitation in regional climate models over Europe. Theoretical and Applied Climatology, 99(1–2), 187–192. https://doi.org/10.1007/s00704-009-0134-9
- Rahma, H., Fauzi, A., Juanda, B., & Widjojanto, B. (2019). Development of a composite measure of regional sustainable development in Indonesia. Sustainability (Switzerland), 11(20), 1–16. https://doi.org/10.3390/su11205861
- Riahi, K., van Vuuren, D. P., Kriegler, E., Edmonds, J., O’Neill, B. C., Fujimori, S., Bauer, N., Calvin, K., Dellink, R., Fricko, O., Lutz, W., Popp, A., Cuaresma, J. C., KC, S., Leimbach, M., Jiang, L., Kram, T., Rao, S., Emmerling, J., … Tavoni, M. (2017). The Shared Socioeconomic Pathways and their energy, land use, and greenhouse gas emissions implications: An overview. Global Environmental Change, 42, 153–168. https://doi.org/10.1016/j.gloenvcha.2016.05.009
- Robaina, M., Rodrigues, S., & Madaleno, M. (2024). Is there a trade-off between human well-being and ecological footprint in European countries? Ecological Economics, 224(January), 108296. https://doi.org/10.1016/j.ecolecon.2024.108296
- Rözer, V., Mehryar, S., & Surminski, S. (2022). From managing risk to increasing resilience: a review on the development of urban flood resilience, its assessment and the implications for decision making. Environmental Research Letters, 17(12). https://doi.org/10.1088/1748-9326/aca8bc
- Setiawati, M. D., Chatterjee, U., Djamil, Y. S., Alifatri, L. O., Nandika, M. R., Rachman, H. A., Supriyadi, I. H., Hanifa, N. R., Muslim, A. M., Eguchi, T., Prayudha, B., Oktaviani, A., Adi, N. S., Renyaan, J., Sulha, S., Wouthuyzen, S., Pal, S. C., Islam, A. R. M. T., Alam, E., & Islam, M. K. (2023). Seribu islands in the megacities of Jakarta on the frontlines of the climate crisis. Frontiers in Environmental Science, 11(November), 1–17. https://doi.org/10.3389/fenvs.2023.1280268
- Shao, Z., & Dou, L. (2023). How can environmental degradation and income disparities influence national health: an eye bird view on China’s provinces. Frontiers in Public Health, 11(July), 1–14. https://doi.org/10.3389/fpubh.2023.1094775
- Shimura, T., Pringle, W. J., Mori, N., Miyashita, T., & Yoshida, K. (2022). Seamless Projections of Global Storm Surge and Ocean Waves Under a Warming Climate. Geophysical Research Letters, 49(6), 1–8. https://doi.org/10.1029/2021GL097427
- Singh, A. K., Jyoti, B., Kumar, S., & Lenka, S. K. (2021). Assessment of global sustainable development, environmental sustainability, economic development and social development index in selected economies. International Journal of Sustainable Development and Planning, 16(1), 123–138. https://doi.org/10.18280/ijsdp.160113
- Sugianto, D. N., Zainuri, M., Darari, A., Suripin, S. D., & Yuwono, N. (2017). Wave height forecasting using measurement wind speed distribution equation in Java Sea, Indonesia. International Journal of Civil Engineering and Technology, 8(5), 604–619.
- Tabor, K., & Williams, J. W. (2010). Globally downscaled climate projections for assessing the conservation impacts of climate change. Ecological Applications, 20(2), 554–565. https://doi.org/10.1890/09-0173.1
- Tebaldi, C., Ranasinghe, R., Vousdoukas, M., Rasmussen, D. J., Vega-Westhoff, B., Kirezci, E., Kopp, R. E., Sriver, R., & Mentaschi, L. (2021). Extreme sea levels at different global warming levels. Nature Climate Change, 11(9), 746–751. https://doi.org/10.1038/s41558-021-01127-1
- Thrasher, B., Wang, W., Michaelis, A., Melton, F., Lee, T., & Nemani, R. (2022). NASA Global Daily Downscaled Projections, CMIP6. Scientific Data, 9(1), 1–6. https://doi.org/10.1038/s41597-022-01393-4
- Thrasher, B., Wang, W., & Nemani, R. (2021). NASA Earth Exchange Global Daily Downscaled Projections ( NEX-GDDP-CMIP6 ) 1 . Intent of This Document and POC 2 . Data Field Descriptions. 1–8.
- Tisdell, C. (2009). Economic Challenges Faced by Small Island Economies: An Overview. AgEcon Search, 58, 25.
- Tompkins, E. L., Nicholson-Cole, S. A., Hurlston, L.-A., Boyd, E., Hodge, G. B., Clarke, J., Gray, G., Trotz, N., & Varlack, L. (2005). Surviving Climate Change in Small Islands: A guidebook. October, 1–128. https://inis.iaea.org/search/search.aspx?orig_q=RN:37003788
- van de Haterd, J., Budiyono, B., Darundiati, Y. H., & Spaan, E. (2021). Environmental change and health risks in coastal Semarang, Indonesia: importance of local indigenous knowledge for strengthening adaptation policies. Cities and Health, 5(3), 276–288. https://doi.org/10.1080/23748834.2020.1729451
- Veer, R. Van, & Gachet, M. (2011). OMAE2011-49. 1–10.
- Venegas, R. M., Acevedo, J., & Treml, E. A. (2023). Three decades of ocean warming impacts on marine ecosystems: A review and perspective. Deep-Sea Research Part II: Topical Studies in Oceanography, 212(July), 105318. https://doi.org/10.1016/j.dsr2.2023.105318
- Vicente-Serrano, S. M. (2015). Standardized Precipitation Evapotranspiration Index (SPEI) Programme. 1–26. https://www.droughtmanagement.info/standardized-precipitation-evapotranspiration-index-spei/
- Vicente-Serrano, S. M., Beguería, S., & López-Moreno, J. I. (2010). A multiscalar drought index sensitive to global warming: The standardized precipitation evapotranspiration index. Journal of Climate, 23(7), 1696–1718. https://doi.org/10.1175/2009JCLI2909.1
- Vicente-Serrano, S. M., Van der Schrier, G., Beguería, S., Azorin-Molina, C., & Lopez-Moreno, J. I. (2015). Contribution of precipitation and reference evapotranspiration to drought indices under different climates. Journal of Hydrology, 526, 42–54. https://doi.org/10.1016/j.jhydrol.2014.11.025
- Wang, X., Jiang, D., & Lang, X. (2017). Future extreme climate changes linked to global warming intensity. Science Bulletin, 62(24), 1673–1680. https://doi.org/10.1016/j.scib.2017.11.004
- Wu, L., Wen, Z., & Huang, R. (2020). Tropical cyclones in a warming climate. Science China Earth Sciences, 63(3), 456–458.
- Xia, K., Guo, J. ke, Han, Z. lin, Dong, M. ru, & Xu, Y. (2019). Analysis of the scientific and technological innovation efficiency and regional differences of the land–sea coordination in China’s coastal areas. Ocean and Coastal Management, 172(April 2017), 157–165. https://doi.org/10.1016/j.ocecoaman.2019.01.025
- Yang, F., Liu, W., & Wen, T. (2022). The rural household’s entrepreneurship under the land certification in China. Cogent Economics and Finance, 10(1). https://doi.org/10.1080/23322039.2022.2091088
- Zahedi, S. (2019). Sustainable Development Theory: A Critical Perspective and an Integrative Model. Journal of Economics and Sustainable Development, 10(21), 43–52. https://doi.org/10.7176/jesd/10-21-05