Climate Change Adaptation and Economic Vulnerability of Small Scale Fishermen in the Spermonde Islands, Indonesia
Abstract
The general objectives of the research are: 1) To investigate the economic hardships faced by fishermen households in the Spermonde Islands due to climate change, and 2) To examine the adoption of diversified livelihoods as a tactic for confronting and adjusting to climate change among fishermen in the Spermonde Islands. Meanwhile, the specific objectives of the research are: 1) Calculating the economic vulnerability of fishermen to climate change, 2) Determining the adaptive capacity index (ACI), 3) Determining possible scenarios taken by fishermen in making decisions related to the impact of climate change on fishermen's income and 4) Determine co-development scenarios for adaptation to climate change. The research method uses in-depth interviews with small-scale fishermen on four islands in Makassar City (Barrang Lompo Island and Kodingareng Lompo) and Pangkep Regency (Ballang Lompo and Badi Islands) and data analysis to understand the impact of climate change on fishermen's livelihoods and the factors that influence vulnerability and their economy.
The research results show that fishermen in the Spermonde Islands face various challenges due to climate change, including increased frequency and intensity of extreme weather, changes in seasonal patterns, and rising sea levels. This impact negatively impacts their production and income, and threatens the sustainability of their livelihoods. A factor that most influenced the economic vulnerability of fishing households in the Spermonde Archipelago was the existence an alternative income for a fishermen.
Keywords
Economic vulnerability, climate change, small scale fishermen, fisherman’s culture, Spermonde Archipelago
1. Introduction
Vulnerability, within the context of climate change, is defined as the degree to which a system is susceptible to the adverse effects of climate variability and extreme events (IPCC, 2002). It is believed to result from three factors: exposure, sensitivity, and adaptive capacity to one or more disorders (Adger, 2006; Gallopín, 2006; Smit & Wandel, 2006), with the assumption that exposure and sensitivity contribute to vulnerability, while adaptive capacity offers strategies to mitigate or respond to potential impacts (Maldonado & Moreno-Sanchez, 2014).
There is significant uncertainty when projecting the impacts of climate change on marine fisheries productivity at both global and local scales. Nevertheless, efforts have predominantly concentrated on estimating potential reductions in biodiversity and alterations in the relative prevalence of species, or shifts in their probable distribution due to evolving oceanographic circumstances. Particularly noteworthy among these discoveries are potential shifts in global marine catches, with certain studies forecasting declines of up to 40% in tropical regions (Cheung et al., 2010), and consequently, a projected 35% decline in global income from marine resource-dependent sectors by 2050 (Lam et al., 2016). Failing to consider hidden dangers to the food supply of coastal communities (Cheung, 2018) is a recipe for disaster for people and businesses that depend on healthy oceans (marine ecosystems). This translates to blows to their wallets (income), how much it costs to fish (operational costs), and how well they can manage fish populations (fisheries management) (Pitcher & Cheung, 2013). On top of that, these challenges are colliding with other global issues like more people on Earth, messed up food supplies and eating habits, and increased pressure on fishing (Gattuso et al., 2015; Portner et al., 2014). Even if we perfectly manage how much fish is caught, these other problems could still cause havoc (Cheung et al., 2010).
The estimated and projected direct and indirect effects of climate change on marine ecosystems and coastal areas primarily impact small-scale fishers, especially in developing countries (Badjeck et al., 2010). This, in turn, creates conditions of borderline poverty and high dependence on marine resources as a food source (Allison et al., 2009) and for household livelihoods (Badjeck et al., 2010; Daw et al., 2009; Martins & Gasalla, 2020).
Artisanal fisheries, alternatively referred to as small-scale fisheries, encompass fishing operations carried out in coastal waters using minimal technology and capital by traditional or subsistence fishermen. These activities offer a source of both direct and indirect employment for coastal area residents engaged in fishing, as well as activities like unloading, loading, processing, distributing, and selling the catch. Artisanal fisheries hold significant importance in ensuring food security and contributing to household income within coastal fishing communities worldwide (Galappaththi et al., 2021; Sreya et al., 2021; Suresh et al., 2021). Although the impact of climate change on artisanal fisheries remains poorly studied, these fishing activities are highly dependent on seasonal variations, making them vulnerable to the effects of climate change. Therefore, it is imperative to research the economic vulnerability of artisanal fishermen to climate change. The objectives of this study were to: 1) Calculate the economic vulnerability of fishermen to climate change, 2) Determine the adaptive capacity index (ACI), 3) Identify possible scenarios guiding fishermen in making decisions related to the impact of climate change on their income, and 4) Develop co-development scenarios for adapting to climate change.
2. Methodology
2.1. The research Framework
2.1.1 The Fishermen's economic vulnerability
The fishermen's economic vulnerability were estimated utilizing the principles of economic vulnerability, as outlined by Adger, (2006). This study employed a vulnerability measure based on the comparison of the relative benefits derived by fishing households from alternative economic activities versus fishing, aiming to diversify their livelihoods.
At first, we thought that climate change might make fishing so unprofitable that fishermen would have to give it up altogether. So, we looked at other income-generating activities (alternative activities) that fishermen might do. We figured out the daily profit from these activities by subtracting their costs from their earnings, taking into account how often they do them each week. We did the same thing for fishing (daily profit from fishing).
Then, we used a formula (Equation 1): Benefit recovery = ((IS - CS)/frequency)/((IP- CP)/autonomy) to compare the daily profit from alternative activities to the daily profit from fishing. Where: income (IP) and costs (CP) per day (considering the weekly fishing frequency). to compare the daily profit from alternative activities to the daily profit from fishing. This formula basically divides the profit from the alternative activity (considering how often they do it) by the profit from fishing (considering how often they go fishing). This gives us the percentage of their fishing income compared to other livelihood that they have (Table 1).
| Level of vulnerability | Proportion of benefit recovered | Brief description |
|---|---|---|
| 1 | Recovery > 100% | Not vulnerable |
| 2 | 50% < Recovery ≤ 100% | Less vulnerable |
| 3 | 25% < Recovery n ≤ 50% | Enough vulnerable |
| 4 | 0% < Recovery ≤ 25% | Vulnerable |
| 5 | They fail to recover | Very vulnerable |
Using this percentage, we classified fishing households into five vulnerability levels:
- Level 1: These households make more from other livelihood compared to from fishing activities.
- Level 2: These households make more than half, but not all, of their fishing income from other activities.
- Level 3: These households make more than a quarter, but not half, of their fishing income from other activities.
- Level 4: These households make some, but not a quarter, of their fishing income from other activities.
- Level 5: These households either don't make any money from other activities or don't do them at all.
This categorization offers a comparative gauge of the influence on the well-being of fishing households when facing temporary or prolonged exposure to potential natural occurrences that impede families from earning income through fishing. Likewise, it facilitates the assessment of household livelihood diversification efforts aimed at mitigating the risk of losing fishing-related benefits.
2.1.2. Adaptive capacity index (ACI)
In this study, the ACI focuses on its original framework outlined by Moreno-Sanchez and Maldonado (2014), which was first used to evaluate the adaptive capacity of fishing communities during the establishment of marine protected areas. Later, this index was adjusted to evaluate the adaptive capacity of indigenous communities in addressing climate change. Moreno-Sanchez and Maldonado (2014) proposed dimensions including socio-economic (SN), institutional (SI), and socioecological (SE), each containing various sub-indices offering insights into fishermen's livelihoods, their institutional affiliations, and their interactions with the ecological environment. By amalgamating these dimensions with their respective subscripts, the complexity of decision-making within each fishing household aimed at reducing vulnerability can be assessed.
In this research, three dimensions of the ACI are utilized: social aspects and socio-economic dimensions of fishermen (SN) and climate change (PCC), Institutional Dimensions (SI), and Socio-ecological Dimensions (SE). Each ACI dimension is further subdivided into indices. In the socio-economic (SN) dimension, these indicators comprise assessments of poverty perception (POV), occupational characteristics (OCC), fishing operational costs (BOP), and fishermen's income (BON). The institutional (SI) dimension encompasses social cognitive capital (CSC) and perception of action on climate change (PCC). Finally, the socioecological (SE) dimension includes the ability to anticipate change (AAD) index. The adaptive capacity index value ranges from 1 to 5, with a description of the meaning of this range of values provided in Table 2.
| Value 1 | to | Value 5 |
|---|---|---|
| Poverty (POV) | ||
| Often have difficulty to fulfil a basic life's needs | Very well off and never finds it difficult to fulfil life's needs | |
| Occupational characteristic (OCC) | ||
| Unable to change jobs, he remains a fisherman | More able to change jobs other than being a fisherman | |
| Fishing operational cost (BOP) | ||
| It costs very little to go to fishing at one time | There are a lot of expenses, especially for fishing operations | |
| Fisherman income (BON) | ||
| A small amount of income from one trip of fishing | A lot of income from one trip of fishing | |
| Cognitive Social Capital (CSC) | ||
| There is minimal process for increasing knowledge regarding climate change, its impacts and anticipation | Many people know about and participate in fishermen's discussions or meetings discussing climate change, its impacts and anticipation | |
| Perception to climate change (PCC) | ||
| Not optimistic, climate change is considered unimportant, and they are not confident in facing climate change | Confident and optimistic in facing climate change | |
| Ability to anticipate change (AAD) | ||
| Unaware, not ready for change | Very aware and ready for changes and how to anticipate them | |
2.1.3. Determination of Fisherman Decision in Switching Livelihoods.
In order to ascertain whether there is a tendency among fishermen to pursue alternative employment, a conceptual framework was devised to elucidate the diverse socio-economic and institutional factors that prompt fishermen to switch away from fishing activities in light of potential declines in catches resulting from climate change. Drawing from this conceptual framework, a discrete choice model is formulated to asses the decision-making process regarding whether to continue fishing or transition to alternative occupations, and to show how this decision is influenced by various socio-economic variables unique to each fisherman. Furthermore, this conceptual framework takes into account the impact of poverty and the availability of income-generating opportunities beyond fishing. To identify the variables that significantly influence the economic vulnerability of fishermen, a forward stepwise regression model for Oprobit was employed.
2.2. Study sites
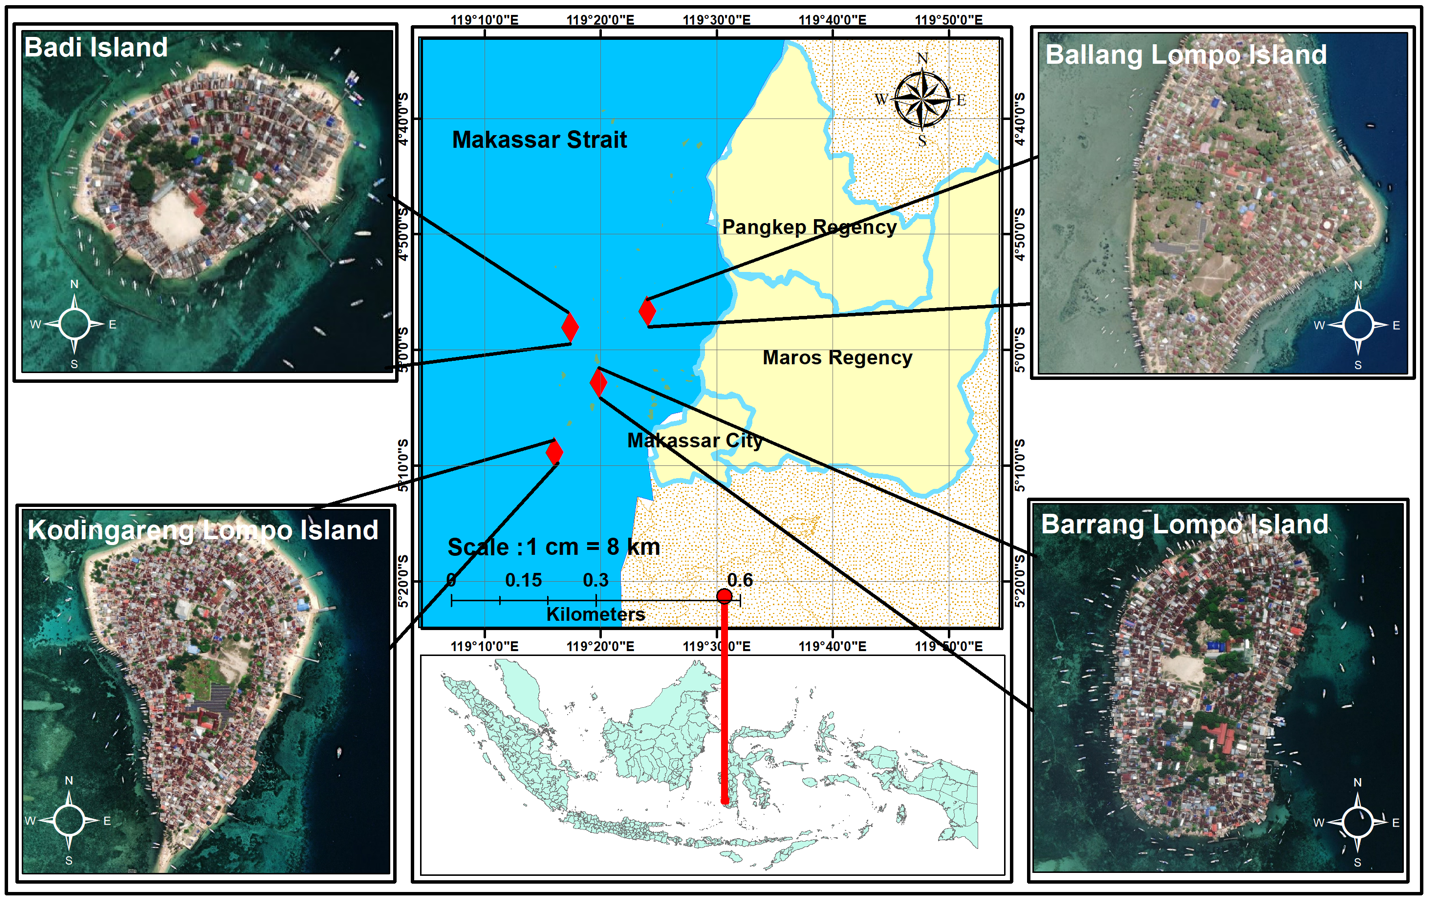
This research was conducted on four islands around Makassar city , the South Sulawesi Province in Indonesia. Those islands are Barrang Lompo Island and Badi Island (Pangkep Regency), Kodingareng Lompo and Ballang Lompo Islands (Makassar City), Spermonde Islands, South Sulawesi (Figure 1).
2.3. Data collection and number of respondents
Information was gathered from traditional or artisanal fishermen residing on four specified islands. The data collection process consisted of three primary stages. Initially, data was collected regarding the components of the Adaptive Capacity Index (ACI). Subsequently, a sampling method was devised to gather details about fishing operations and other common or lucrative household activities. This entailed collecting data on available resources, efforts exerted, costs incurred, revenue generated, and other relevant factors. The main objective was to assess the likelihood of households transitioning between economic activities and their readiness to discontinue fishing operations in a hypothetical scenario of diminishing fishing yields and income. The final stage entailed collecting data on household composition and decision-making dynamics, with a focus on the household head's role.
The number of respondents was determined using the method outlined in the article "Small Sample Techniques" and references from Kreijcie (1970). This method determined the number of samples based on the total population. The total population of fishermen on the four islands in the research location was 2566 people. Subsequently, the number of respondents for each island was determined proportionally. The results of calculating the number of respondents for each island based on this method are as follows: 172 respondents from Kodingareng Lompo Island , 112 respondents from Barrang Lompo Island, 40 respondents from Balang Lompon Island and 40 respondents from Badi Island. In total, there was 364 respondents (Table 3) The total number of respondents was 364 people (Table 3)
| Island | Number of respondents (person) | Percentage |
|---|---|---|
| Kodingareng Lompo | 174 | 47.3 |
| Barrang Lompo | 112 | 31.1 |
| Balang Lompo | 40 | 10.9 |
| Badi | 40 | 10.7 |
| Total | 366 | 100 |
3. Results
3.1. Respondents demography
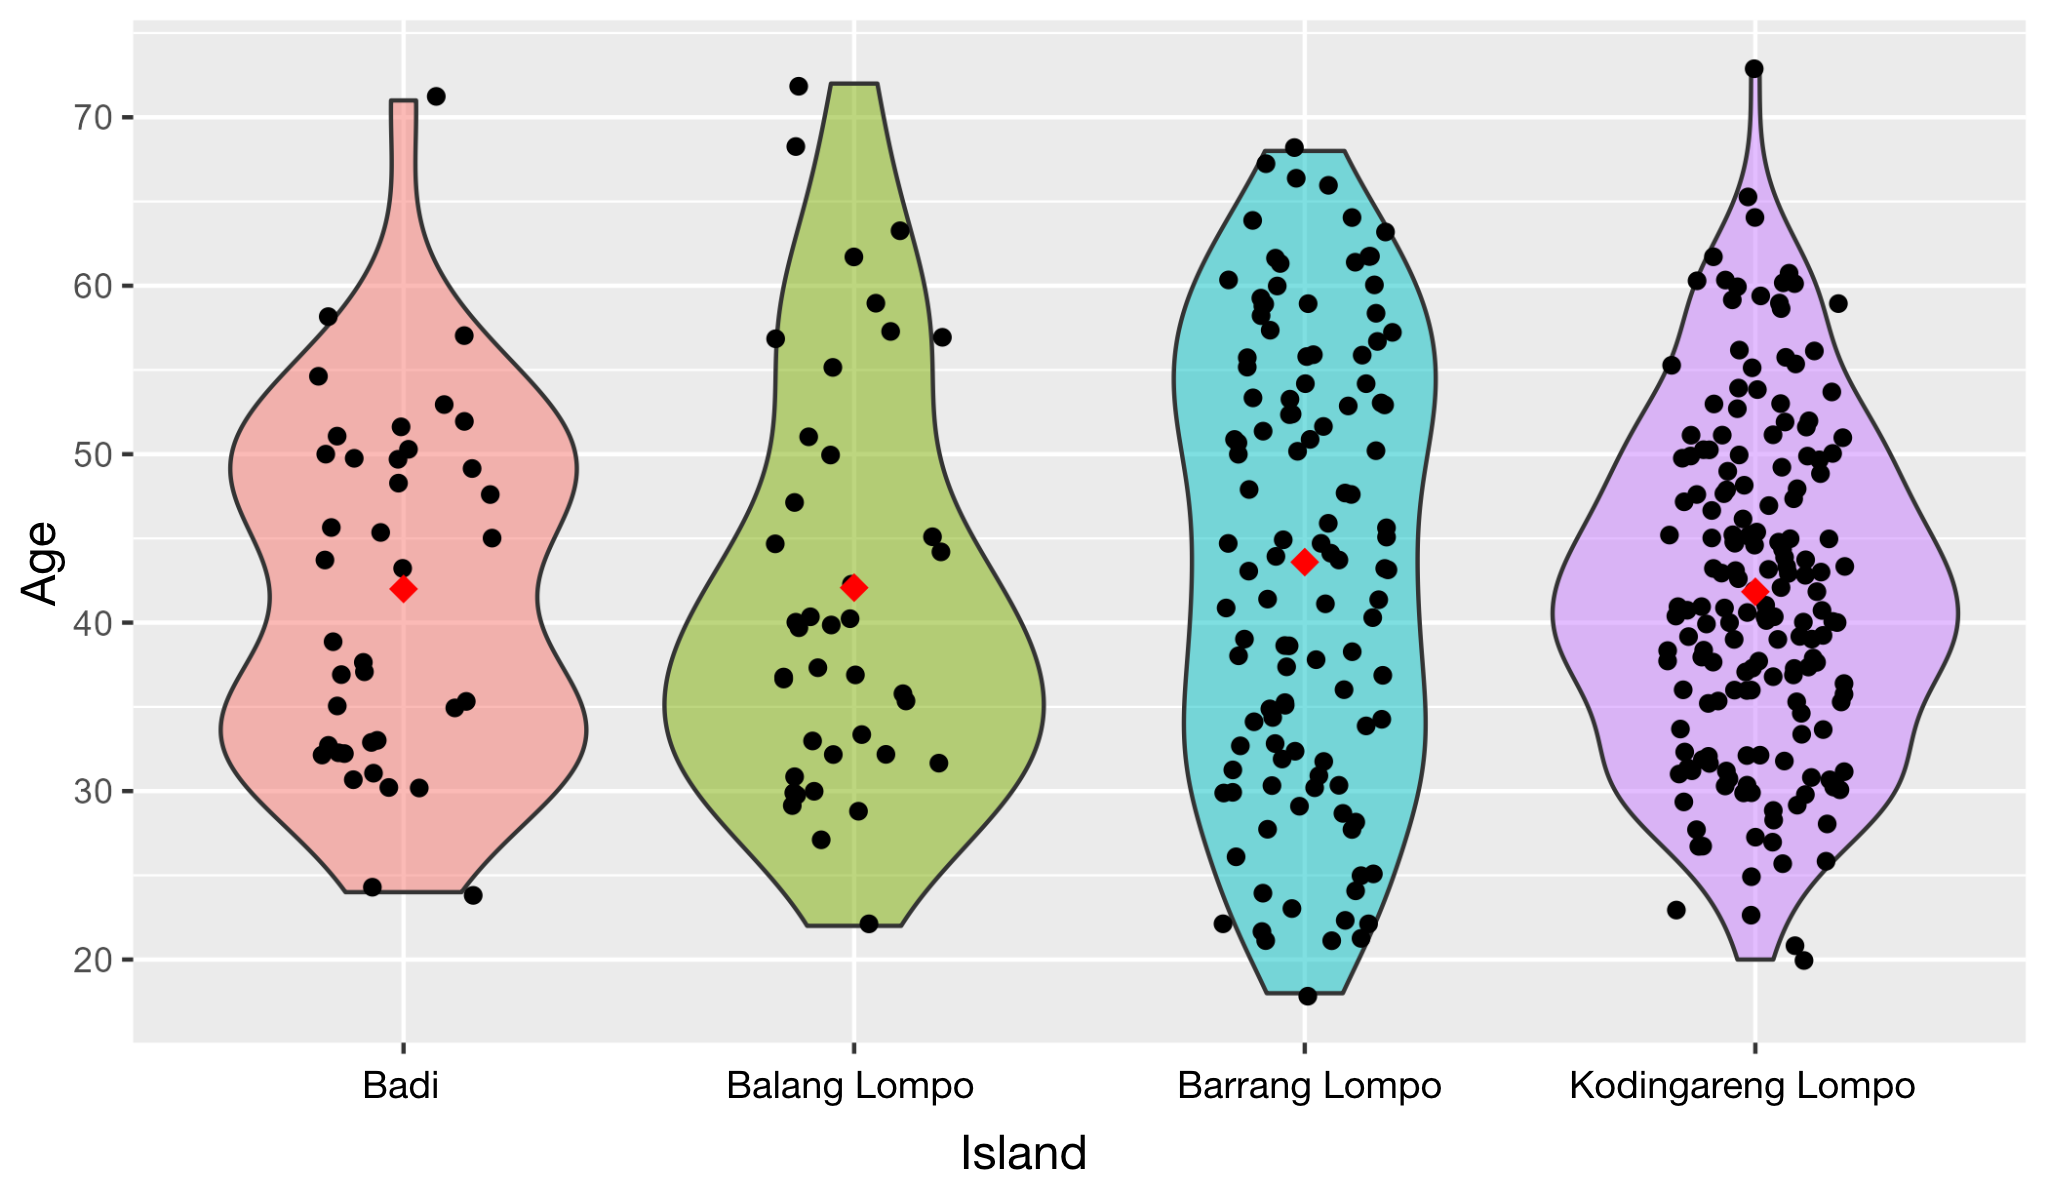
Thee average ages of those 364 respondents from four islands (Barrang Lompo Island, Kodingareng Lompo, Badi, and Ballang Lompo) showed in Fiture 3. The an average age of 42 years, with the youngest age being 18 years and the oldest respondent being 73 years old (Figure 2).
The education level of the majority of respondents (88.2%) had completed elementary school and only a small portion had junior high school (6.6%) and high school (0.5%) education. The types of fishing gear used by respondents varied and the distribution for each island can be seen in Table 4.
| Island | Type of fishing gear (%) | |||||
|---|---|---|---|---|---|---|
| Hook&line | Trap | Gill nets | Purse seine | Sero fishing gear | Compressor, arrow and spear | |
| All | 62 | 9 | 5 | 2 | 2 | 22 |
| Badi | 43 | 0 | 34 | 14 | 6 | 3 |
| Balang Lompo | 15 | 76 | 5 | 2 | 2 | 0 |
| Barrang Lompo | 53 | 3 | 2 | 0 | 2 | 40 |
| Kodingareng | 81 | 0 | 1 | 0 | 0 | 18 |
3.2. Respondents' socio-economic aspects
The socio-economic aspects of respondents are presented in Table 5.
| Variable | Average indicator | Units |
|---|---|---|
| Fishing frequency | 17.00 | Times/month |
| Number of household member | 3.29 | Person/house |
| Years of education | 6.00 | Year |
| Boat ownership | 87.15 | % |
| Fishermen with alternative occupation | 20.49 | % |
Table 5 shows that the average frequency of fishing for respondents is 17 times/month. Almost the majority of respondents (87.15%) own a boat and only a small portion of respondents have alternative jobs (20.49%). The alternative job that most respondents have is self-employed or fish trader (Table 6).
| Type of occupation | Total number (person) |
|---|---|
| Not available | 300 |
| Civil servant | 1 |
| Aquaculture and fisheries | 13 |
| Teacher | 1 |
| Enterpreneuer | 53 |
3.3. Fishermen's perceptions of climate change
To explore fishermen's/respondents' perceptions of climate change, there are 10 closed questions in the questionnaire, examples of questions with the percentage of respondents' answers are presented in Figure 3.
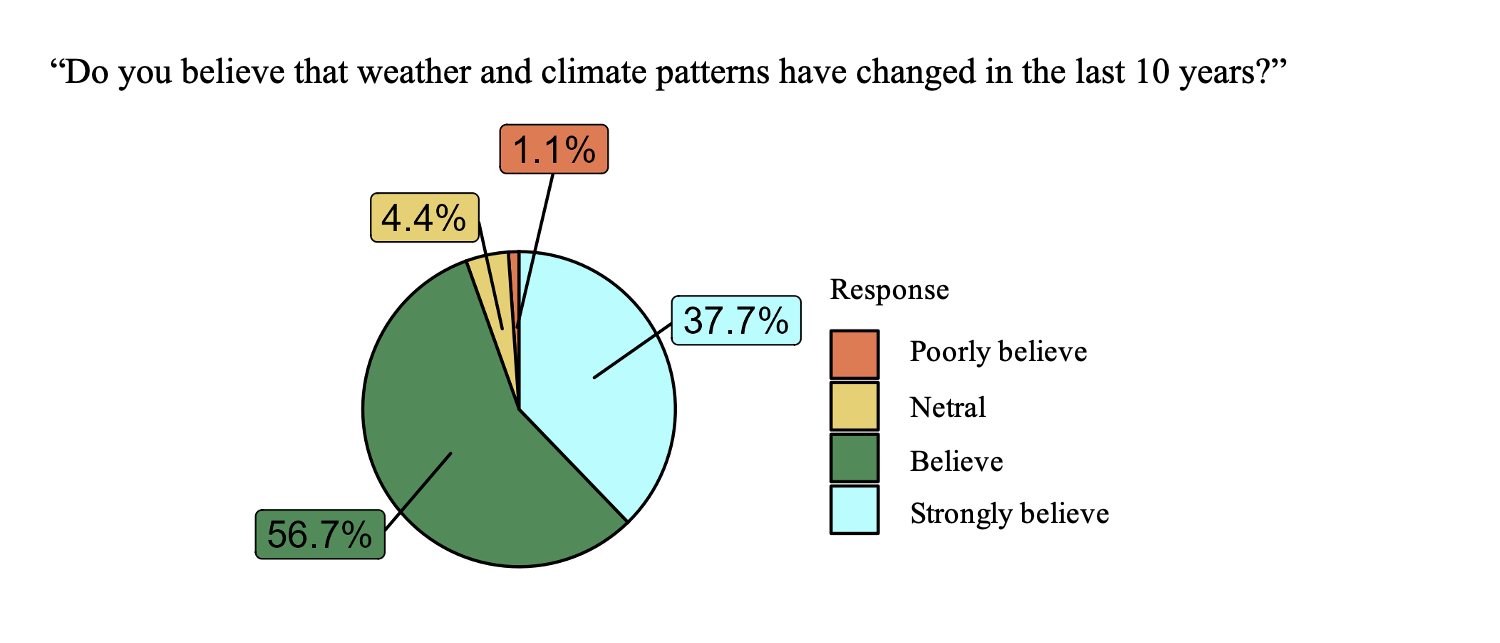
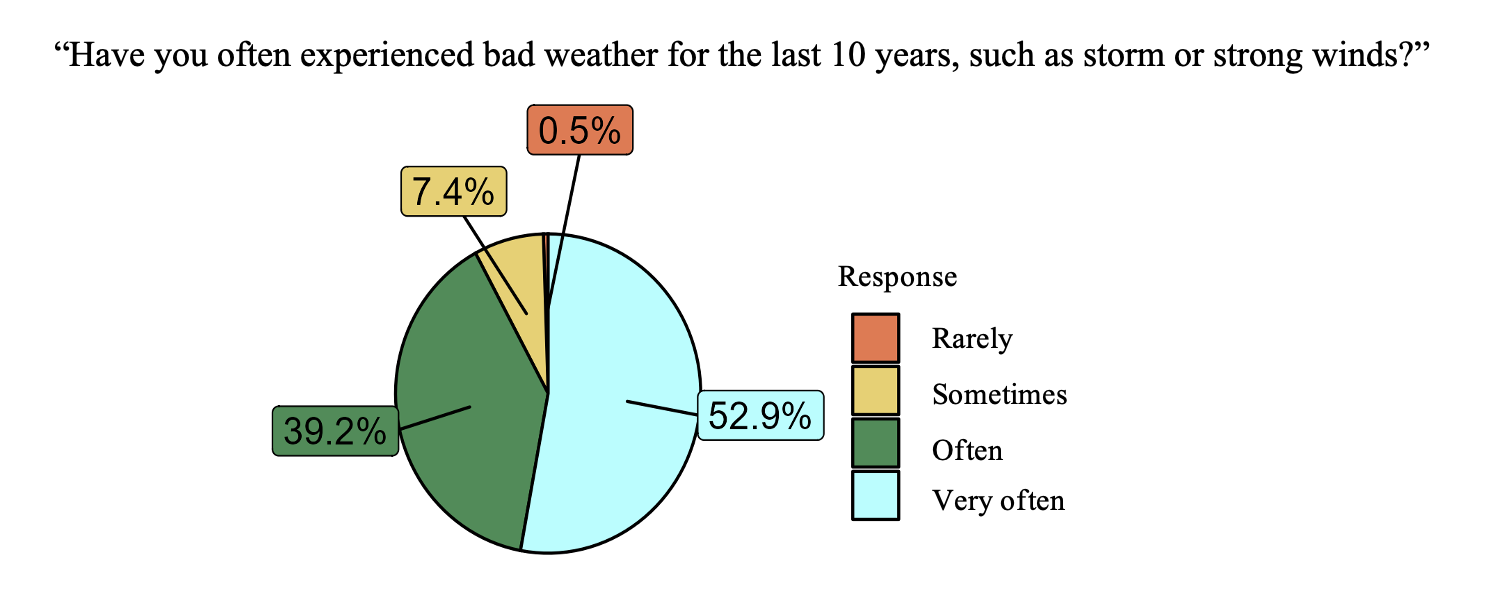
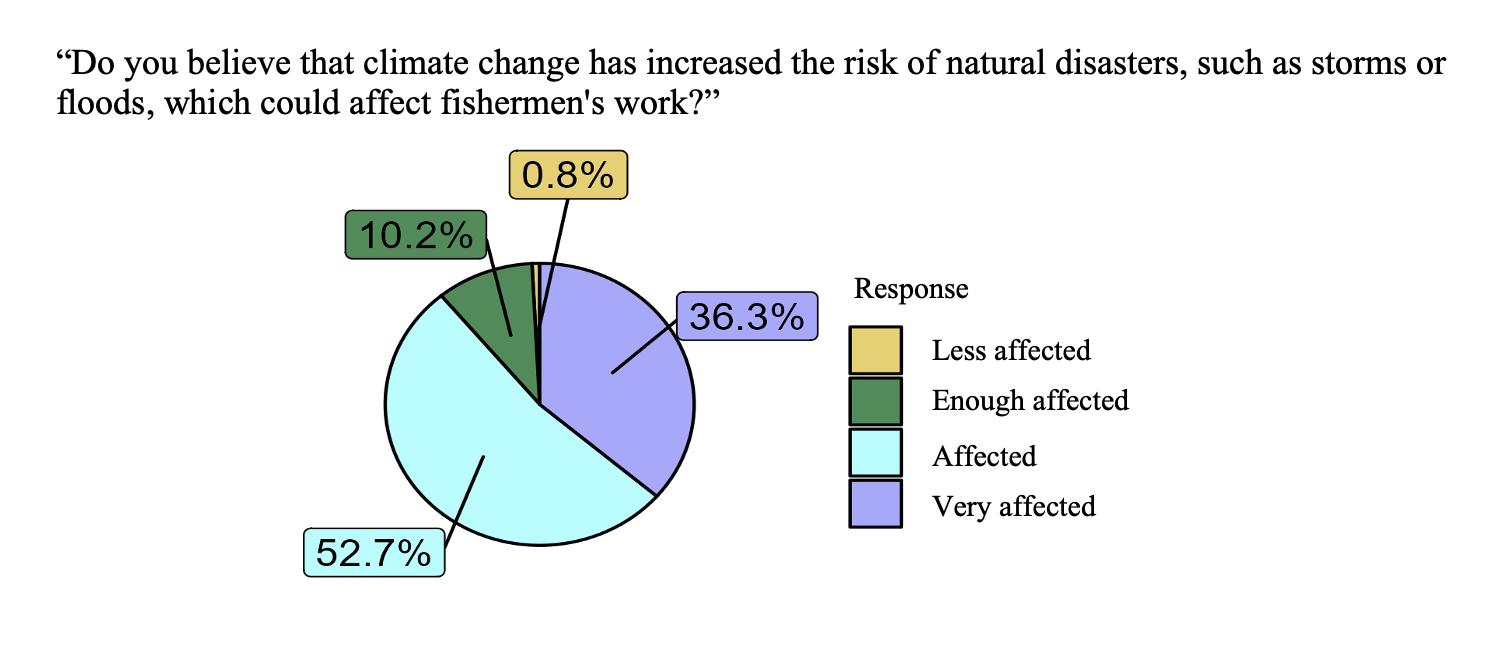
Just as the impact of climate change on variations in the number of catches affects fishermen, it also influences changes in operational costs experienced by them. From the survey, we find that there is a shifts in operational costs have led to a decrease in income from fish sales, with 31.7% reporting a significant decrease in the selling price of fish and 33.9% noting a substantial decrease. Moreover, the time required to reach fishing locations has increased. Fishermen have observed that a decade ago, fish abundance was notable, but now it has markedly declined. Additionally, the fishing grounds have moved farther away. These alterations pertaining to catches, operational costs, and fish quantities have left fishermen concerned about the viability of their fishing businesses.
3.4. Fishermen's level of economic vulnerability
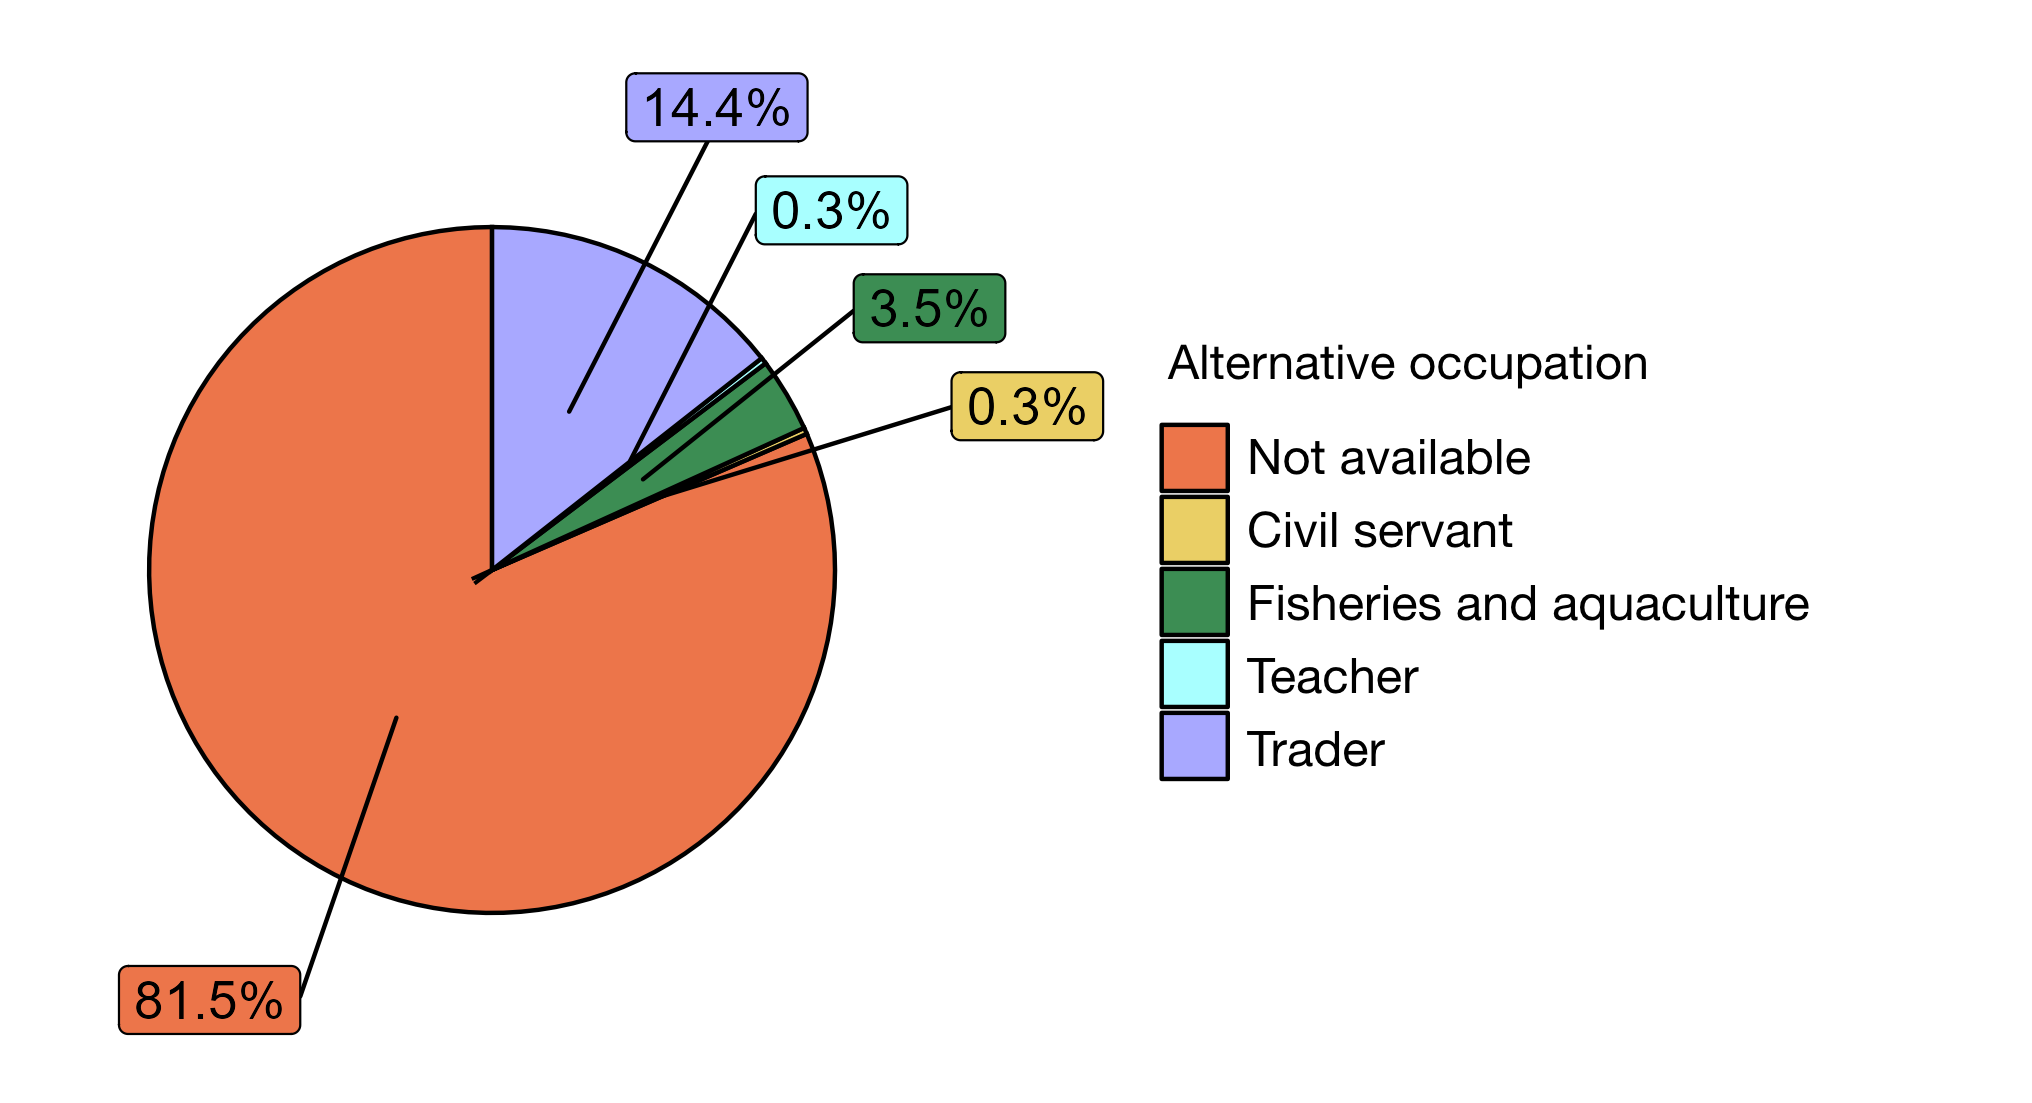
Alternative livelihoods other than fishermen were self-employed (traders), fisheries and aquaculture, teacher and civil servants. As many as 81.5% of respondents did not have any alternative jobs (Figure 4).
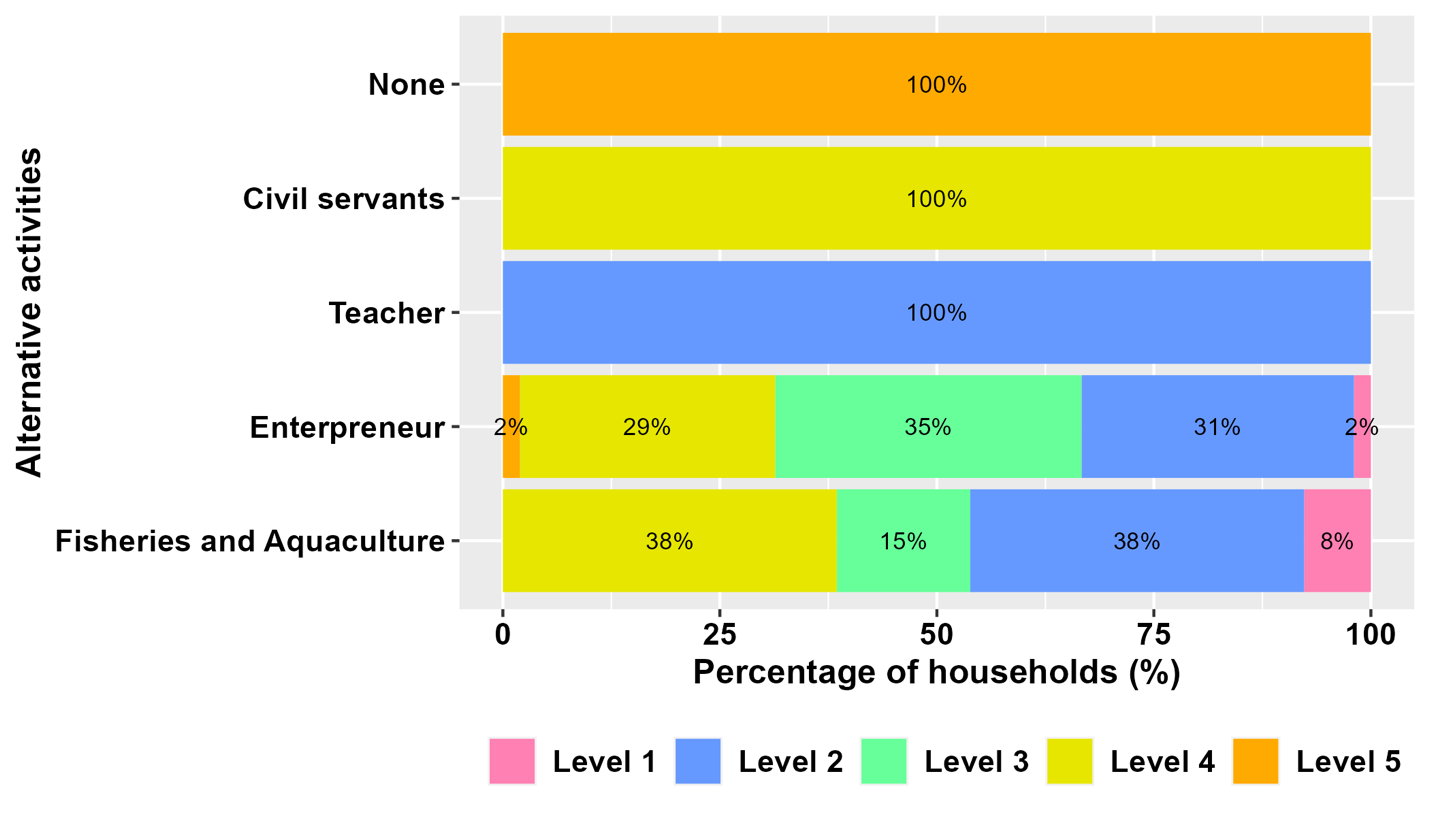
The availability of alternative jobs/livelihoods significantly impacts the level of vulnerability among fishermen. Fishermen with alternative livelihoods exhibit lower vulnerability levels compared to those without such options. Observational findings indicate that fishermen lacking alternative livelihoods typically experience vulnerability at level 5 (complete failure to recover). Conversely, among fishermen engaged in alternative jobs such as cultivation and fisheries, 38% demonstrate vulnerability levels at 2 (recovery between 50% - 100%) and 4 (recovery less than 25%). Additionally, 35% of fishermen involved in alternative occupations as entrepreneurs/traders exhibit vulnerability level 3 (recovery 25% - 50%) (Figure 5).
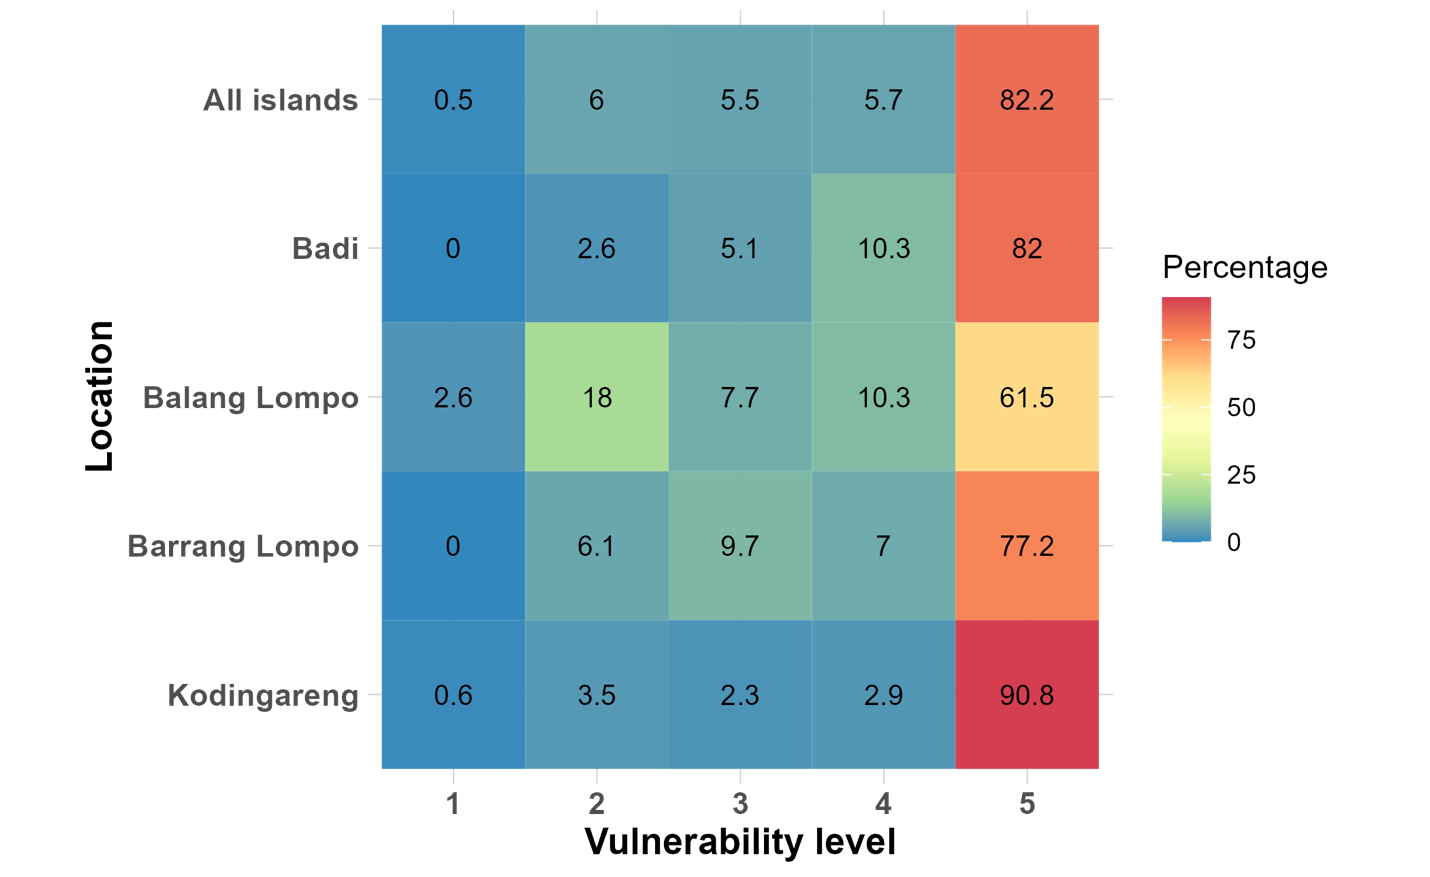
The level of economic vulnerability among fishermen is determined by three variables, namely fishermen's income, operating cost , and alternatives incomes. These variables are used to assess the extent to which extent respondents may struggle to recover economically if disturbances hit beyond their income as fishermen. Vulnerability levels are classified on a scale from 1 (least vulnerable) to 5 (most vulnerable).
Overall, the economic vulnerability level of fishermen across the four islands is at level 5 (very vulnerable), with 79.5% of respondents falling into this category, while only 0.8% are categorized at level 1 (Figure 6). This is a big alarm for small scale fishers to be able to stand and cope with any major disturbance from climate changes or extreme weathers. Distributionally, Figure 4 illustrates that among the four islands studied, Kodingareng Island has the highest percentage of respondents classified at vulnerability level 5, at 90.75%, whereas Balang Lompo Island exhibits the lowest percentage of vulnerability level 5 compared to the other islands, standing at 61.54%.
3.5. Adaptive Capacity Index (ACI)
ACI index consist of socio-economic aspect and perception of climate change (SN), Institutional dimension (SI), and Socio-Ecology dimension (SE). The average values of the dimensions and their respective indecis forming the ACI were presented in Table 7.
| Dimension | Index | |
|---|---|---|
| Description | Average value | |
| Social aspects, socio-economic dimension (SN) and perception to climate change | Poverty (POV) | 2.82 |
| Occupational characteristic (OCC) | 1.57 | |
| Fishing operational cost (BOP) | 1.63 | |
| Fisherman income (BON) | 1.86 | |
| Institution dimension (SI) | Cognitive social capital (CSC) | 2.76 |
| Perception to climate change (PCC) | 3.00 | |
| Socio-ecology dimension (SE) | Ability to anticipate change (AAD) | 2.89 |
The POV index, with a mean of 2.82, indicated that respondents often find it difficult to meet their needs, although there may be times when they have enough. This is likely due to factors such as the selling price of their catch, fishing costs, and resource availability.
The average BON weight (1.89) tends to be low, suggesting that a fisherman's income is still relatively low. This is despite the fact that the BOP (1.63) indicates that seafaring doesn't require high upfront costs. Even with the low income, most fishermen rely solely on this profession, which is highly dependent on natural conditions and resource availability. The low occupational characteristics (OCC) score suggests that fishing may be the only viable income option for these individuals, making it difficult to find or perform other types of work. Many times, this happens in the small island communities where not many other livelihood options are available outside fishing activities.
The climate changes experienced by fishers, particularly over the last decade, have solidified their awareness of the reality of climate change's impacts. The increased frequency and intensity of extreme weather events, along with the growing distance to natural resources (fish, shrimp, or shellfish), have been felt by respondents for a considerable amount of time, even by generations before them. This extended period of change has raised awareness, making respondents well-prepared to anticipate future climate change impacts. This is reflected in the AAD weight (2.89), which represents a middle value with supporting indices from CSC and PCC.
The CSC weight (2.76), which falls in a relatively mid-to-low range, indicates that fishers have a sufficient base of cognitive knowledge. This knowledge includes at least the characteristics of climate change and its anticipated future impacts. With this foundation of knowledge and discussions within their communities, respondents develop a sense of optimism in facing climate change and its effects. This is evidenced by the PCC weight, which holds a middle value of 3.00.
Using Ologit model, Table 8 shows that occupational, fishing operating cost and fishermen income are conditions significantly impacting the fishermen economic vulnerability.
| Variable | Estimation coefficient | Standard error | Z Value | P value |
|---|---|---|---|---|
| Poverty (POV) | -0.54134 | 0.29617 | -1.828 | 0.067578 |
| Occupational characteristic (OCC) | -1.28228 | 0.17285 | -7.419 | 1.0000013*** |
| Cognitive social capital (CSC) | -0.47471 | 0.22015 | -2.154 | 0..031211* |
| Perception to climate change (PCC) | -0.10219 | 0.20955 | -0.869 | 0.384597 |
| Ability to anticipate change (AAD) | 0.58458 | 0.26253 | 2.227 | 0.025965* |
| Fishing operational cost (BOP) | 0.75572 | 0.19571 | 3.861 | 0.000113*** |
| Fisherman income (BON) | -0.73439 | 0.21320 | -3.445 | 0.000572*** |
| Boat ownership | 0.50830 | 0.24509 | 2.874 | 0.038887* |
Table 8 shows that almost all the variables in the regression model are significantly different, only the variable of fishermen's perception of climate change is not significantly different. Even though the levels are different, the actual levels are different for each variable. This shows that these variables have a real influence on the economic vulnerability of fishermen in the research location.
4. Discussion
4.1. Fishermen's perceptions of climate change
Climate change refers to a situation wherein global weather patterns undergo alterations, leading to uncertainties in weather phenomena (Hidayati & Suryanto, 2015). Factors influencing this condition encompass changes in climate components such as temperature, rainfall, air humidity, wind direction, and cloud formation. The repercussions of climate change extend beyond variations in rainy and dry seasons and rising sea levels; they also impact various aspects of life, including the economy, health, food security, and environmental degradation. Directly affecting the marine fisheries sector, climate change profoundly impacts their income sources, which are highly contingent on climatic conditions. Interviews with fishermen reveal their awareness and experience of changes in the occurrence, frequency and types of extreme weather and changes in their catches due to those events.. Fishermen reported a noticeable decline in fish abundance compared to a decade ago, along with an increase in catchment distances and operational costs, causing concern for their fishing businesses. This aligns with previous research (Rahman et al., 2019) attributing catch declines to climate change, directly impacting fishermen's earnings. Nonetheless, fishermen perceive a climate shift compared to a decade ago. Climate change proves challenging for ordinary individuals to precisely identify and assess, particularly when relying solely on personal experience (Akerlof et al., 2013; Weber, 2010). Fishermen's responses regarding their perceptions of climate change include frequent tidal waves, alterations in the duration of rainy and dry seasons, and increasingly warmer sea temperatures, more and more floods in front of their houses, and sea abrasion happens around the island indicating their acknowledgment of ongoing climate change. According to Isdianto & Luthfi (2019), consequences of climate change encompass increased frequency of extreme weather events, shifts in rainfall patterns, and rising temperatures and sea levels.
4.2. Fishermen's level of economic vulnerability
The results revealed that the economic vulnerability of fishermen is primarily determined by the presence or absence of alternative income. Interviews across all islands in the research area indicated a vulnerability level of 5 (classified as "very vulnerable"), with over 60% of fishermen unable to recover economically from the impacts of climate change (Figure 4). Notably, Kodingareng Island, home to over 3000 fishermen, exhibited a vulnerability level 5 percentage of 90.75%, signifying its high vulnerability to climate change. Conversely, Balang Lompo Island showed a vulnerability level 5 percentage of 61.54%. Analysis of alternative employment data for each island revealed that 40% of fishermen on Balang Lompo Island held alternative jobs, while only 8.22% of fishermen on Kodingareng Island did (Figure 6). These findings underscore a significant relationship between alternative employment and fishermen's economic vulnerability. These findings align with previous research by Selvaraj et al (2022), who classified recovery levels and found that 8.46% of fishing households surveyed (11 households) had level 1 vulnerability, fully recovering from fishing losses with alternative activities. In contrast, 53.08% of households (69 individuals) unable to recover income from fishing were classified at level 5 vulnerability, which includes households with no additional fishing activities or alternative measures. The remaining 38.46% fell between levels 2 and 4. Moreover, the type of alternative work significantly influences fishermen's economic vulnerability. The study indicates that alternative occupations such as teaching, entrepreneurship/farming, and aquaculture exhibit a vulnerability level 2 (less vulnerable), indicating fishermen's ability to recover between 50% to 100% from adverse economic conditions due to climate change (Figure 6). These findings resonate with Sevaraj et al.'s (2022) research, which suggests that households employing diversification strategies and engaging in non-fishing activities are likely to reduce vulnerability. Expanding income streams not only diminishes dependence on natural resources but also guarantees long-term, sustainable livelihoods (Choden et al., 2020; Yomo et al., 2020). Moreover, the findings support previous studies suggesting that households depending on fisheries resources tend to have lower living standards, resulting in decreased diversification of income and restricted access to social, human, physical, and financial assets, consequently impacting perceptions of wealth (Martins & Gasalla, 2020).
4.3. Estimating the adaptation capacity index (ACI)
The model were designed to forecast the likelihood of households moving between different vulnerability levels, considering each aspect of their adaptive capacity. Vulnerability was defined as a categorical dependent variable with values spanning from 1 to 5. Each ACI index listed in Table 5 was included as an independent variable.
The resulting Poverty Index (POV = 2.82) indicates that most fishing households perceive themselves as relatively impoverished. Table 5 highlights that the infrastructure in their communities frequently lacks resilience against potential adverse climate events. Additionally, the low Occupational Characteristics Index (OCC = 1.57) suggests that the typical household exhibits restricted labor mobility and tends to rely on limited income sources. These findings suggest that both poverty and job characteristics significantly influence the economic vulnerability of fishermen. The higher the poverty level, the greater the economic vulnerability. Similarly, with limited job options, fishermen experience increased vulnerability. This corresponds to the findings of Selvaraj et al. (2022), illustrating a significant and inverse correlation between household work characteristics (OCC) and vulnerability. Households that adopt diversification strategies and engage in activities beyond fishing tend to experience reduced vulnerability. The heightened reliance of impoverished households on fishery resources exacerbates their vulnerability, as evidenced by other studies emphasizing rural household livelihood diversification as a key strategy for mitigating the impacts of climate change (Chepkoech et al., 2020; Choden et al., 2020; Martins & Gasalla, 2020; Yomo et al., 2020). Fishermen said that if he could not change livelihood from fishing, he hopes that his children could do that someday or get a better occupation outside fishery or within fishery. On these island, many of the your fishers are going to colleges studying at the Marine and fisheries department at the University of Hasanuddin.
The Cognitive Social Capital Index (SCS) has a value of 2.76, indicating that fishermen in the research location generally possess sufficient knowledge about climate change, including its characteristics and anticipated future impacts. This knowledge capital, combined with discussions within their communities, fosters a sense of optimism in facing climate change and its effects .
The SCS value suggests a significant relationship with vulnerability. These results are in line with earlier studies conducted by Agrawal & Perrin (2009) and Wang et al (2013), which revealed a notable and adverse correlation with household vulnerability. This underscores the significance of informal institutions grounded in reciprocity, solidarity, and cooperation in mitigating the vulnerability of fishing households.
The Perception of Climate Change Index (PCC) and the Ability to Anticipate Change Index (AAD) have values of 3.00 and 2.89, respectively, and exert a significant influence on vulnerability. The high value of the PCC index suggests that fishermen's perception of climate change and their ability to anticipate these changes can reduce their vulnerability. However, the relatively small difference between the two indices necessitates caution. The data may not be conclusive enough to definitively establish the influence of PCC and AAD indices on the vulnerability of fishermen in this specific location. While Selvaraj et al. (2022) suggest that coefficients associated with model variables like POV, PCC, AAD, and boat ownership have an influence, their findings did not reach statistical significance. Therefore, the available evidence is insufficient to draw definitive conclusions regarding their impact on the vulnerability of fishing households.
The research results also reveal that operational costs (BOP) and fishermen's income (PON) are other index values significantly influencing fishermen's vulnerability. These two variables have index values of 1.63 and 1.86, respectively (Table 5). Based on the Ologit analysis results, the real difference values were 0.000113 and 0.000572 (Table 6). These findings indicate that both operational costs and fishermen's income substantially influence the economic vulnerability of fishermen. Although the index values are relatively small, the difference values are actually quite large. This suggests that these two indices have a significant real-world impact on the economic vulnerability of fishermen. Although fishers in these island could change to other fishery commodity such as sea cucumber with very high value as fishing crew in 2009, they faced constraints of competition with other fishers from other provinces.
5. Conclusions
This research explored how fishing communities in the Spermonde Islands can brace themselves for climate change's potential blows. It pinpointed the key factors that determine their ability to adapt to a changing climate. By finding alternative income streams beyond fishing, these communities can lessen their reliance on a single resource. This diversification strategy equips them to anticipate and weather potential economic shocks brought on by climate change, especially if they can access broader markets. However, limited education and a lack of robust social policies and interventions create roadblocks for income diversification, further hindering their ability to boost their earnings.
Education is key to save the next fishers generation as it acts as tool to diversify their future job both within fishing sector or other sector as education can opens up other more work opportunities.
For fishing families who stick solely to fishing, tough times are more likely when changes hit. This study helps us pinpoint the strengths that make communities better able to adapt to these changes. The research shows that households with diverse job options, flexible work arrangements, strong social support networks, and reduced reliance on fishing are more likely to be economically resilient. This translates to a better ability to anticipate and weather the potential economic blows of climate change.
Acknowledgments
The MFP IV Hasanuddin University research team would like to thank the Indonesian Conservation Strategy Foundation for funding this research with contract number GA05-CSFIDN-MFPIV-2023. We would also like to thank the Makassar City and Pangkep Regency Fisheries Office for giving permission to the research team to collect data and we would like to thank the Makassar City and Pangkep Regency extension team for providing assistance in collecting respondents when the interviews were carried out. To the team of enumerators (Rahma, SPi., Dian Islamia, A. Nadia Mughsita Sani, and Dian Ayu Resky Catur P), we would like to thank for their hard work in collecting data.
References
- Adger, W. N. (2006). Vulnerability. Global Environmental Change, 16(3), 268–281. https://doi.org/10.1016/j.gloenvcha.2006.02.006
- Agrawal, A., & Perrin, N. (2009). Climate adaptation, local institutions and rural livelihoods. Adapting to Climate Change, 350–367. https://doi.org/10.1017/cbo9780511596667.023
- Akerlof, K., Maibach, E. W., Fitzgerald, D., Cedeno, A. Y., & Neuman, A. (2013). Do people “personally experience” global warming, and if so how, and does it matter? Global Environmental Change, 23(1), 81–91. https://doi.org/10.1016/j.gloenvcha.2012.07.006
- Allison, E. H., Perry, A. L., Badjeck, M. C., Neil Adger, W., Brown, K., Conway, D., Halls, A. S., Pilling, G. M., Reynolds, J. D., Andrew, N. L., & Dulvy, N. K. (2009). Vulnerability of national economies to the impacts of climate change on fisheries. Fish and Fisheries, 10(2), 173–196. https://doi.org/10.1111/j.1467-2979.2008.00310.x
- Badjeck, M.-C., Allison, E. H., Halls, A. S., & Dulvy, N. K. (2010). Impacts of climate variability and change on fishery-based livelihoods. Marine Policy, 34(3), 375–383. https://doi.org/10.1016/j.marpol.2009.08.007
- Chepkoech, W., Mungai, N. W., Stöber, S., & Lotze-Campen, H. (2020). Understanding adaptive capacity of smallholder African indigenous vegetable farmers to climate change in Kenya. Climate Risk Management, 27(October 2018), 100204. https://doi.org/10.1016/j.crm.2019.100204
- Cheung, W. W. L. (2018). The future of fishes and fisheries in the changing oceans. Journal of Fish Biology, 92(3), 790–803. https://doi.org/10.1111/jfb.13558
- Cheung, W. W. L., Lam, V. W. Y., Sarmiento, J. L., Kearney, K., Watson, R., Zeller, D., & Pauly, D. (2010). Large-scale redistribution of maximum fisheries catch potential in the global ocean under climate change. Global Change Biology, 16(1), 24–35. https://doi.org/10.1111/j.1365-2486.2009.01995.x
- Choden, K., Keenan, R. J., & Nitschke, C. R. (2020). An approach for assessing adaptive capacity to climate change in resource dependent communities in the Nikachu watershed, Bhutan. Ecological Indicators, 114(1140), 106293. https://doi.org/10.1016/j.ecolind.2020.106293
- Daw, T., Adger, W. ., Brown, K., & Badjeck, M. (2009). Climate change and capture fisheries: potential impacts, adaptation and mitigation. Climate Change Implications for Fisheries and Aquaculture, 107–151.
- Galappaththi, E. K., Ford, J. D., Bennett, E. M., & Berkes, F. (2021). Adapting to climate change in small-scale fisheries: Insights from indigenous communities in the global north and south. Environmental Science and Policy, 116, 160–170. https://doi.org/10.1016/j.envsci.2020.11.009
- Gallopín, G. C. (2006). Linkages between vulnerability, resilience, and adaptive capacity. Global Environmental Change, 16(3), 293–303. https://doi.org/10.1016/j.gloenvcha.2006.02.004
- Gattuso, A. J., Magnan, A., Billé, R., Cheung, W. W. L., Howes, E. L., & Joos, F. (2015). Contrasting Futures for Ocean and Society from Different Anthropogenic CO2 Emissions Scenarios. Science, 349, 6243.
- Hidayati, I. N., & Suryanto, S. (2015). Pengaruh Perubahan Iklim Terhadap Produksi Pertanian Dan Strategi Adaptasi Pada Lahan Rawan Kekeringan. Jurnal Ekonomi & Studi Pembangunan., 16(1), 42–52. https://doi.org/10.18196/jesp.16.1.1217
- IPCC. (2002). Draft Report Of The Nineteenth Session Of The Intergovernmental Panel On Climate Change (IPCC).
- Isdianto, A., & Luthfi, O. M. (2019). Persepsi Dan Pola Adaptasi Masyarakat Teluk Popoh Terhadap Perubahan Iklim. Jurnal Ilmu Kelautan SPERMONDE, 5(2), 77. https://doi.org/10.20956/jiks.v5i2.8935
- Lam, V. W. Y., Cheung, W. W. L., Reygondeau, G., & Rashid Sumaila, U. (2016). Projected change in global fisheries revenues under climate change. Scientific Reports, 6, 6–13. https://doi.org/10.1038/srep32607
- Maldonado, J. H., & Moreno-Sanchez, R. P. (2014). Estimating the Adaptive Capacity of Local Communities at Marine Protected. Ecology and Society, 19(1), 16.
- Martins, I. M., & Gasalla, M. A. (2020). Adaptive Capacity Level Shapes Social Vulnerability to Climate Change of Fishing Communities in the South Brazil Bight. Frontiers in Marine Science, 7(July), 1–11. https://doi.org/10.3389/fmars.2020.00481
- Pitcher, T. J., & Cheung, W. W. L. (2013). Fisheries: Hope or despair? Marine Pollution Bulletin, 74(2), 506–516. https://doi.org/10.1016/j.marpolbul.2013.05.045
- Portner, H.-O., Karl, D. M., Boyd, P. W., Cheung, W. W. L., Lluch-Cota, S. E., Nojiri, Y., Schmidt, D. N., & Zavialov, P. O. (2014). Ocean System - cap6 IPCC 5. In Climate Change 2014: Impact, Adaptation, and Vulnerability. Part A: Global and Sectoral Aspects. Contribution of Working Group UU to the Fifth Assessment Report of the Intergovermental Panel on Climate Change. (pp. 411–484). Cambridge University Press.
- Rahman, M., Toiba, H., & Efani, A. (2019). Pekerjaan Alternatif Sebagai Strategi Adaptasi Nelayan terhadap Perubahan Iklim (Studi Kasus di Kecamatan Paiton, Kabupaten Probolinggo). Habitat, 30(1), 1–7. https://doi.org/10.21776/ub.habitat.2019.030.1.1
- Selvaraj, J. J., Guerrero, D., Cifuentes-Ossa, M. A., & Guzmán Alvis, Á. I. (2022). The economic vulnerability of fishing households to climate change in the south Pacific region of Colombia. Heliyon, 8(5). https://doi.org/10.1016/j.heliyon.2022.e09425
- Smit, B., & Wandel, J. (2006). Adaptation, adaptive capacity and vulnerability. Global Environmental Change, 16(3), 282–292. https://doi.org/10.1016/j.gloenvcha.2006.03.008
- Sreya, P. S., Parayil, C., Aswathy, N., Bonny, B. P., Aiswarya, T. P., & Nameer, P. O. (2021). Economic vulnerability of small-scale coastal households to extreme weather events in Southern India. Marine Policy, 131(June), 104608. https://doi.org/10.1016/j.marpol.2021.104608
- Suresh, K., Khanal, U., Wilson, C., Managi, S., Quayle, A., & Santhirakumar, S. (2021). An economic analysis of agricultural adaptation to climate change impacts in Sri Lanka: An endogenous switching regression analysis. Land Use Policy, 109(June), 105601. https://doi.org/10.1016/j.landusepol.2021.105601
- Wang, J., Brown, D. G., & Agrawal, A. (2013). Climate adaptation, local institutions, and rural livelihoods: A comparative study of herder communities in Mongolia and Inner Mongolia, China. Global Environmental Change, 23(6), 1673–1683. https://doi.org/10.1016/j.gloenvcha.2013.08.014
- Weber, E. U. (2010). What shapes perceptions of climate change? Wiley Interdisciplinary Reviews: Climate Change, 1(3), 332–342. https://doi.org/10.1002/wcc.41
- Yomo, M., Villamor, G. B., Aziadekey, M., Olorunfemi, F., & Mourad, K. A. (2020). Climate change adaptation in Semi-Arid Ecosystems: A case study from Ghana. Climate Risk Management, 27(June 2019), 100206. https://doi.org/10.1016/j.crm.2019.100206
