Plastic litter assessment of the riverbanks of Pulot River and its tributary in Sofronio Española, Palawan Island, Philippines
Abstract
Rivers are essential sources of plastic litter in the marine environment. Recently, the Philippines was reported as the biggest polluter of plastic litter from riverine sources. However, the riverine plastic litter's origin has been less established. In this study, we determined the density, composition, and accumulation of plastic litter on the riversides of Pulot River and its tributary in Palawan Island, Philippines. We also identified the possible sources of plastic litter. Results showed that the plastic litter density was highest at the river edge during the first sampling period. Litter densities for the predefined zones and sampling periods all showed no significant differences. The most dominant plastic litter types were food packaging and plastic bags, followed by toiletries. ‘Others’ consisted of multilayers, mixed, and plastics accounted for the most abundant polymer types. We identified the residents in the vicinity illegally dumping litter, for there were small illegal dumping sites along the river. These results suggest the urgent need for better waste policy implementation measures to protect the riparian environments and reduce the input of riverine plastic litter into the marine environment to ensure river resource sustainability.
Keywords
Spatio-temporal variation, plastic composition, riverbank, sustainability
Introduction
Marine pollution due to anthropogenic litter (particularly plastics), which has been globally recognized as a threat to ecology and human well-being, has received much scientific and public attention (Thompson et al., 2009; Kühn et al., 2015; Newman et al., 2015; Gaboy et al., 2022; Acot et al., 2022). Although studies showed that many plastic litter originates from sea-based sources, such as fishing and aquaculture, the main share of marine pollution stems from land-based sources and reaches the sea via riverine transport (Galgani et al., 2000; GESAMP, 2010; Andrady, 2011, Rech et al., 2014, González-Fernández et al., 2021; Requiron & Bacosa, 2022). In 2010, an estimated 12.7 million tons of plastics entered the marine environment from coastal sources alone (Jambeck et al., 2015), and this volume has significantly grown through the years.
In contrast, rivers are empirically observed as significant transport routes of anthropogenic plastic litter into the ocean, and these litters originate from the population living farther inland (Willoughby, 1986; Tudor & Williams, 2004: Shimizu et al., 2008; Laglbauer et al., 2014; Rangel-Buitrago et al., 2017; Newbould, 2021). Plastic waste transported by rivers has severe ecological consequences when it reaches the coastal environment. It can result in marine organism entanglement, leading to injuries, suffocation, and death (van Emmerick et al., 2020b). Additionally, plastic ingestion causes digestive blockages, internal injuries, and starvation in marine species. Moreover, the accumulation of plastics in coastal areas can alter habitats and disrupt ecosystems, and, it can also act as vectors of harmful pollutants and invasive species. A recent study shows that the global annual plastic emissions from rivers into the ocean range from about 0.8 million and 2.7 million metric tons (Meijer et al., 2021). Models suggest that 1,000 rivers account for nearly 80 percent of global annual emissions, with small urban rivers among the most polluting (Meijer et al., 2021). While several studies suggested the importance of rivers as primary sources of marine pollution by plastics and other litter, there are very few studies that provide quantitative data on the amounts and types of litter present in rivers, particularly in the Philippines.
Riverbanks play significant roles as temporary sinks for the deposition of plastic litter. Potential sources of plastic litter pollution in riverbanks are numerous, such that it can originate from recreational activities in the vicinity (Gasperi et al., 2014; McCormick & Hoellein, 2016; Carpenter & Wolverton, 2017; Keissling et al., 2019; Harris et al., 2021) or areas of high urban activity (Armitage, 2007; Carson et al., 2013; Keisling et al., 2019). People intentionally depositing litter are often responsible for a larger share of accumulations of household items on the riverbanks (Williams & Simmons, 1997a; 1999; Rech et al., 2015; McCormick & Hoellein, 2016; Keissling et al., 2019). The lack of access to regular waste collection infrastructure, with the absence of a domestic sewage system, results in the littering of household items by the residents (Franz & Freitas, 2011; Di & Wang, 2017; Keissling et al., 2019). After a long dry period when accumulated plastic litter washed into the rivers via stormwater runoff, large quantities of it enter the river (Williams & Simmons, 1999; Armitage, 2007; Ryan et al., 2009; Moore et al., 2011; de Barros et al., 2014). On the other hand, land use and social-economic activities in the riverbank area can be linked to the abundance and composition of litter in rivers. (Williams & Simmons, 1999; Shimizu et al., 2008; Carson et al., 2013; Lechner et al., 2014).
The Philippines is considered the biggest contributor of plastic litter from rivers into the ocean in the world (Meijer et al., 2021). With 4,820 contributing rivers, including those in Palawan, local rivers are (estimated) emitting 356,371 MT of plastics per year. Established literature on river litter pollution focused on the river as a pathway for buoyant debris (they quantify the number of items that are already on the move) within a river (Moore et al., 2011; Gasperi et al., 2014; Lechner et al., 2014; Morritt et al., 2014; Mani et al., 2015; Requiron & Bacosa, 2022). However, anthropogenic litter on the shores or in the vicinity of rivers has been studied less frequently (Williams & Simmons, 1997b, 1999; Rech et al., 2014; 2015; McCormick & Hoellein, 2016).
Rivers are likely among the principal sources of litter flowing toward the sea. For example, heavy rainfall, subsequent flooding, and strong wind (Moore et al., 2011; Carson et al., 2013; Veerasingam et al., 2016) can mobilize litter deposited on the riverside. Additionally, the Covid-19 epidemic exacerbated plastic litter in the Philippines through improper disposal of facemasks, PPEs, and face shields (Limon et al., 2022; Apostol et al., 2022) – which we argue is not only a pressing concern for the Philippines, but a global phenomenon precipitated by the pandemic (Khoo et al., 2021; and Leal Filho et al., 2021).
With a span of 15 kilometers of winding natural channel from the watershed, and a primary river in Sofronio Española, Palawan that runs through the town center, Pulot River offers ideal conditions for the study of plastic litter in the riverbanks. In previous studies, plastic litter on coastal beaches in Palawan explained as originating from local sources (Cayabo et al., 2020; Sajorne et al., 2021; Sumeldan et al., 2021; Sajorne et al., 2022), including rivers. However, the density, abundance, accumulation rates, and types of litter on the riverbanks in the Philippines remain understudied. Riverbank litter monitoring is essential for the reduction of riverine litter, as they provide the data required to identify and characterize litter items, their sources, and variation over time and space.
In this paper, we present an analysis of a two-month macroplastics litter monitoring in the Pulot River and its tributary. With this paper, we aim to determine the spatio-temporal variations of plastic litter density, determine the abundance of plastic items and polymer type, determine the sources of plastic litter, and quantify and compare the weekly and daily accumulations of plastic litter in the riverbanks of Pulot River and its tributary. The result of this study provides insight into the variations in the density of plastic litter, accumulations, and the most abundant litter items and polymer types in the riverbanks of Pulot River and its tributary.
Methods
Study Area
The Municipality of Sofronio Española is in southern Palawan, Philippines along its eastern seaboard, beginning at kilometer 128.1 to kilometer 166 of the National Highway (Puerto Princesa City, South Road). It lies approximately between 8 53’3.58” to 9 11’26.26” North and 117 51’24.42” to 118 7’35.58” East. The number of residents in Española steadily increased from 32,876 in 2015 to 37,416 in 2020.
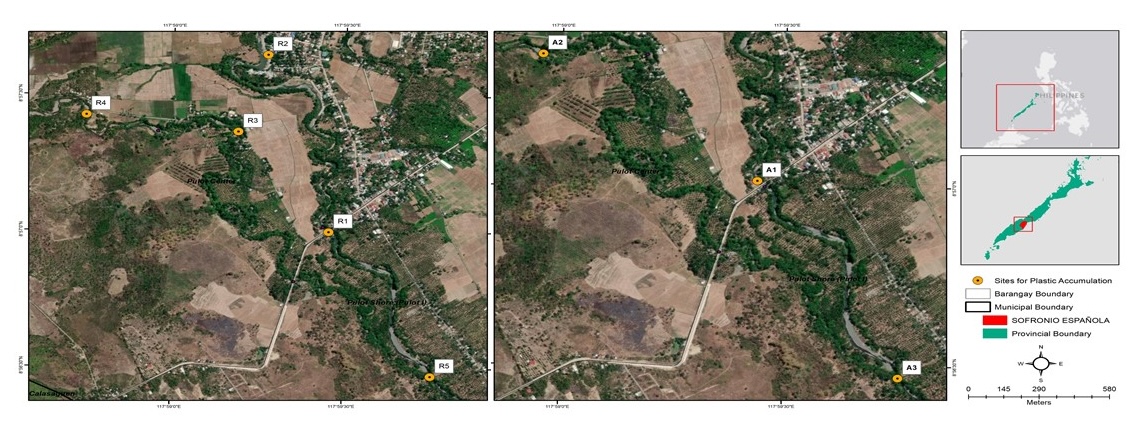
The Pulot watershed is the sole delineated catchment area or watershed in the municipality. It occupies a total area of 18,158 hectares, of which 17,186 hectares are within the territory of Española. Pulot River spans 15 km of winding natural water channel from the Pulot watershed. It is one of the major rivers in Sofronio Española that runs through the town center. We randomly selected our study sites for plastic density and plastic accumulations (Figure 1). “Plastic density is referred to the number of plastic litter based on item per count. Synthesizing studies, on the other hand, plastic accumulations are the number of plastic debris arriving in the sapling area at a time interval.” To determine the plastic litter count and category, plastics were collected in five randomly selected sampling locations (R1, R2, R3, R4, R5) along Pulot River and its tributary (Figure 1, Table 1).
For the purpose of the study, the surveyed riversides were divided into three areas - the river edge, the riverbank, and the river crest. The river edge (0 - 5 m from the water’s edge) is in permanent contact with the stream and stretches from the water’s edge to no more than 5 m from the shore. The riverbank (5 m - 10 m away from the water’s edge) covers the area up to the river’s high-water mark and is in occasional contact with the stream, while the river crest (10 m - 15 m away from the water’s edge) is situated outside of the riverbed and is not in contact with the river, even at record water stands (Keissling et al., 2019).
| Sampling Sites (Codes) | Location | Watercourse type | Latitude | Longitude |
|---|---|---|---|---|
| R1 | Barangay Pulot Center | Main River | N 8º57’0” | E 117º59’28” |
| R2 | Barangay Pulot Center | Main River | N 8º57’39” | E 117º59’17” |
| R3 | Barangay Pulot Center | Distributary | N 8º57’22” | E 117º59’12” |
| R4 | Barangay Pulot Center | Distributary | N 8º57’23” | E 117º58’1” |
| R5 | Barangay Pulot Shore | Main River | N 8º55’45” | E 118º0’44” |
To obtain the data on plastic accumulation, plastic litter were collected in three randomly selected sampling locations (A1, A2, A3) along Pulot River and its tributary (Figure 1, Table 2). Note that the sampling sites for plastic litter count and category was different from the sites where accumulations of plastic litters were collected.
| Sampling Sites (Codes) | Location | Watercourse type | Latitude | Longitude |
|---|---|---|---|---|
| A1 | Barangay Pulot Center | Main river | N 8º57’1” | E 117º59’27” |
| A2 | Barangay Pulot Center | Distributary | N 8º57’22” | E 117º58’58” |
| A3 | Barangay Pulot Shore | Main river | N 8º55’47” | E 118º0’42” |
The surveyed sites were randomly selected heterogeneously with regard to their substrata, vegetation profile, accessibility, proximity to human settlements, and river course characteristics. The substrata comprised mainly of soil, often intermingled with pebbles and rocks. The vegetation mainly consisted of bamboo, bushes, reed, and grass, which reached the river’s edge and occasionally into the river. All five sampling locations are along areas with the presence of human settlements.
Plastic Litter Collection
Plastic litter was collected on five randomly selected sampling sites on the riverbank of Pulot River and its tributary by modifying the methods of Rech et al. (2014) and Keissling et al. (2019). Briefly, three transects were established perpendicular to the river course. Each transect consisted of three sampling stations, one in each predefined zones: the river edge (0 - 5 m distance to the river, assumed to have regular contact with it, the riverbank (5 m - 10 m distance to the river, irregular contact with water during flood events), and the river crest (10 m - 15 m, distance from the river, not in contact with water).
Each transect is 10 meters away from the other. At each station, 5 m by 4 m meter quadrats were established. All plastic litter found inside the quadrats was collected, weighed, counted, and classified according to type. The collection was done twice per month (every other 15 days) between the rainy season of 05 June and 07 August 2021. It is important to note that the rainy season in Palawan is generally from June to August, however, the frequency and intensity of precipitation vary annually and are influenced by regional and global weather. In addition, recent changes in weather patterns also affect the duration and intensity of the rainy season. These factors affect the transport of plastic litter from land to the coastal environment during the sample collection.
Plastic Litter Classification
Plastic litter was distinguished according to types which include food packaging, plastic bags, plastic cups, sacks, disposable utensils, food containers, napkins and diapers, ropes, plastic fragments, Styrofoam, medicinal packaging/waste, nylon fishing line, footwear, plastic bottles, plastic caps, fishing nets, other jugs, disposable, cigarette lighters, six-pack rings, straws, toiletries, buoys and floats, rubbers, and tetra-packs (Sajorne et al., 2021, Inocente & Bacosa., 2022; Requiron & Bacosa 2022; Acot et al., 2022). A seven-polymer category: polyethylene terephthalate (PET), high-density polyethylene (HDPE), polyvinyl chloride (PVC), low-density polyethylene (LDPE), polypropylene (PP), polystyrene (PS), and Others (O), was utilized to further categorized the litter types into polymer types. (Sajorne et al., 2021). Mixed and multilayer polymers are included in the ‘Others’ category.
Plastic Litters Accumulation
A 10 m x 10 m (100 m²) quadrat was established on each sampling station along Pulot River and its tributary. The plastic items collected on the first day of the weekly plastic collection were recorded as the ‘standing stock’. All plastic debris “arriving” at an interval of six days, thereafter, was recorded as plastic accumulations for weekly measurements. A weekly collection of plastics was done between 07 June and 12 July 2021. Right after the weekly collections of plastics litters, a daily collection was done simultaneously for seven consecutive days to obtain accumulation data for daily measurements. Daily sampling was conducted between 13 July and 19 July 2021. This method was modified from a previous study by Keissling et al., (2019).
Data Analysis
The density and composition of collected plastic litters was determined utilizing the computations of Abreo et al., (2019):
Plastic Litters Density [items/m²] = \( \frac{Number\ of\ items}{Total\ area\ sampled(L\times W)(m^2)} \)
Abundance of Plastic Litters = \( \frac{\mathrm{Numbers\ of\ item\ per\ category}}{\mathrm{Total\ numbers\ of\ items\ in\ all\ category}}\mathrm{\times100} \)
In the analysis of the spatial and temporal variation, the data were lumped in space and time. To analyze the spatial variation, the data average over time for the total measurement period (four sampling rounds) was calculated. For the temporal variations, data were lumped together over space, for all three zones (the river edge, the riverbank, and the crest) of all sampling locations. One-way analysis of variance (ANOVA) was utilized to test the difference in the density of plastics per sampling rounds and per predefined zones and subjected to a Post Hoc test (Tukey's test) to compare the means.
Results and Discussion
A total of 2,856 plastic litter was collected from all the sites after the four sampling rounds of collection. Among these, 1,292 were taken from the river’s Edge, 587 from the Riverbank, and 707 plastic litter from the River Crest (Table 3). The total mean density of plastic items counted was 0.73 items/m.
| Sampling Location | Litter Count | Weight (g) | Density (items/m²) ± SD | Mass (grams/ m²) |
|---|---|---|---|---|
| River Edge | 1,292 | 524.85 | 1.08 ± 0.48 | 0.44 |
| Riverbank | 587 | 116.6 | 0.49 ± 0.24 | 0.10 |
| River Crest | 707 | 159.05 | 0.62 ± 0.16 | 0.13 |
A total of 1,039 was collected during the first sampling, 584 during the second sampling, 500 during the third sampling, and 463 during the fourth sampling (Table 4).
| Sampling Period | Litter Count | Weight (g) | Density (items/m²) ± SD | Mass (grams/m²) |
|---|---|---|---|---|
| First Sampling | 1039 | 515.67 | 1.15 ± 0.55 | 0.57 |
| Second Sampling | 584 | 192.33 | 0.65 ± 0.26 | 0.21 |
| Third Sampling | 500 | 184.73 | 0.60 ± 0.24 | 0.21 |
| Fourth Sampling | 463 | 174.6 | 0.51 ± 0.21 | 0.19 |
To assess the spatial variations of the plastic litter density between the three predefined zones of the riverbanks, we combined mean litter density for all periods of measurement. The highest plastic litter mean density and mass was measured at the River Edge (1.08 items/m²; 0.44 g/m²)), and the lowest was measured at the Riverbank (0.62 items/m²; 0.13 g/m²) (Table 3). The density of plastic litter between three predefined zones of the riverbanks of Pulot River shows no significant difference (P=0.07).
For all predefined zones combined, the space-averaged mean plastic litter density and mass is the highest during the first sampling (1.15 items/m²; 0.57 g/m²), and the lowest during the fourth sampling (0.51 items/m²; 0.19 g/m²) (Table 4). However, the plastic litter density during the different periods of measurements showed no significant difference (P=0.17).
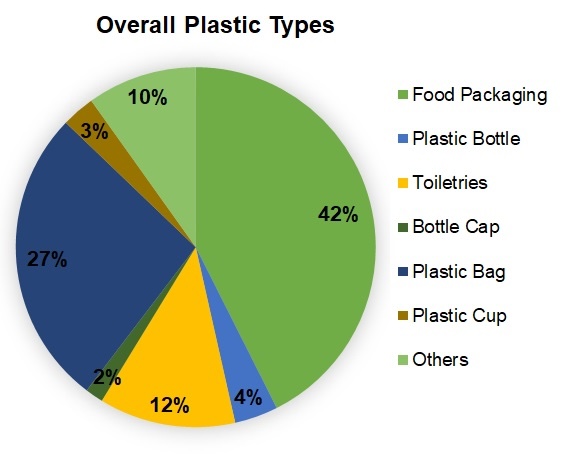
Between June and July 2021, a total of 2,586 plastic items were sampled on five sampling sites along Pulot River and its tributary. The most abundant specific items on the top 3, (82% of total) of overall plastic litters includes: 1,086 are food packaging (42%), 698 are plastic bags (27%), and 310 are toiletries (12%) (Figure 2).
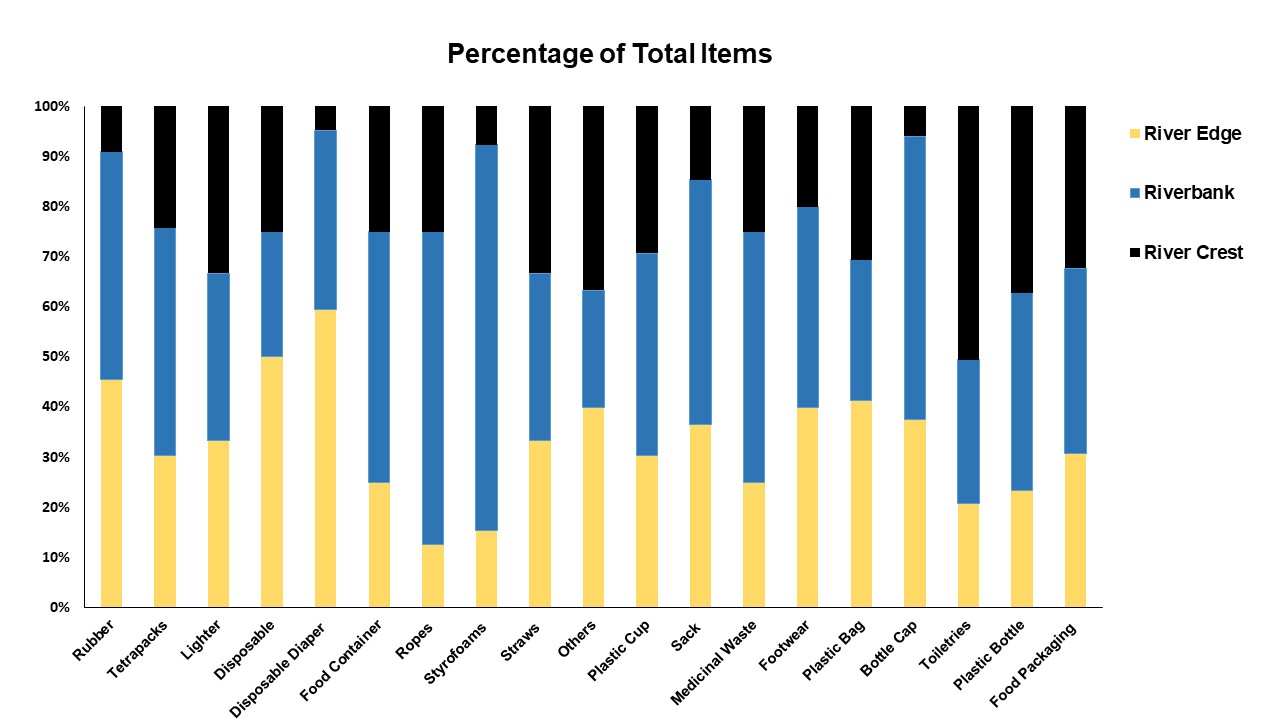
The top three most dominant plastic type on the River Edge (83% of total) includes food packaging (40%), plastic bags (31%), and other plastics (12%); Riverbank (81% of total) includes food packaging (48%), plastic bags (21%) and toiletries (12%); River Crest (82% of total), includes food packaging (42%), plastic bags (23%), toiletries (17%) (Figure 3).
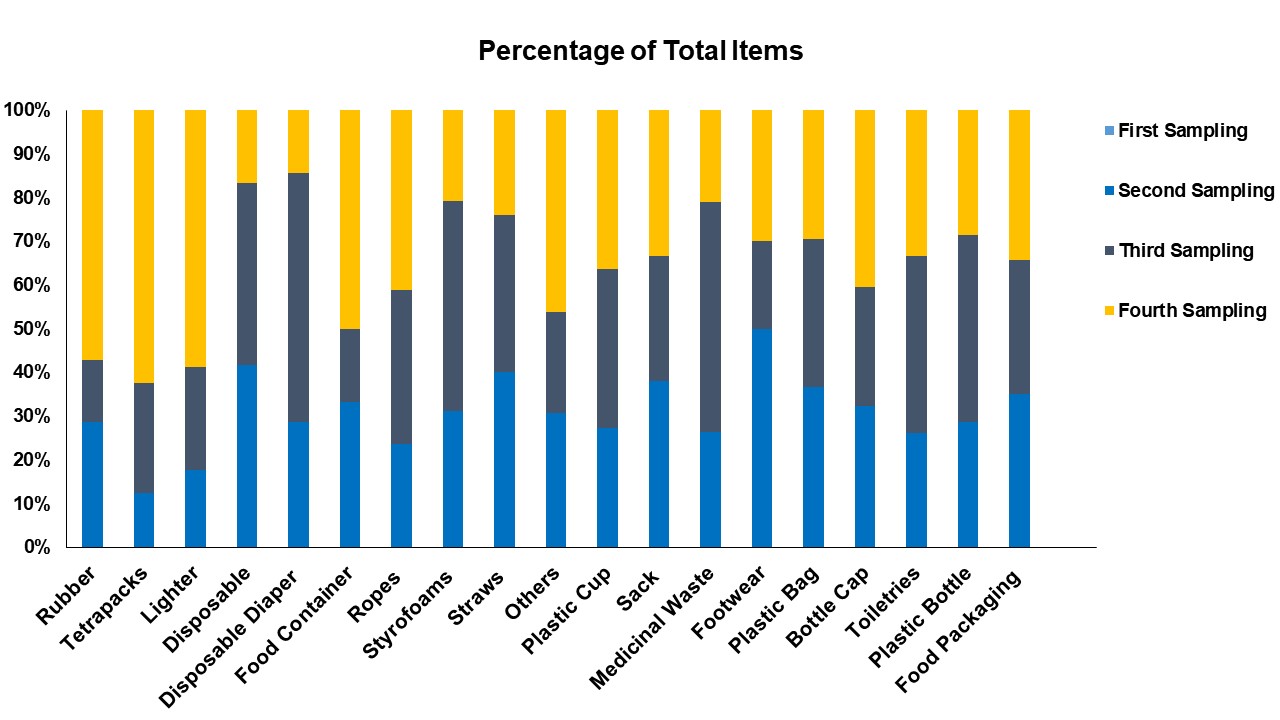
The top three most dominant litter type during the first sampling (79% of total) include food packaging (39%), plastic bags (31%), and toiletries (9%); second sampling (84% of total) includes food packaging (47%), plastic bags (26%) and toiletries (11%); third sampling (82% of total), includes food packaging (41%), plastic bags (24%), toiletries (17%); fourth sampling (81% of total), includes food packaging (46%), plastic bags (21%), toiletries (14%) (Figure 4).
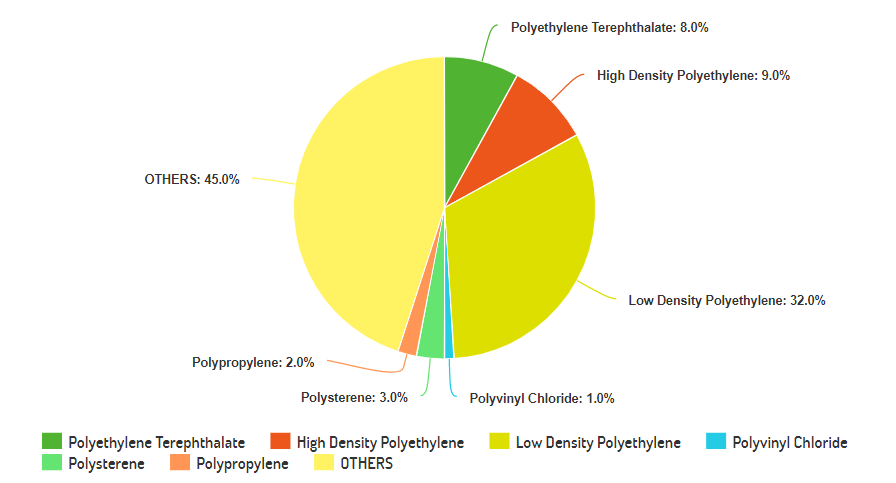
When aggregated into the seven plastic polymer category the most abundant plastic category considering all sampled items were the “Others” (45%), which is composed of multilayers, mixed and other plastics that are difficult to classify. This was followed by LDPE (32%), HDPE (9%), PET (8%), PS (%), PP (2%), and least was PVC (1%) (Figure 5).
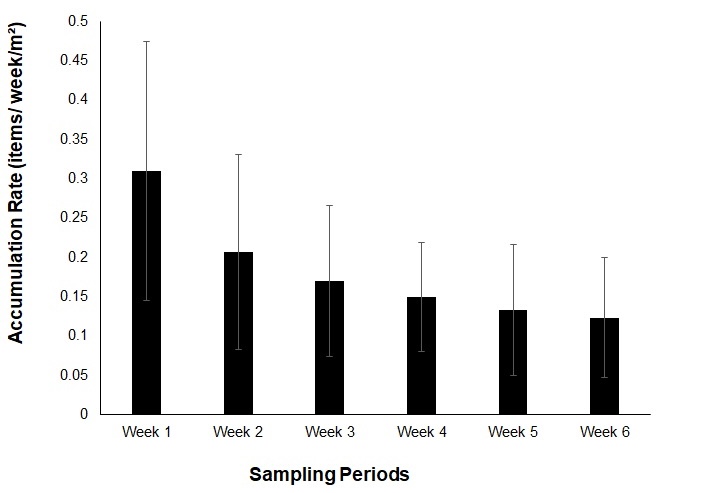
The plastic accumulation per weekly and daily measurement periods varied. A total of 328 plastic litter accumulations were identified in 6 weeks sampling duration in a total area of 300 m² (total sampling area for three sampling locations), averaging between 0.12-0.31 accumulations per week per m².
The mean accumulation per weekly sampling constantly decreases per week. The highest accumulation was recorded during the first week of plastic collection (0.31 items per week per m²), and the lowest was recorded during the sixth week of plastic collection (0.12 items per week per m²) (Figure 6). The mean accumulation per weekly sampling shows no significant difference (P=0.35).
A total of 69 plastic litters accumulation were identified during the daily sampling with 7 days duration in a total area of 300 m² (total area for three sampling locations), averaging between 0.01-0.05 items per day per m². The highest accumulation was recorded during day 1 (0.05 items per day per m²), and the lowest was recorded on day 7 of plastic collection (0.01 items per day per m²) (Figure 7). The mean accumulation per daily sampling shows no significant difference (P=0.65).

Variations over space and time
Densities of riverside litter differed per sampling rounds and predefined zones. The most polluted riverside zone of Pulot River is at the river edge, while the highest density of plastic collected between the four sampling rounds was during the first sampling. The present study showed no significant difference in litter densities across riverside zones, similar to the study of Keislling et al., (2019), which also study the difference in the density of plastic litter across shore zones on rivers in Germany. The density of plastic litter through time generally decreases with continuous collection from the same area (Gaboy et al., 2022; Acot et al., 2022).
A higher density of litter in the upper zones of beaches has been observed in many coastal litter studies (Hidalgo-Ruz et al., 2018), and this has been hypothesized to coincide with preferred spots used by beach visitors. When compared to coastal beaches, the riverbanks of Pulot River are more heterogeneous than the coastal environment. Thus, this possibly explains the lack of a clear zonation pattern in our study. An example is that little space was available at the riversides of Pulot River (meaning that litter would be deposited within the first meter of the water’s edge). Meanwhile, at the other sites, large areas are available for public use that may stretch beyond our designated sampling zones. As the sampling sites chosen for this study were heterogeneous with regards to the land use of the surrounding area, proximity to human settlements and industry, and the accessibility of the sites, these factors might contribute to the observed differences in litter abundances at riversides (Williams & Simmons, 1997b).
The type of land use of riversides of Pulot River influences both the amount of litter generated in the area and the frequency of illegal litter dumping at our sampling site (Carson et al., 2013; Williams & Simmons, 1999). The presence of vegetation along the riverbanks may also trap the floating plastic litter, therefore influencing the number of plastics generated along the first five meters of our sampling stations. The accessibility of the river shore, especially for vehicles, also influences the degree of illegal litter dumping (Williams & Simmons, 1999).
Runoff may also influence the abundance of plastics (Rech et al., 2014) in three predefined zones of the river; different hydrographic regimes may be responsible for differences and patterns of litter abundances at riversides (Rech et al., 2014) within the Pulot River. In this study, occasional heavy rainfalls occurred, and those occurrences might contribute to the shift of litter from sparsely vegetated riverbanks to river sections with denser vegetation that traps floating litter (Williams & Simmons, 1997a, 1997b).
The densities of plastics during the four sampling rounds showed no significant difference. Considering that the mean density during the first sampling was two times higher (1.14 items per m²) than all other sampling periods, this might be due to stock plastics that are presented in the sampling area for a long period before sample collection. Heavy local rainfalls and flash floods may also wash litter away from riversides (Williams & Simmons, 1997b), possibly causing a complete decrease in plastic litter throughout the plastic collection.
Top Items and Polymer Category
The most abundant plastic items featuring the top three overall plastics sampled were food packaging, plastic bags, and toiletries, which can be attributed to household litter. Food packaging such as junk food sachets, candy wrappers, condiments sachets, etc., is the topmost abundant plastic items found in the riverbanks of Pulot River and its tributary, which is identified as the result of illegal dumping of the residents along the vicinity (Franz & Frietas, 2011; Di & Wang, 2017). In this study three out of our five sampling sites were also considered small illegal dumping sites based on our early observations and as described by residents along the area. This suggests that communities along the river dump their waste directly into the river and are responsible for polluting the river environment No presence of waste collection points and infrastructures has been also observed along the riverbanks of Pulot River and its tributary.
The identified primary source of plastic litter in the riverbanks of Pulot River and its tributary were the residents illegally dumping their waste on the riverbanks, which was consistent with the finding of Williams and Simmons (1996, 1999) and Rech et al. (2015). The specific types of overall plastic litter are food packaging, plastic bags, and toiletries. These findings are in contrast with the study of van Emmerick et al., (2020), in Dutch Rhine-Meuse Delta from which fragments were the most common overall items. This difference in results, may also, hint at the cultural and habitual contrast in the riverine communities' inhabitants.
Though there is also overlap for specific plastic litter, such as bottles, food wrapping, and packaging, (single use) plastic bags were not found in the most common items in Dutch Rhine Meuse Delta (van Emmerick et al., 2020). The variations in types of plastic litter may be explained by natural variations in different river systems. The utilized method and the total amount of sampled items perhaps contributed to the result from variations. Therefore, we can suggest that each river exhibits a characteristic profile of litter composition based on the influencing factors and plastic use in the upstream.
Among the three predefined zones, the river edge has the highest plastic density recorded; food packaging also has the predominant specific items identified. This could have three explanations: (1) the abundance of food packaging on the river edge could be attributed to our result that this is the overall dominant type of plastics in the riverbanks of Pulot River; (2) most flushed and deposited plastic litter in the river edge from upper zones during surface runoff are food packaging; (3) floating plastics trapped on the vegetation at the river edge during the increased of water level was food packaging.
Accumulations of Plastic Litter
Considering the occurrence of litter accumulation, overall, there is no significant difference in the amount of accumulated plastic litter between sampling weeks for weekly measurement periods and between sampling days for daily measurement periods. The result of our study showed that the number of accumulated plastic litter was higher during the weekly sampling period than in daily sampling periods. This contrasted with papers looking at the effect of sampling interval on estimates of accumulations of litter on beaches. Our study found that collecting litter daily increased the estimates of the daily accumulation rate compared with estimates based on a similar overall period where monitoring was carried out monthly or weekly.
The possible explanation was that longer sampling intervals on beaches may lead to some litter may be washed back out to the area. On the other hand, accumulated plastics in the riverbanks might be deposited there for a long period of time unless there are driving mechanisms such as an increase in river discharge or occurrence of surface runoff that may wash the accumulated plastics from riverbanks into the surface water. Therefore, we can suggest that hydrological factors and the type of environment sampled have impacts on the variations in the accumulation of plastic.
On the other hand, direct comparisons of accumulation rates are difficult because of differences in sampling methodology (Swanepoel 1995), litter concentration units, and classification categories (Kusui & Noda 2003). Most studies preferred to sample standing stocks - as it is easier, requires less effort, and is cheaper to accomplish than accumulation studies. Nevertheless, irregular sampling can be misleading.
The results of our study provide baseline information on the density, abundance, composition, and accumulation of plastic litter in the riverbanks of Pulot River and its tributary. In the search for litter sources, we identified mainly the residents living in the vicinity, illegal dumping, or the river itself depositing litter from upstream sources. These results indicate the urgent need for better education and policy measures to protect riparian environments and reduce the input of riverine litter into the marine environment.
The sustainable productivity of aquatic and riverine environments will be a primary concern among farm communities dependent on the health of the water resources. Thus, policy (political institutions) awareness and community compliance (sociocultural institutions) to that policy need to be aligned if plastic litter proliferation is to be addressed and mitigated (Gutierrez, 2021; Gutierrez, 2023).
Conclusion
In this study, we provided baseline information on the prevalence and variations of macroplastics litter in the riverbanks of Pulot River and its tributary in Sofronio Española Palawan, Philippines. A total of 2,586 plastic litter was sampled on the riverbanks of Pulot River and its tributary, between 05 June and 07 August 2021. An average of 0.73 items per m² was measured in all locations during the four sampling rounds. The density of plastic litter and its composition do show considerable variations between each predefined zones and between sampling rounds which may be influenced by local and remote (upstream litter sources), waste infrastructure, and driving mechanisms.
Food packaging, toiletries, and plastic bags were the most abundant specific items found on the riverbanks of Pulot River and its tributary. These data on the most frequently observed items lead to the identification of the potential specific sources of these plastic litters. We can say with certainty that residents in the vicinity are in the habit of illegal waste disposal along river tributaries. The types of waste collected, likewise, exposed the severed connections between people’s daily behavior (habit) and the policy regime of the community (law) – aimed at sustainable and prolonged nature-community coexistence.
The presence of plastic wasters, specifically single-use plastics, poses a threat to marine and freshwater organisms and health. A multifaceted approach is needed to address this issue. First, increased public awareness and education on proper plastic waste disposal is needed. Community-based clean-up efforts also help reduce the amounts of plastic entering rivers and ultimately the ocean. In addition to this, the implementation of waste management systems, including recycling facilities and effective solid waste collection can help reduce the amount of plastic waste generation.
The data in this paper can be utilized by policymakers for mitigation measures targeted at specific (plastic) items. Moreover, future studies should consider what community (socio-cultural) characteristics of sampling sites’ influenced litter densities and distribution (e.g., distance to densely populated areas), how litter quantities at riverbanks relate to litter located within a river, and how riverine pollution impacts wildlife and people, similar to investigations conducted at beaches and the coastline.
References
- Acot, F.T., Sajorne, R.E. Omar, N.A.K., Suson, P.D., Rallos, L.E.E., & Bacosa, H.P., 2022. Unraveling macroplastic pollution in rural and urban beaches in Sarangani Bay Protected Seascape, Mindanao, Philippines. J. Mar. Sci. 2022; 10(10):1532. https://doi.org/10.3390/jmse10101532.
- Andrady, A.L., 2011. Microplastics in the marine environment. Mar. Pollut. Bull., 62: 1596-1605. https://doi.org/10.1016/j.marpolbul.2011.05.030.
- Apostol, G. L. C., Acolola, A. G. A., Edillon, M. A., & Valenzuela, S., 2022. How comprehensive and effective are waste management policies during the COVID-19 pandemic? Perspectives from the Philippines. Front. Public Health, 10.
- Armitage, N., 2007. The reduction of urban litter in the stormwater drains of South Africa. Urban Water Journal, 4: 151-172.
- Carpenter, E, & Wolverton, S., 2017. Plastic litter in streams: the behavioral archaeology of a pervasive environmental problem. Appl. Geogr., 84: 93-101.
- Carson, H.S., Lamson, M.R., Nakashima, D., Toloumu, D., Hafner, J., Maximenko, N. and McDermid, K.J., 2013. Tracking the sources and sinks of local marine debris in Hawai ‘i. Mar. Environ. Res., 84, 76-83. https://doi.org/10.1016/j.marenvres.2012.12.002.
- Cayabo, G.D.B., Omar, D.M., Mabuhay-Omar, J.A., & Bacosa, H.P., 2020. Bacteriological assessment of the recreational water of Bacuit Bay El Nido, Palawan, Philippines. The Palawan Scientist. 13 (1); 44-58.
- de Barros, T.R., Mancini, S.D., & Ferraz, J.L., 2014. Composition and quantification of the anthropogenic and natural fractions of wastes collected from the stormwater drainage system for discussions about the waste management and people behavior. Environ. Dev. Sustain., 16: 415–429. https://doi.org/10.1007/s10668-013-9484-7.
- Di, M., & Wang, J., 2017. Microplastics in surface waters and sediments of the three gorges reservoir, China. Sci. Total Environ., 1620-1627.
- Franz, B., & Freitas, M.A.V., 2011. Generation and impacts of floating litter on urban canals and rivers: Rio de Janeiro megacity case study. WIT Trans. Ecol. Environ., 167: 321-332.
- Gaboy, S.M., Guihawan, J.Q., Leopardas, V.M., & Bacosa, H.P., 2022. Unravelling macroplastic pollution in seagrass beds of Iligan City, Mindanao, Philippines. Mar. Pollut. Bull., 185, 114233. https://doi.org/10.1016/j.marpolbul.2022.114233.
- Galgani, F., Leauté, J.P., Moguedet, P., Souplet, A., Verin, Y., Carpentier, A., Goraguer, H., Latrouite, D., Andral, B., Cadiou, Y., Mahe, J.C., Poulard, J.C., & Nerisson, P., 2000. Litter on the sea floor along European coasts. Mar. Pollut. Bull., 40: 516–527. https://doi.org/10.1016/S0025-326X(99)00234-9.
- Gasperi, J., Dris, R., Bonin, T., Rocher, V., & Tassin, B., 2014. Assessment of floating plastic debris in surface water along the Seine River. Environ. Pollut., 195: 163-166. https://doi.org/10.1016/j.envpol.2014.09.001.
- GESAMP, 2010. Proceedings of the GESAMP international workshop on plastic particles as a vector in transporting persistent, bio-accumulating and toxic substances in the oceans. GESAMP Report and Studies, 82: 68.
- González-Fernández, D., Cózar, A., Hanke, G., Viejo J., Morales-Caselles C., Bakiu R., Barceló D., Bessa F., Bruge A., Cabrera M., Castro-Jiménez J., Constant M., Crosti R., Galletti Y., Kideys A., Machitadze N., Pereira de Brito J., Pogojeva M., Ratola N., Rigueira J., Roio-Neieto E., Savenko O., Schóneich-Argent R., SSiedlewicz G., Suaria G., & Tourgeli M., 2021. Floating macrolitter leaked from Europe into the ocean. Nat. Sustain. 4, 474–483. https://doi.org/10.1038/s41893-021-00722-6
- Gutierrez, C. S., 2021. Institutional Interactionism and Farm Landholdings in Japan and the Philippines (doctoral dissertation). National University of Singapore. https://scholarbank.nus.edu.sg/handle/10635/224568.
- Gutierrez, C. S., 2023. The Family as a Farm Institution: Cases in Japan and the Philippines. Resilience and Familism: The Dynamic Nature of Families in the Philippines. Contemporary Perspectives in Family Research, 23, 205–225. https://doi/10.1108/S1530-353520230000023012/full/html.
- Harris, P. T., Westerveld, L., Nyberg, B., Maes, T., Macmillan-Lawler, M., & Appelquist, L. R., 2021. Exposure of coastal environments to river-sourced plastic pollution. Sci. Total Environ., 769, 145222. https://doi.org/10.1016/j.scitotenv.2021.145222.
- Hidalgo-Ruz, V., Honorato-Zimmer, D., Gatta-Rosemary, M., Nunez, P., Hinojosa, I.A., & Thiel, M., 2018. Spatio-temporal variation of anthropogenic marine debris on Chilean beaches. Mar. Pollut. Bull., 126: 516-524.
- Hoellein, T.J., Westhoven, M., Lyandres, O., & Cross, J., 2015. Abundance and environmental drivers of anthropogenic litter on 5 Lake Michigan beaches: a study facilitated by citizen science data collection. J. Great Lakes Res., 41: 78-86. https://doi.org/10.1016/j.jglr.2014.12.015.
- Inocente, S.A.T. and Bacosa, H.P., 2022. Assessment of macroplastic pollution on selected tourism beaches of Barobo, Surigao Del Sur, Philippines. J Mar Isl Cult. doi: 10.21463/jmic.2022.11.2.02.
- Jambeck, J.R., Geyer, R., Wilcox, C., Siegler, T.R., Perryman, M., Andrady, A., Narayan, R., & Law, K.L., 2015. Plastic waste inputs from land into the ocean. Science, 347: 768-771. https://www.science.org/doi/abs/10.1126/science.1260352.
- Khoo, K. S., Ho, L. Y., Lim, H. R., Leong, H. Y., & Chew, K. W., 2021. Plastic waste associated with the COVID-19 pandemic: Crisis or opportunity? J. Hazard. Mater., 417, 126108. https://doi.org/10.1016/j.jhazmat.2021.126108.
- Kiessling, T., Knickmeier, K., Kruse, K., Brennecke, D., Nauendorf, A. & Theil, M., 2019. Plastic pirates sample litter at rivers in Germany-Riverside litter and litter sources estimated by schoolchildren. Environ. Pollut., 245: 545-57.
- Kühn, S., Bravo Rebolledo, E.L., & van Franeker, J.A., 2015. Deleterious effects of litter on marine life. In: Bergmann, M., Gutow, L., Klages, M. (Eds.), Marine Anthropogenic Litter. Springer, Berlin.
- Kusul, T., & Noda, M., 2003. International survey on the distribution of stranded and buried litter on beaches along the Sea of Japan. Mar. Pollut. Bull., 43: 175 – 179. https://doi.org/10.1016/S0025-326X(02)00478-2.
- Laglbauer, B.J, Franco-Santos, R.M., Andreu-Cazenave, M., Brunelli, L., Papadatou, M., Palatinus, A., Grego, M., & Depre, T., 2014. Macrodebris and microplastics from beaches in Slovenia. Mar. Pollut. Bull., 89: 356-366.
- Leal Filho, W., Salvia, A. L., Minhas, A., Paço, A., & Dias-Ferreira, C., 2021. The COVID-19 pandemic and single-use plastic waste in households: A preliminary study. Sci. Total Environ., 793, 148571. https://doi.org/10.1016/j.scitotenv.2021.148571.
- Lechner, A., Keckeis, H., Lumesberger-Loisl, F., Zens, B., Krusch, R., Tritthart, M., Glas, M., & Schludermann, E., 2014. The Danube so colourful: a potpourri of plastic litter outnumbers fish larvae in Europe's second largest river. Environ. Pollut., 188: 177-181. https://doi.org/10.1016/j.envpol.2014.02.006.
- Limon, M. R., Vallente, J. P. C., Cajigal, A. R. V., Aquino, M. U., Aragon, J. A., & Acosta, R. L., 2022. Unmasking emerging issues in solid waste management: Knowledge and self-reported practices on the discarded disposable masks during the COVID-19 pandemic in the Philippines. Environmental Challenges, 6, 100435.
- Mani, T., Hauk, A., Walter, U., & Burkhardt-Holm, P., 2015. Microplastics profile along the Rhine River. Sci. Rep. -UK, 5: 17988. https://doi.org/10.1038/srep17988.
- McCormick, A.R., & Hoellein, T.J., 2016. Anthropogenic litter is abundant, diverse, and mobile in urban rivers: insights from cross ecosystem analyses using ecosystem and community ecology tools. Limnol. Oceanogr., 61: 1718-1734.
- Meijer, L.J.J., van Emmerick, T., van Der Ent, R., Schmidt, C., & Lebreton, L., 2021. More than 1000% rivers accounts for 80% of global riverine plastic emission into the ocean. Sci. Adv., 7. https://doi.org/10.1126/sciadv.aaz5803.
- Moore, C.J., Lattin, G., & Zellers, A.F., 2011. Quantity and type of plastic debris flowing from two urban rivers to coastal waters and beaches of Southern California. J. Integr. Coast. Zone Manag., 11: 65–73.
- Morritt, D., Stefanoudis, P.V., Pearce, D., Crimmen, O.A., & Clark, P.F., 2014. Plastic in the Thames: a river runs through it. Mar. Pollut. Bull., 78: 196-200.
- Newbould, R., 2021. Understanding river plastic transport with tracers and GPS. Nat. Rev. Earth Environ., 2(9), 591-591. https://doi.org/10.1038/s43017-021-00212-5.
- Newman, S., Watkins, E., Farmer, A., ten Brink, P., & Schweitzer, J.P., 2015. The economics of marine litter. In: Bergmann, M., Gutow, L., Klages, M. (Eds.), Marine Anthropogenic Litter. Springer, Berlin.
- Rangel-Buitrago, N., Williams, A., Anfuso, G., Arias, M., & Gracia, A., 2017. Magnitudes, sources, and management of beach litter along the Atlantico department coastline, Caribbean coast of Colombia. Ocean Coast Manag., 138: 142-157. https://doi.org/10.1016/j.ocecoaman.2017.01.021.
- Rech, S., Macaya-Caquilpan, V., Pantoja, J., Rivadeneira, M.M., Kroeger Campodonico, C., & Thiel, M., 2015. Sampling of riverine litter with citizen scientists e findings and recommendations. Environ. Monit. Assess., 187: 335
- Rech, S., Macaya-Caquilpan, V., Pantoja, J.F., Rivadeneira, M.M., Jofre Madariaga, D., & Thiel, M., 2014. Rivers as sources of marine litter - a study from the SE Pacific. Mar. Pollut. Bull., 82: 66-75. https://doi.org/10.1016/j.marpolbul.2014.03.019.
- Requiron, J. M. C & Bacosa, H. P., 2022. Macroplastic Transport and Deposition in the Environs of Pulauan River, Dapitan City, Philippines. Philipp J. Sci., 151 (3): 1211-1220.
- Ryan, P.G., Moore, C.J., van Franeker, J.A., & Moloney, C.L., 2009. Monitoring the abundance of plastic debris in the marine environment. Philosophical Transactions of the Royal Society, Biol. Sci., 364: 1999–2012.
- Sajorne, R.E., Bacosa, H.P., Cayabo, G.D.B., Ardines, L.B. Jr, Sumeldan, J.D.C., Omar, J.M., & Cresencia, L.A., 2021. Plastic litter along sandy beaches in Puerto Princesa, Palawan Island, Philippines. Mar. Pollut. Bull., 169: 112-520.
- Sajorne, R. E., Cayabo, G. D. B., Madarcos, J. R. V., Madarcos, K. G., Omar Jr, D. M., Ardines, L. B., ... & Bacosa, H. P., 2022. Occurrence of COVID-19 personal protective equipment (PPE) litters along the eastern coast of Palawan Island, Philippines. Mar. Pollut. Bull., 182, 113934. https://doi.org/10.1016/j.marpolbul.2022.113934.
- Shimizu, T., Nakai, J., Nakajima, K., Kozai, N., Takahashi, G., Matsumoto, M., & Kikui, J., 2008. Seasonal variations in coastal debris on Awaji Island, Japan. Mar. Pollut. Bull., 57: 182-186. https://doi.org/10.1016/j.marpolbul.2007.10.005.
- Swanepoel, D., 1995. An analysis of beach debris accumulation in Table Bay, Cape Town, South Africa. MSc thesis, University of Cape Town.
- Thompson, R.C., Moore, C.J., von Saal, F.S., & Swan, S.H., 2009. Plastics, the environment and human health: current consensus and future trends. Philos T Roy Soc, 364: 2153-2166. https://doi.org/10.1098/rstb.2009.0053.
- Tudor, D.T., & Williams, A., 2004. Development of a ‘matrix scoring technique’to determine litter sources at a Bristol channel beach. J. Coast. Conserv., 10: 119-127. https://doi.org/10.1652/1400-0350(2004)010[0119:DOAMST]2.0.CO;2.
- van Emmerick, T., Roebreck, C., de Winter, W., Vreind, P., Boonstra, M., & Hogue, M., 2020. Riverbank macrolitter in the Dutch-Rhine Meuse delta. Environ. Res. Let., 15: 104087.
- Veerasingam, S., Mugilarasan, M., Venkatachalapathy, R., & Vethamony, P., 2016. Influence of 2015 flood on the distribution and occurrence of microplastic pellets along the Chennai coast, India. Mar. Pollut. Bull., 109: 196-204.
- Williams, A.T., & Simmons, S.L., 1997a. Estuarine litter at the river/beach interface in the Bristol Channel, United Kingdom. Journal of Coast Res. 13: 1159-1165.
- Williams, A.T., & Simmons, S.L.,1997b. Movement patterns of riverine litter. Water Air Soil Pollut., 98; 119-139. https://doi.org/10.1007/BF02128653.
- Williams, A.T., & Simmons, S.L., 1999. Sources of riverine litter: the river Taff, south Wales, UK. Water Air Soil Pollut., 112; 197-216.
- Willoughby, N.G.,1986. Man-made litter on the shores of the thousand island archipelago, Java. Mar. Pollut. Bull., 17: 224-228. https://doi.org/10.1016/0025-326X(86)90605-3.
