Assessment of Macroplastic Pollution on Selected Tourism Beaches of Barobo, Surigao Del Sur, Philippines
Abstract
Plastics have proven useful in contemporary society. But accumulation of plastics in form of litter in the marine environment has become prevalent pollution affecting all of the worlds’ oceans. The Philippines being an archipelagic country heavily depends on the marine environment and the ecosystem services that it provides. However, it is also ranked as the third-largest producer of marine plastic pollution and the number one plastic riverine emitter. Tourism is an important economic activity for coastal populations throughout the Philippine archipelago. But there are limited studies that investigate plastic pollution in the tourism sector of the Philippines. This study assessed the macroplastic prevalence in the tourism environment of Barobo, Surigao del Sur. Plastic litters were sampled from four growing tourism sites (Cabgan Island, Turtle Island, Dapdap Beach, Panaraga Beach) of Barobo by establishing transect lines with quadrats. Results reveal that all four sites are contaminated with plastic litters. In terms of mainland and island beaches, beaches located on the island have thrice as many plastics with 0.41 items/m2, compared to 0.15 items/m2 on the mainland beaches. Plastic collected were predominantly food packaging, plastic bags, and fragments. Clean coast index calculations reveal that the tourist beaches of Barobo are moderately clean and clean beaches by international standards.
Keywords
macroplastic, beach, tourism, clean coast index, marine plastic litter
Introduction
In this new age, the use of plastic has been considered to provide more advantages than the traditional materials as it provides numerous societal benefits (Retama et al., 2016). They are lightweight, durable, and economical thus useful for many manufacturing processes. During this plastic era known as the plasticene, overproduction, and consumption of plastic materials is evident. According to Plastic Europe (2020), plastic production reached approximately 360 million tons in 2018 and is growing at an average annual rate of 3.5%. What is more alarming is that there is growing evidence that the current use and disposal of plastic leads to significant contamination of terrestrial and aquatic ecosystems. Eriksen et al. (2014) stated that over 250,000 tons of plastic are estimated to float in the sea and are adversely affecting marine wildlife and humans by plastic entering the food chain (Heidbreder et al., 2019). The Philippines being an archipelagic country serves as a hotspot diversity of marine flora and fauna. But it is currently ranked as the third foremost contributor of plastic pollutants in the world with 0.28 to 0.75 million tons per annum emission (Jambeck et al., 2015) and number one biggest global plastic polluter via rivers with 6.8 × 10⁷ productions per year (Meijer et al., 2021)
When waste makes its way to the ocean, it jeopardizes the health and subsistence of marine ecosystems, such as the beaches (Williams et al., 2017; Steichen et al., 2020; Bacosa et al., 2020; Cayabo et al., 2021). Famous for their cultural aesthetic services, beaches also act as an excellent depositional site for plastic debris (Corcoran et al., 2009). Tons of garbage is being washed ashore and foreshore through beaches. The presence of plastic pollution on the beaches reduces its aesthetic quality and can cause health complications in nearby communities. Moreover, Carson et al. (2011) said that plastic fragments present on the beach alter the permeability of sediments resulting in changes in water movement and these fragments also affect heat transfer between sediment grains. It is now well evidenced that plastic negatively impacts marine life (Galloway et al., 2017). And while research on plastic pollution has been growing over the past decade, there is limited data regarding marine plastic pollution in the Philippines. There were studies carried out in the Philippines, mostly focusing on sediments (Browne et al., 2011; Kalnasa et al., 2019; Paler et al., 2019; Esquinas et al., 2020) and living organisms (Argamino & Janairo, 2016; Abreo et al., 2016; Espiritu et al., 2019; Bucol et al., 2020). There are a few studies on sandy beaches (Sajorne et al., 2021), but none has focused on tourism as a contributing factor.
Thus, driving the main objective of this study is to establish baseline data on macroplastic pollution in selected tourism beaches of Barobo, Surigao del Sur. Barobo is a municipality located in the central part of Surigao del Sur, which is named as Shangri-La of the south considering its beautiful islands and beaches. For the past years economy has been growing as well as population and commerce. The specific task pursued by this study is to determine the prevalence of macroplastic pollution in these tourism beaches. It also aims to identify the types of macroplastic present in the said areas and to define respective differences regarding their macroplastic types and density.
Results of this empirical study will in turn help the local government units of Barobo, Surigao del Sur to draft initiatives and interventions regarding waste management and policies of these tourism destinations. In turn, local revenue will progress because the aesthetic and sanitation value of the beach will be improved. Tourist and local communities will also benefit from the resource ecosystem services such as its cultural and supporting services.
Area of the Study
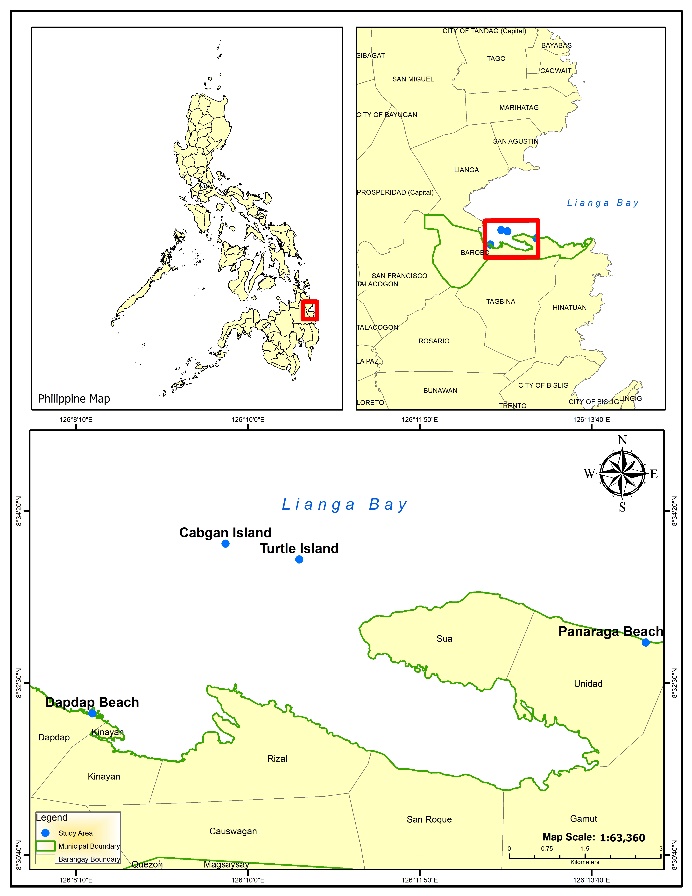
The study was conducted in Barobo, a third-class municipality located in the central part of the province of Surigao del Sur, Philippines (Figure 1). It is bounded on the north by Lianga Bay and the municipality of Lianga, on the south by the municipality of Tagbina, on the southeast by the municipality of Hinatuan, on the east by the Pacific Ocean, and on the west by the municipality of San Francisco, Agusan del Sur. It has a total land area of 24,250 hectares and 15,000 hectares of it is used for the tourism industry. According to the 2015 census, it has a total population of 49,730 people. Sampling points were located on growing tourism areas around Barobo Surigao del Sur, namely; Panaraga Beach, Dapdap Beach, Turtle Island, and
Cabgan Island.
Methods
Beach litter collection
Macroplastic collection was done six times for this study, 3 weekends and 3 weekdays from July 10 to August 12, 2021. At each sampling area, a 100-m-long or two 50-m-long transect line was delineated. Before arriving on site, we selected four numbers from the random number table to eliminate any bias from the shoreline section. These four numbers correspond with four transects of 5 m in length within the shoreline section that was sampled at this particular survey. The width of the beach varies every sampling day depending on the tide. It was measured from the water’s edge up to the back of the shoreline where the tourist cottages are located. The sampling design is based on the NOAA Marine Debris Program (MDP) which developed standardized, statistically valid methodologies for conducting rapid assessments of the debris material type and quantity present in a monitored location. Thus, on any sampling day, 20 m of the 100 m shoreline section is analyzed for debris (Lippiatt, 2013). The start and end of each transect were marked with wooden stakes and a GPS point was recorded to enable repeat sampling to occur over subsequent collection periods. All human-derived products were collected from the surface in each transect and placed in labeled bags for later analysis. Plastic litter was washed off with tap water to remove other debris and has been weighed. All litter samples were visually inspected for plastic-type characterization. Litters with identifiable packaging with plastic code were also listed to determine their chemical identity (Andrady 2011).
Beach litter category
Litters were classified into these categories: (a) food packaging, (b) disposable utensils (c) food containers (d) cloth, (e) napkin and diapers, (f) ropes, (g) cigarette, (h) plastic fragments, (i) plastic bags, (j) styrofoam, (k) medical waste, (l) sack, and (m) nylon fishing line, (n) footwear, (o) plastic bottle, (p) plastic caps, (q) fishing nets, (r) other bottle containers, (s) disposable lighters, (t) plastic cups (u) straws, (v) toiletries, (w) rubbers, (x) tetra packs, (y) metals, (z) glass, (aa) aluminum, (ab) electronics. It was then categorized into nine classes of polymers: polyethylene terephthalate (PET), high-density polyethylene (HDPE), polyvinyl chloride (PVC), low-density polyethylene (LDPE), polypropylene (PP), polystyrene (PS), polyester (PE), polyamide (PA), multilayer, and others (Martins and Sobral, 2011). The total litter count was then tallied to calculate for the clean coast index (CCI) (Alkalay et al., 2007).
Density and Composition of Plastic litter
The density of plastic litters was computed by the total number of items divided by the total area sampled. This method is modified in the study of Abreo et al. (2020).
$$ Density = {\text{Number of plastic litter} \over \text{Total area sampled} (m^2)} $$
Composition of plastic litter used a percent composition (Abreo et al., 2020).
$$ Composition = {\text{Total number of litters per type} \over \text{Total number of litters}} × 100 $$
Following the study of Alkalay et al. (2007), the total litter counts was used to calculate for the clean coast index (CCI). As a representation to qualitatively identify the cleanliness of the urbanized bay site. The CCI was calculated as follows:
$$ CCI = {\text{Total number of plastic items} \over \text{Total area sampled} (m^2)} × K $$
…where the coefficient factor, \(K = 20\) as a multiplier to ensure that the values generated do not fall between 0 and 1. Qualitatively, a CCI value may categorize beach cleanliness as 0–2 indicating very clean, 2–5 indicating clean beach, 5–10 indicating moderately clean, 10–20 indicating dirty, and >20 indicating extremely dirty beaches (Vlachogianni et al., 2018). The CCI is widely used and is a good tool to state the quality of the beaches.
The data were analyzed using one-way analysis of variance (ANOVA) to test the significant differences among beaches and subjected to Post Hoc test (Tukey's test) to compare the means. t-test was used to compare the means of debris collected during weekends and weekdays. Statistical data analysis was performed using PAST software (Hammer et al., 2001). Values were reported as the density (items/m2) ± SD and considered significantly different at p < 0.05.
Results and Discussion
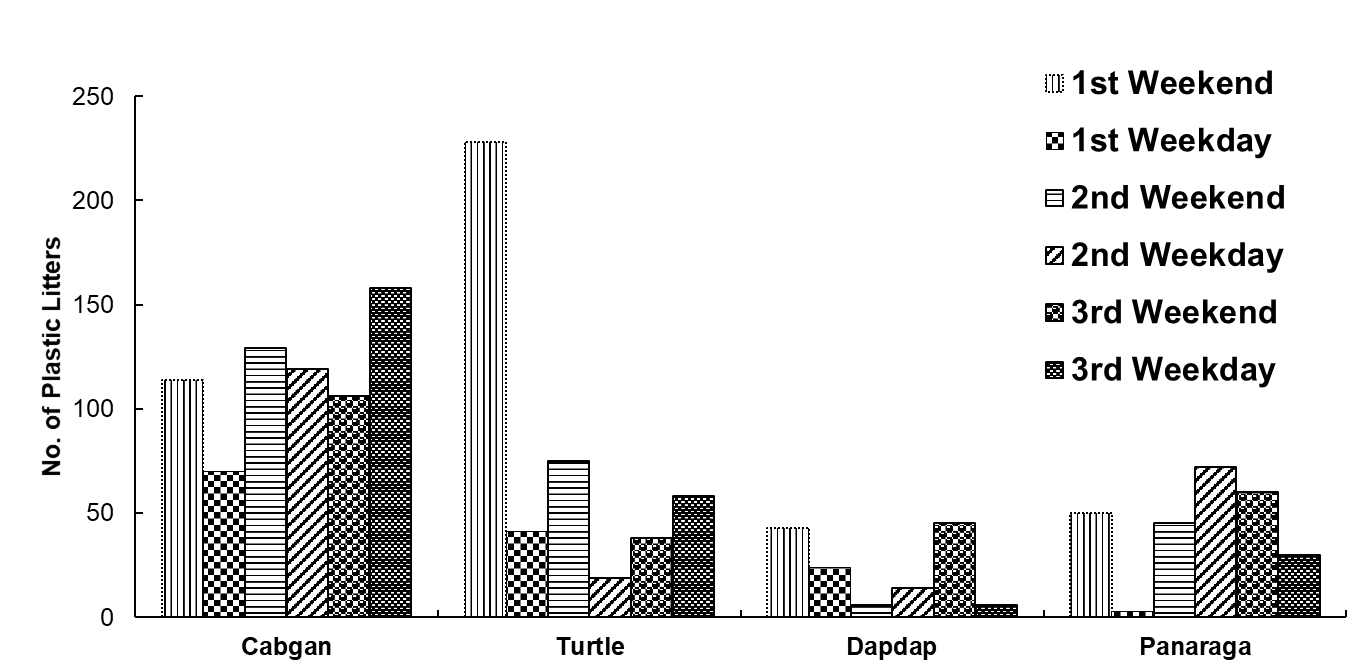
A total of 1,553 debris were collected from all the sites after 6 days of collection. 699 of which were taken from Cabgan Island, 459 from Turtle Island, 260 and 138 counts from Panaraga and Dapdap beaches, respectively. As seen in the detailed summary of everyday collection (Figure 2), the highest waste collected was on the first-weekend collection at Turtle Island amounting to 228 pieces of debris. While the lowest plastic collected was on the first-weekday collection at Panaraga Beach with only 3 pieces of debris. Contrary to the expected trend of debris collection, as the sampling activities progress there is no declining pattern observed. Instead, the amount of debris collected on the 3rd-weekday sampling on Cabgan Island tops all previous collections.
All sampling sites were found to be contaminated with plastic litters. Upon inspection on the labels most litters were produced and consumed in the Philippines. Turtle Island (0.44 ± 0.14) tops the highest plastic density among all sites. The plastic density of Panaraga beach (0.12 ± 0.07) was significantly lower (p < 0.05) than that of Cabgan Island (0.37 ± 0.20) (Table 1). Meanwhile, the plastic density of Turtle Island showed a highly significant difference (p < 0.01) from the plastic density of Panaraga Beach. Overall, Panaraga beach (0.12 ± 0.07) shows the lowest plastic density. Furthermore, there is no significant difference between plastic density collected on weekends compared to weekdays (p > 0.05).
| Sampling Site | Latitude | Longitude | Classification | Mass of litter (g/site) | Total litter count | Mean Area sampled m2 | Mean Density (per m2± SD) |
|---|---|---|---|---|---|---|---|
| Cabgan Island | 8.5664 | 126.1627 | Island Beach | 12,350.5 | 696 | 517.08 | 0.37 ± 0.20 a |
| Turtle Island | 8.56359 | 126.1758 | Island Beach | 7,636.5 | 459 | 169.17 | 0.44 ± 0.14 a |
| Dapdap Beach | 8.53626 | 126.139 | Mainland Beach | 881.5 | 138 | 131.25 | 0.18 ± 0.14 b |
| Panaraga Beach | 8.54883 | 126.2374 | Mainland Beach | 2,644 | 260 | 342.92 | 0.12 ± 0.07 b |
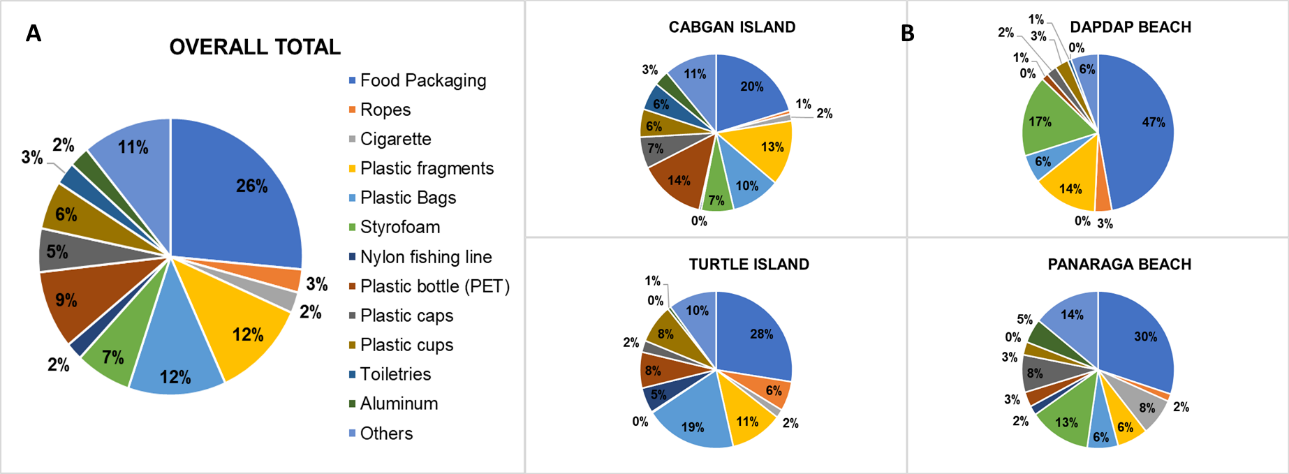
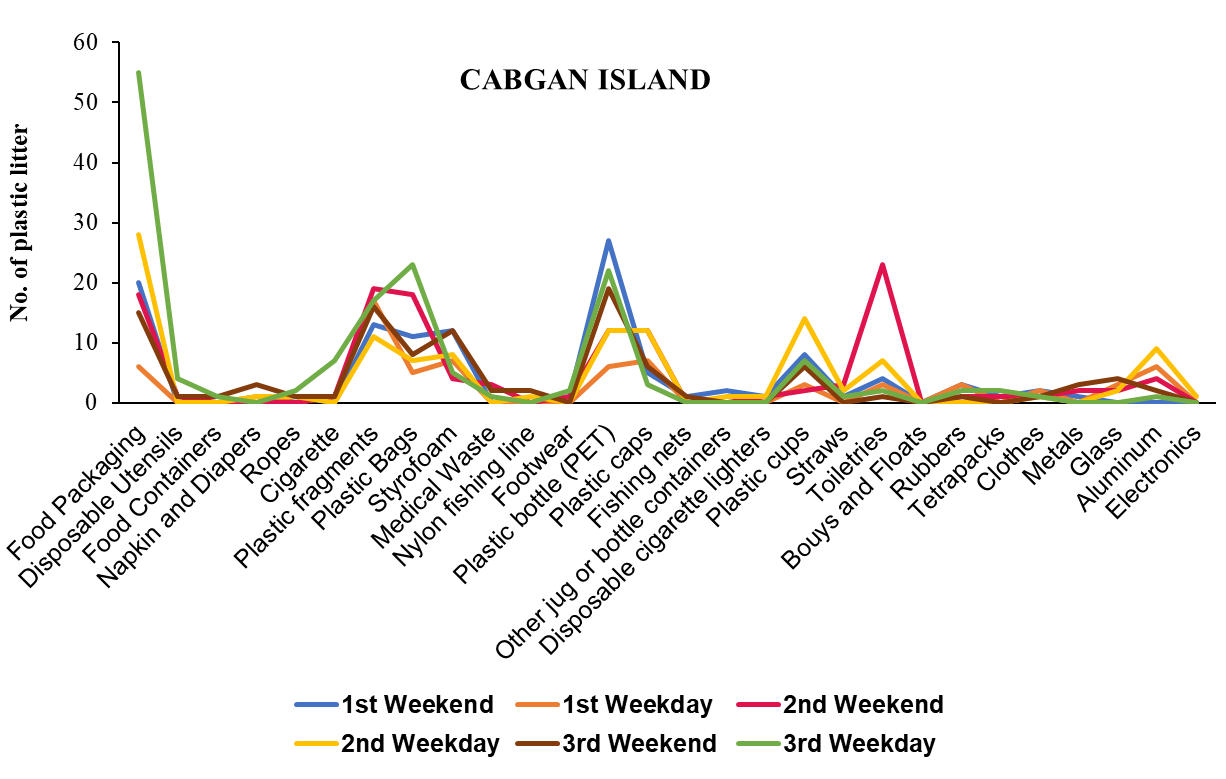
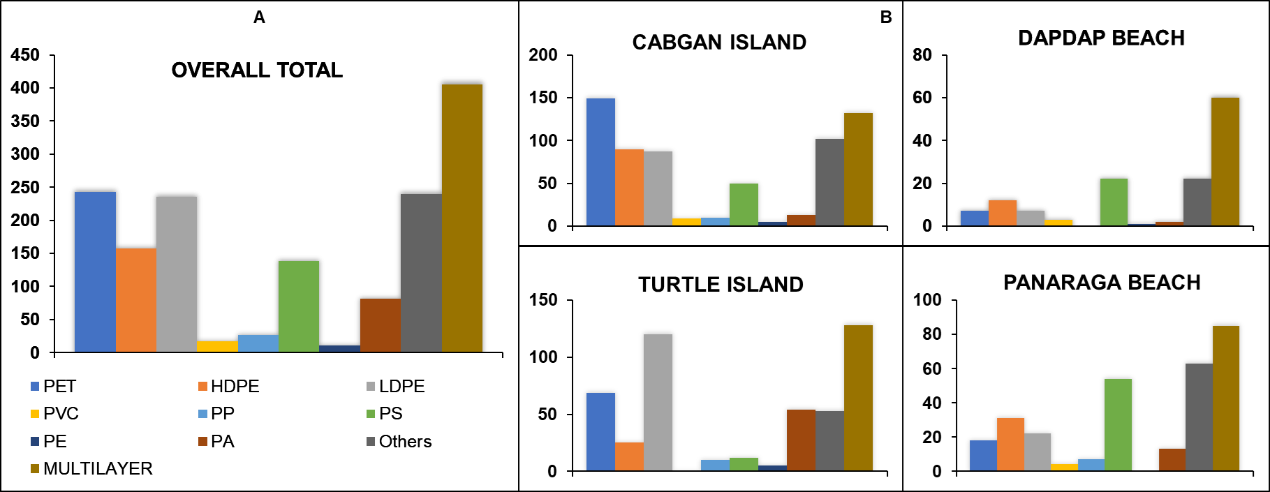
The types of plastics collected were predominantly plastic packaging, plastic bags, and plastic fragments, comprising 50% of the total plastic sampled (Figure 3a). Food packaging such as sachets of junk foods, formulas, candies, etc. has the highest count collected (26%) and dominated all sampling sites, among others. However, there is still an established difference in plastic composition between the beach sites (Figure 3b). For example, about 50% of litter in Dapdap beach was food packing, while it only comprised 20% in Cabgan Island. PET bottle comprises 14% in Cabgan Island, but only 3% for Panaraga Beach. Plastics are known to be drifters and source of litter is hard to identify but evidently litters collected from the sites are goods that is widely used in tourism activities and nearby aquaculture. Although the general pattern is similar, everyday collection differs in plastic composition as shown in Figure 4 for Cabgan Island. Shannon_H diversity test shows that Cabgan Island has the most diverse plastic type composition (2.56). Although Turtle Island has high dominance (0.15) compared to others, Cabgan Island has higher group composition (27) and individual (696) counts.
The sampled plastic litters were classified as polyethylene terephthalate (PET), high-density polyethylene (HDPE), polyvinyl chloride (PVC), low-density polyethylene (LDPE), polypropylene (PP), polystyrene (PS), polyester (PE), polyamide (PA), multilayer, and others. Results reveal that the majority of plastic litters found in the tourist areas fall on multilayer plastics (26%), polyethylene terephthalate (16%), and others (15%) (Figure 5a). Multilayer items refer to those plastic debris that is composed of more than one polymer type (e.g., polyethylene with foil) while plastic referred to as others, are fragments unidentifiable or doesn’t fall to any categories mentioned. It was also found out that multilayer plastic dominated all sampling sites, except Cabgan Island (Figure 5b), which has PET as the highest collected polymer.
Computed CCI for the tourist beaches of Barobo, Surigao del Sur shows that 50% falls to moderately clean beaches and 50% as clean beaches (2–5 indicating clean beach, 5–10 indicating moderately clean). The beaches of Dapdap (n=2.5) and Panaraga (n=3.6) were classified as clean beaches while both Cabgan and Turtle islands were categorized as moderately clean beaches (Table 2). The highest CCI was found out to be in Turtle Island (n=9), where the litter count is high but the beach width area is smaller compared to the other beaches.
| Area | CCI | CCI Description | Author |
|---|---|---|---|
| Cabgan Island, Barobo, Surigao del Sur | 7.33 | Moderately clean | This Study |
| Turtle Island, Barobo, Surigao del Sur | 8.75 | Moderately clean | This Study |
| Dapdap Beach, Barobo, Surigao del Sur | 3.56 | Clean | This Study |
| Panaraga Beach, Barobo, Surigao del Sur | 2.49 | Clean | This Study |
| Binduyan E1, Puerto Princesa, Palawan | 48.75 | Extremely dirty | Sajorne et al. (2021) |
| Lucbuan E3, Puerto Princesa, Palawan | 47.5 | Extremely dirty | Sajorne et al. (2021) |
| San Miguel E6, Puerto Princesa, Palawan | 45.83 | Extremely dirty | Sajorne et al. (2021) |
| Bancao-Bancao E7, Puerto Princesa, Palawan | 77.92 | Extremely dirty | Sajorne et al. (2021) |
| Mangingisda E8, Puerto Princesa, Palawan | 17.08 | Dirty | Sajorne et al. (2021) |
| Inagawan E11, Puerto Princesa, Palawan | 16.67 | Dirty | Sajorne et al. (2021) |
| Cabayugan W1, Puerto Princesa, Palawan | 12.08 | Dirty | Sajorne et al. (2021) |
| Buenavista W2, Puerto Princesa, Palawan | 55.83 | Extremely dirty | Sajorne et al. (2021) |
| Bacungan W4, Puerto Princesa, Palawan | 0 | Very clean | Sajorne et al. (2021) |
| Simpocan W6, Puerto Princesa, Palawan | 0 | Very clean | Sajorne et al. (2021) |
| Napsan W8, Puerto Princesa, Palawan | 0 | Very clean | Sajorne et al. (2021) |
| Bulua, Cagayan de Oro, Macajalar Bay | 33.33 | Extremely dirty | Esquinas et al. (2020) |
| Bonbon, Cagayan de Oro, Macajalar Bay | 93.33 | Extremely dirty | Esquinas et al. (2020) |
| Macabalan, Cagayan de Oro, Macajalar Bay | 93.33 | Extremely dirty | Esquinas et al. (2020) |
| Baloy, Cagayan de Oro, Macajalar Bay | 120 | Extremely dirty | Esquinas et al. (2020) |
| Opol, Macajalar Bay | 2.67 | Clean | Kalnasa et al. (2019) |
| El Salvador, Macajalar Bay | 2.27 | Clean | Kalnasa et al. (2019) |
| Alubijid, Macajalar Bay | 2.27 | Clean | Kalnasa et al. (2019) |
| Talim Bay, Lian, Batangas | 13 | Dirty | Paler et al. (2019) |
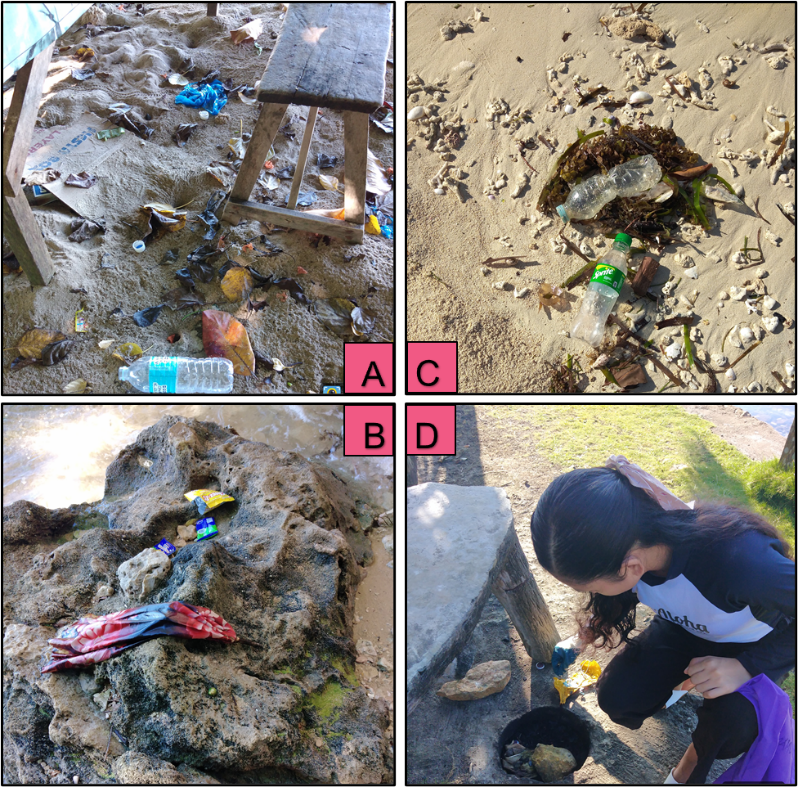
All surveyed tourist beach sites in Barobo, Surigao del Sur had plastic debris present, regardless of the size of the beaches indicating the true pervasive nature of this pollutant (Figure 6). According to Arabi and Nahman (2020), the presence of plastic debris has been found to be a key reason for visitors to the coastline to shorten their visits to a particular beach and sometimes even avoid a specific area. Even so, the production of waste from the tourism sector remains unregulated and unsurveyed (Maione 2019). Coastal communities also perceive that the pollution of the environment including plastics will get worse in the future (Sumeldan et al., 2021). Thus, with this profound evidence, local sectors must exert double efforts to maintain these tourist areas plastic-free. Following the study of macroplastic debris in the Philippines (Paler et al., 2019; Kalnasa et al., 2019 and Esquinas et al., 2020), plastic packaging also accounts as the dominant plastic pollutant of Barobo beaches. This confirms that sachets and plastic packaging are the most common litter found in countries with economic limitations (Ang and Sy-Changco, 2007).
Because plastics are drifters and mobile in nature it is difficult to distinguish their direct sources. But distinctively, plastic packaging and bags collected in this study were freshly deposited junk food, candy, biscuit, and ice wrappers indications of littering by the beach visitors. Moreover, there is also a high amount of collected plastic cups commonly used during drinking sessions of tourists, evidently accompanied by beverage bottles found on the sand areas of these beaches. This observation supports that tourism serves as a waste-generating sector (Gössling, 2002; Biubwa et al., 2014; and Jang et al., 2014). On the other hand, large amounts of Styrofoam and PET bottles collected from the sites are litters deposited from aquaculture activities on the near waters. Plastics are used at every level of aquaculture production, whether it is for tanks, nets, feed bags, liners, piping, polystyrene boxes, product transportation, or chemical storage (Drillet, 2020). Most of the bottles we collected were tied with nylon strings which were previously connected to nets in cultures that serve as floaters.
In addition, this study reveals that the most commonly collected polymer in the beaches of Barobo is multilayer plastic, PET, and others; however, a recent meta-analysis identified PE, PP, and PS as the most abundant polymers in the marine environment (Pabortsava et al., 2020). The highest computed CCI was computed in Turtle Island (n=9), this might be due to the absence of a regular caretaker that cleans and prepares the area for tourist visitations. Compared to the areas with low CCI, Dapdap Beach (n=2.5) and Panaraga Beach (n=3.6) have regular caretakers, proper waste disposal facilities, and regular waste collection. Key informant interviews conducted with the locals also reveal that collection for the beaches in islands are intermittent and mostly initiated only by the local boats.
Conclusions and Recommendation
Overall, the results of this study revealed that beaches in island areas have almost three times more plastics compared to the beaches in the mainland area. The island beaches also have significantly higher plastic density compared to Panaraga Beach. This is mainly because the solid waste interventions have difficulty in reaching the island beaches. Signages and proper waste disposal areas are also non-existent. The types of plastic sampled were mostly plastic food packaging, plastic bags, and plastic fragments, which accounted for the 50% of the plastic sampled. This reinforces the argument that the Philippines' "sachet economy" is to blame for rampant plastic pollution (Ang and Sy-Changco, 2007). This could be addressed through ordinances that consequently ban the usage of certain single-use plastics. Furthermore, the majority of plastic litter found on all sampling sites was categorized as multilayer products, polyethylene terephthalate, and other plastics that were difficult to classify under the nine categories.
With these observations, the local government of Barobo must improve solid waste management in these tourism areas. Addressing the lack of regular waste collection and imposing proper waste segregation will be a good kickstart to slowly resolve the problem. Furthermore, Rees and Pond (1995) suggest that raising public awareness and initiating a change in attitude is vital for reducing the quantity of waste reaching the marine environment. Thus, to ensure sustainable waste management it is important to involve the beachgoers and local community through Information Education Campaign (IEC) activities that may efficiently increase their awareness regarding the extent of marine pollution. Private beach owners must also be informed regarding the great importance of proper waste disposal and make sure that they abide by the environmental regulations set on tourist beaches. Actions that have been shown to reduce marine plastic litter should be promoted, shared, and topped up as soon as possible. These include planning out waste, incentivizing reuse, and utilizing market-based instruments to transition from linear to circular plastic production and consumption. The UN Environment Programme argues that these will generate ‘swift victories’ to inspire further policy action and provide context that will encourage innovation.
This study was conducted during the COVID -19 pandemic, where the tourism guidelines of Barobo, Surigao del Sur restricts to only 50% carrying capacity for tourist arrivals and observance of curfews. But the current findings present distinct plastic deposition from beach visitors which may provide a basis for future plastic waste management policy and interventions. Overall, CCI results showed that beaches are moderately clean and clean indicating a minimal threat to the coastal environment. The present study is preliminary and provides the baseline status of macroplastic litter in selected tourism beaches of Barobo, Surigao del Sur.
Acknowledgements
In these trying times, a work of this magnitude has been a challenge to keep on track. The authors were fortunate to have colleagues who contributed significantly in keeping the study going and producing a relatively coherent output, Christine Joy Pacilan, Shiela Gaboy, Judea Requiron, Vanessa Lavador, John Griggy Inocente, Ritchel Corbita, Mercedita Inocente, Sofhia Inocente and Jayson Leigh Segovia. The author would also like to thank DOST-SEI through the Bangon Marawi scholarship for the funds that made this study possible.
References
- Abreo, N., Siblos, S., & Macusi, E., 2020. Anthropogenic Marine Debris (AMD) in Mangrove Forests of Pujada Bay, Davao Oriental, Philippines. Journal of Marine and Island Cultures, 9(1). doi: 10.21463/jmic.2020.09.1.03
- Abreo, N.A.S., Macusi, E.D., Blatchley, D.D., Cuenca, G.C., 2016. Ingestion of Marine Plastic Debris by Green Turtle (Chelonia mydas) in Davao Gulf, Mindanao, Philippines. Philipp. J. Sci. 145, 17–23.
- Alkalay, R., Pasternak, G., & Zask, A., 2007. Clean-coast index—A new approach for beach cleanliness assessment. Ocean & Coastal Management, 50(5–6), 352–362. doi: 10.1016/j.ocecoaman.2006.10.002
- Andrady, A.L., 2011. Microplastics in the marine environment. Mar. Pollut. Bull. 62 (8), 1596ll. 62
- Ang, R.P., Sy-Changco, J.A. 2007. The phenomenon of sachet marketing: lessons to be learned from the Philippines. Enhancing Knowledge Development in Marketing 5
- Arabi, S., & Nahman, A., 2020. Impacts of marine plastic on ecosystem services and economy: State of South African research. South African Journal of Science, 116(5/6), 1. 10.17159/sajs.2020/7695
- Argamino, C.R., Janairo, J.I.B., 2016. Qualitative assessment and management of microplastics in Asian Green Mussels (Perna viridis) cultured in Bacoor Bay, Cavite, Phillipines. Environment Asia 9 (2), 48–54.
- Bacosa, H.P., Steichen, J.M., Kamalanathan, M., Windham, R., Lubguban A., Labonte, M., Kaiser K., Hala, D., Santschi, P.H., Quigg, A.S., 2020. Polycyclic aromatic hydrocarbons (PAHs) and putative PAH degrading bacteria in Galveston Bay, Texas (USA) following the 2017 Hurricane Harvey. Environmental Science and Pollution Research. 27; 34987-34999.
- Biubwa, A., Sharifah, N., S., I., & Irniza, R., 2014. Municipal solid waste management of Zanzibar: Current practice, the challenges and the future. International Journal of Current Research and Academic Review, 1(2014), 5-19
- Browne, M. A., Crump, P., Niven, S. J., Teuten, E., Tonkin, A., Galloway, T., & Thompson, R., 2011. Accumulation of Microplastic on Shorelines Woldwide: Sources and Sinks. Environmental Science & Technology, 45(21), 9175–9179. doi: 10.1021/es201811s
- Bucol, L. A., Romano, E. F., Cabcaban, S. M., Siplon, L. M. D., Madrid, G. C., Bucol, A. A., & Polidoro, B., 2020. Microplastics in marine sediments and rabbitfish (Siganus fuscescens) from selected coastal areas of Negros Oriental, Philippines. Marine Pollution Bulletin, 150, 110685. doi: 10.1016/j.marpolbul.2019.110685
- Carson, H.S., Colbert, S.L., Kaylor, M.J., McDermid, K.J., 2011. Small plastic debris changes water movement and heat transfer through beach sediments. Mar. Pollut. Bull. 62, 1708–1713.
- Cayabo, G.D.B., Omar, D.M., Mabuhay-Omar, J.A., Bacosa, H.P., 2021. Bacteriological assessment of the recreational water of Bacuit Bay El Nido, Palawan, Philippines. The Palawan Scientist. 13 (1); 44-58.
- Corcoran, P. L., Biesinger, M. C., & Grifi, M., 2009. Plastics and beaches: A degradingrelationship. Marine Pollution Bulletin, 58(1), 80–84. doi: 10.1016/j.marpolbul.2008.08.022
- Drillet, G., 2020. World Aquaculture Society | Plastics in Aquaculture – The WAS-IMarEST Roundtables - World Aquaculture Society. World Aquaculture Society. Retrieved October 15, 2021, from https://www.was.org/articles/Plastics-in-Aquaculture-The-WAS-IMarEST-Roundtables.aspx#.YW_VlhpBzb1
- Eriksen, M., Lebreton, L.C.M., Carson, H.S., Thiel, M., Moore, C.J., Borerro, J.C., Reisser, J., 2014. Plastic pollution in the world's oceans: more than 5 trillion plastic pieces weighing over 250,000 tons afloat at sea. PLoS ONE 9 (12), 1–15. doi: 10.1371/journal.pone.0111913
- Espiritu, E.Q., Dayrit, S.A.S., Coronel, A.S.O., Paz, N.S.C., Ronquillo, P.I.L., Castillo, V.C. G., Enriquez, E.P., 2019. Assessment of quantity and quality of microplastics in the sediments, waters, oysters, and selected fish species in key sites along the Bombong Estuary and the coastal waters of Ticalan in San Juan, Batangas. Philippine Journal of Science 148 (4), 789–801.
- Esquinas, G. G. M. S., Mantala, A. P., Atilano, M. G., Apugan, R. P., & Galarpe, V. R. K. R., 2020. Physical characterization of litter and microplastic along the urban coast of Cagayan de Oro in Macajalar Bay, Philippines. Marine Pollution Bulletin, 154, 111083. doi: 10.1016/j.marpolbul.2020.111083
- Galloway, T. S., Cole, M., & Lewis, C., 2017. Interactions of microplastic debris throughout the marine ecosystem. Nature Ecology & Evolution, 1(5). doi: 10.1038/s41559-017-0116
- Gössling, S., 2002. Human–environmental relations with tourism. Annals of Tourism Research, 29(2), 539-556
- Hammer, Ø., Harper, D. A. T., & Ryan, P. D., 2001. PAST: PALEONTOLOGICAL STATISTICS SOFTWARE PACKAGE FOR EDUCATION AND DATA ANALYSIS. Palaeontologia Electronica, 4(1). http://palaeo-electronica.org/2001_1/past/issue1_01.html
- Heidbreder, L. M., Bablok, I., Drews, S., & Menzel, C., 2019. Tackling the plastic problem: A review on perceptions, behaviors, and interventions. Science of The Total Environment, 668, 1077–1093. doi: 10.1016/j.scitotenv.2019.02.437
- Jambeck, J.R., Geyer, R., Wilcox, C., Siegler, T.R., Perryman, M., Andrady, A. Narayan, R., Law, K.L., 2015. Plastic waste inputs from land into the ocean. Science 347 (6223), 768–771.
- Jang, Y. C., Hong, S., Lee, J., Lee, M. J., & Shim, W. J., 2014. Estimation of lost tourism revenue in Geoje Island from the 2011 marine debris pollution event in South Korea. Marine Pollution Bulletin, 81(1), 49–54. doi: 10.1016/j.marpolbul.2014.02.021
- Kalnasa, M. L., Lantaca, S. M. O., Boter, L. C., Flores, G. J. T., & Galarpe, V. R. K. R., 2019. Occurrence of surface sand microplastic and litter in Macajalar Bay, Philippines. Marine Pollution Bulletin, 149, 110521. doi: 10.1016/j.marpolbul.2019.110521
- Lippiatt, S., Opher, S., & Arthur, C., 2013. NOAA Marine Debris Shoreline Survey Field Guide. National Oceanic and Atmospheric Administration. https://www.MarineDebris.noaa.gov
- Maione, C., 2019. Emergence of plastic pollution on tourism beaches in Zanzibar, Tanzania. School for Environment and Sustainability, University of Michigan. https://deepblue.lib.umich.edu/bitstream/handle/2027.42/148801/Maione_Carol_Thesis.pdf?sequence=
- Martins, J., Sobral, P., 2011. Plastic marine debris on the Portuguese coastline: a matter of size? Mar. Pollut. Bull. 62 (12), 2649–2653
- Meijer, L. van Emmerik, T., van der Ent, R., Schmidt, C., & Lebreton, L., 2021. More than 1000 rivers account for 80% of global riverine plastic emissions into the ocean. Science Advances. Environmental Studies. Sci. Adv. 2021; 7: aaz5803
- Pabortsava, K., & Lampitt, R. S. (2020). High concentrations of plastic hidden beneath the surface of the Atlantic Ocean. Nature Communications, 11(1). doi: 10.1038/s41467-020-17932-9
- Paler, M. K. O., Malenab, M. C. T., Maralit, J. R., & Nacorda, H. M., 2019. Plastic waste occurrence on a beach off southwestern Luzon, Philippines. Marine Pollution Bulletin, 141, 416–419. doi: 10.1016/j.marpolbul.2019.02.006
- Plastics Europe, 2020. Plastics – the Facts 2020. An Analysis of European Plastics Production, Demand and Waste Data for 2020 (12.10.2020) https://issuu.com/plasticseuropeebook/docs/plastics_the_facts-web-dec2020
- Rees, G., & Pond, K., 1995. Marine litter monitoring programmes—A review of methods with special reference to national surveys. Marine Pollution Bulletin, 30(2), 103–108. doi: 10.1016/0025-326x(94)00192-c
- Retama, I., Jonathan, M. P., Shruti, V. C., Velumani, S., Sarkar, S. K., Roy, P. D., & Rodríguez-Espinosa, P. F., 2016. Microplastics in tourist beaches of Huatulco Bay, Pacific coast of southern Mexico. Marine Pollution Bulletin, 113(1–2), 530–535. doi: 10.1016/j.marpolbul.2016.08.053
- Sajorne, R. E., Bacosa, H. P., Cayabo, G. D. B., Ardines, L. B., Sumeldan, J. D., Omar, J. M., & Creencia, L. A., 2021. Plastic litter pollution along sandy beaches in Puerto Princesa, Palawan Island, Philippines. Marine Pollution Bulletin, 169, 112520. doi: 10.1016/j.marpolbul.2021.112520
- Steichen, J.L., Labonté, J. M., Windham, R., Hala, D., Kaiser, K., Setta, S., Faulkner, P.C., Bacosa, H., Yan, G., Kamalanathan, M. and Quigg, A., 2020. Microbial, physical, and chemical changes in Galveston Bay following an extreme flooding event, Hurricane Harvey. Frontiers in Marine Science. 7; 186
- Sumeldan, J. D. C., Richter, I., Avillanosa, A. L., Bacosa, H. P., Creencia, L. A., & Pahl, S., 2021. Ask the Locals: A Community-Informed Analysis of Perceived Marine Environment Quality Over Time in Palawan, Philippines. Frontiers in Psychology, 12. doi: 10.3389/fpsyg.2021.661810
- van Emmerik, T., van Klaveren, J., Meijer, L. J. J., Krooshof, J. W., Palmos, D. A. A., & Tanchuling, M. A., 2020. Manila River Mouths Act as Temporary Sinks for Macroplastic Pollution. Frontiers in Marine Science, 7, 1–3. doi: 10.3389/fmars.2020.545812
- Vlachogianni, T., Fortibuoni, T., Ronchi, F., Zeri, C., Mazziotti, C., Tutman, P., VareziV, D.B., Palatinus, A., Trdan, Š d Peterlin, M., Mandi, M., 2018. Marine litter on the beaches of the Adriatic and Ionian Seas: an assessment of their abundance, composition and sources. Mar. Pollut. Bull. 131, 7451, 74
- Williams, K. Bacosa, H.P. and Quigg, A., 2017. The impact of dissolved inorganic nitrogen and phosphorous on responses of microbial plankton to the Texas City “Y” oil spill in Galveston Bay, Texas (USA). Marine Pollution Bulletin, 121; 32-44