Dynamic Coasts and immovable cultural resources: an assessment of the impact of natural-environmental factors on coastal cultural heritage, Case of Brunswick County, North Carolina
University of West Florida, USA skhakzad@uwf.edu
Abstract
Coastal cultural resources provide crucial links to the past and are important centerpieces for interwoven maritime heritage community narratives, and are valuable cultural resources. Similar to many other places in the world, in southeastern NC, natural and environmental factors such as storms, erosion and climate change have caused damages to, and continue to threaten, cultural heritage in different ways. Categorizing the level of importance of these sites and prioritizing actions for their preservation can not only facilitate preserving some sites, but also contribute to our understanding about the past, before these assets vanish from coastal areas. However, a full understanding of the different factors that affect different cultural assets does not yet exist. In order to prioritize our actions regarding cultural heritage management, a thorough study on the impact of natural and environmental factors on coastal cultural heritage is necessary. A research synthesis, which includes a systematic review of literature and previous experiences, and various data analyses result in new knowledge about the probable future state of coastal cultural heritage in Brunswick County. The result is a set of risk maps for coastal cultural heritage in Brunswick County that can assist managers and policy makers to prioritize their actions regarding conservation, preservation and management of coastal cultural heritage.
Keywords
Dynamic coasts, maritime heritage, community narratives, Brunswick County, North Carolina
Introduction
Coastal cultural resources, including maritime historic and prehistoric features and structures, cultural landscapes, underwater cultural parks and preserves, play important roles in sustainable development for poverty reduction, livelihood promotion, education, and environmental protection (Vallega, 2003; Pinder and Vallega, 2003; Westerdhal, 2011; Ford, 2011; Campbell, 2000; Khakzad et al, 2015). These resources help to promote people's sense of identity and place attachment (Salmons, 2007; Luchsinger, 2008). However, in many instances, coastal cultural heritage sites are threatened by variety of factors due to dynamic state of the coast (Erlandson, 2008). These factors vary from different coastal areas with different coastal morphology and presence of variety of natural factors (Murphy et al, 2009). These factors include, but not limited to soils, waves, tides, wind, storms and beach erosion (Roberts and Trow, 2002; McVey and Erlandson, 2012; Emanuel, 2005; Webster et al, 2005; Elsner et al., 2008; Martin and Parris, 2007). The impacts that local geological conditions, geomorphological processes and climate change can bring on heritage assets have been documented across a number of countries and their coastlines (Murphy et al, 2009; Pearson, 2007). These coastal processes have different and varied levels of impacts on coastal cultural heritage, depending on the severity of processes, and state of preservation and location of cultural assets (Murphy et al, 2009). The state of preservation, knowledge of the type and magnitude of threats, and public awareness have been highlighted by many experts as major factors in preservation and management of cultural heritage (De la Torre, 2002). Increasing knowledge of the threats to cultural heritage resources is an essential and important first step to prioritize preservation and management strategies (Personal communication with Dr. Brad Barr, Senior Policy Advisor, NOAA/ONMS, 21 Aug. 2014).
The coastal areas of North Carolina are constantly affected by natural factors that can adversely affect many cultural and archaeological sites. Brunswick County is one of the significant historic areas in North Carolina. Therefore, the purpose of this research is to determine major natural-environmental factors that are threatening preservation of coastal cultural heritage in this area. The present research applies a synthesis methodology for analyzing the existing data. Studies such as the present research can benefit from a multidisciplinary approach based on the integration of various data and methodologies within archaeology, history, geology, geography, and geomorphology (Daire et al, 2012). Several sets of data from diverse categories of cultural heritage sites, such as archaeological sites and historical sites, are available through different sources including the Office of State Archaeology, State Historic Preservation Office, National Park Service, NOAA, and the ECU archive. This research, also, addresses the gaps in present data that complicate the assessment of cultural heritage and consequently, the future preservation plan and management of cultural resources.
Natural factors impacting Southeastern North Carolina coastal cultural heritage
The major factors threatening North Carolina’s coast are sea level rise, the recurring annual danger of storm surges during hurricane season, and floods from heavy rain events (Riggs et al., 2000; Mallinson et al., 2005, 2008). Consequently, more coastal inundation occurs annually from storm surges, and stronger thunderstorms and tropical cyclones create more wave energy on North Carolina’s coast each year (Smith et al., 2006; Beven et al., 2007). In low laying land, the nuisance flooding is increasing due to climate-related sea level rise and land subsidence. The nuisance flooding, combined with loss of natural coastal barriers, is a major factor that can threaten the stability of many structures (Sweet and Park, 2014; Sweet et al, 2014; NOAA, Nuisance flooding, 2016). Shoreline changes and erosion are other impacting factors in the coastlines. Based on the 2011 N.C. Division of Coastal Management (NCDCM) report, 62% of the North Carolina shoreline change rates at ‐2 feet per year or less, and 20% measured erosion rates between ‐2.5 and ‐5 feet per year (NCDCM, 2016). Brunswick County is considered Region 1 in NCDCM, which means the shoreline in this region is exposed and vulnerable. This shoreline is facing strong wave activity from the south. Waves can have short-term, seasonal, and long-term impacts on both the cross-shore and along-shore beach shape. In addition, more impact through more frequent storms and wave events change the general beach outline and affect structures and sites along the shoreline (BIMP, 2011).
Considering the level of impact that different natural factors impose on North Carolina coastal area, the present study uses the available data on four major factors of sea-level rise, floods, storm surge, and hurricanes to create risk maps for cultural heritage in coastal area of Brunswick County.
Delineation of the study area and research methodology
A buffer of 2 miles from the edge of the water, including the rivers and Intracoastal Waterway, in Brunswick County has been selected. In order to delineate, the criteria of ‘Areas of Environmental Concern’ (AEC) were adopted. Coastal AEC includes: coastal wetlands, estuarine waters, public trust areas, estuarine shorelines, ocean beaches, frontal dunes, ocean erosion areas, inlet lands, and fragile natural resource areas (State Coastal Zone Boundaries, 2012).
The study has been conducted in two main phases with application of different methods as follows:
Phase 1: Data collection
Two main sets of data have been compiled for this study: cultural heritage data and geomorphological and environmental data. Different sources were used for collecting relevant data for Brunswick county coastal area. The data sets for cultural and archaeological sites in the coastal areas in Brunswick County were acquired from the Office of State Archaeology, and sites with significance for traditional fishing communities have been recorded during the field research and through conducting interviews with fishermen. The ECU archive was also consulted to collect more information on some sites. Compiling all these data sets showed that there are more than 1300 archaeological and cultural heritage sites in the study area (2 mile buffer). Geomorphological and environmental data was accrued from several reliable sources, as listed in Table 1.
Phase 2: Data superimposition
In order to assess the level of exposure to different natural factors in North Carolina (hurricane, storm surge, flood, and sea-level rise), available geomorphological data was superimposed with heritage maps in ArcGIS. Various ArcGIS methods of analysis, including Cross Tabulation and Zonal Geometry, were used to predict the coverage and impact values of different environmental factors at cultural heritage sites in the study area. For this purpose, geo-visualization technics were applied in analysis. Geo-visualization is helpful for multiple purposes and users, for interpreting spatial patterns, and for better and more informed communication among academics, government managers, and stakeholders (Slocum et al, 2009). There are examples of visualization, such as storm surge, hurricanes and floods forecasts, which offer opportunities to raise risk awareness and to improve communication of impending disasters in emergency situations (Allen et al, 2013; FEMA, 2016; Houston and Powell, 2012). ArcGIS software provides an efficient tool for mapping and loss estimation, such as the FEMA HAZUS (Pine et al, 2005).
Results
Learning from projects such as FEMA HAZUS and other modeling technics, in this section, the project composes a series of maps for general risk evaluation of archaeological and cultural sites. These maps are produced by superimposing four main natural-environmental impacting factors in North Carolina (flood, storm-surge, sea-level rise and hurricane), and cultural and archaeological data. These risk maps highlight the areas that potentially get affected and threatened by these factors. The level of threat for each factor has been calculated based on interpretation of the existing data according to level of severity that was assigned to each factor based on the literature and different scenarios. These levels are relative and only comparable within the datasets that were used for each factor.
Risk Maps
a. Superimposition of Flood Hazard Zones and Cultura-Archaeological Data
In this study, the scales from FEMA have been used for flood hazard zones1. Flood hazard areas identified on the Flood Insurance Rate Map, according to FEMA, are identified as a Special Flood Hazard Area (SFHA). SFHA are defined as the area that will be inundated by the flood event having a 1-percent chance of being equaled or exceeded in any given year. The 1-percent annual chance flood is also referred to as the base flood, or 100-year flood. Moderate flood hazard areas are the areas between the limits of the base flood and the 0.2-percent-annual-chance (or 500-year) flood. The areas of minimal flood hazard are the areas outside the SFHA and higher than the elevation of the 0.2-percent-annual-chance flood (unshaded) (FEMA.flood-zones, 2016). This data was superimposed with cultural heritage data [Map 1].

Based on the literature, data from FEMA, and insurance evaluation, for Minimal Chance of flood, Impact Value 1; for Flood Way, Impact Value 2, and for a 2% chance of annual flood, the authors assigned Impact Value 3. Although flood ways are important in FEMA, no cultural-archaeological sites are mapped in these areas. Only one location is considered as ‘riverine flood ways’ with no marked cultural resources. Thus, this area has been excluded from the calculation. After assigning the values, cultural data and natural data were mapped and analyzed in ArcGIS, applying Cross Tabulation tool. Map 1 was produced for “Flood Zones and Coastal Cultural Heritage” as a risk map for flood risk. The number of potential sites in different impact zones are summarized in Table 2.
| Type of Sites | Total # | Flood Hazard Risk Impact | ||
|---|---|---|---|---|
| 1 | 2 | 3 | Historic Preservation Office | 682 | 284 | 14 | 1 |
| ESI_HS | 5 | 3 | 0 | 0 |
| ESI_AS | 251 | 146 | 0 | 23 |
| OSA | 369 | 101 | 131 | 4 |
| Total site | 1307 | 534 (40.85%) | 145 (11.09%) | 28 (2.70%) |
b. Superposition of Storm Surge Zones and Archaeological—Cultural Data
Based on the GIS data set of Hurricane Storm Surge Inundation Areas, developed by the National Hurricane Center, in cooperation with the North Carolina Center for Geographic Information and Analysis in 1993, four categories of storm surge that causes inundation were mapped: cat0, cat3, cat12, and cat45) (Nc1map_Hurricanes (Mapserver)). These categories are a conservative estimate of inundation in worst-case scenario and only indicate a wide range of still water, if surges occur. For example, the cat12 layer is a map of what would be inundated by a Saffir-Simpson scale category 2, which is a worst-case scenario for a storm of that category (Saffir, 1973, Simpson, 1974). The storm surge data were superimposed with cultural heritage data to produce storm surge risk map for cultural heritage [Map 2].
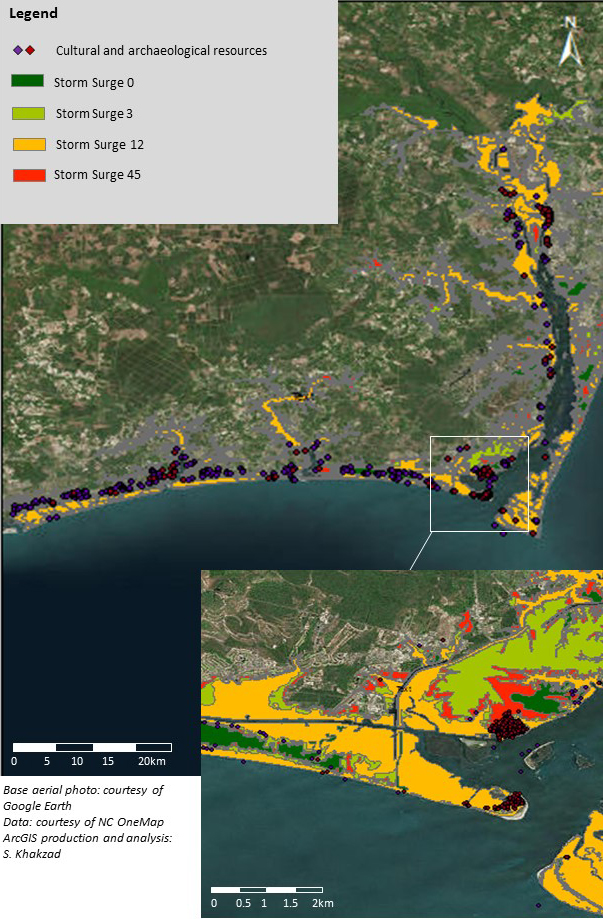
Table 3 shows the number of sites that are affected by different levels of storm surge.
| Type of Sites | Total # | Storm Surge Risk Impact | |||
|---|---|---|---|---|---|
| 1 (SS: 0) | 2 (SS: 3) | 3 (SS: 12) | 4 (SS: 45) | Historic Preservation Office | 682 | 0 | 65 | 130 | 32 |
| ESI_HS | 5 | 0 | 1 | 1 | 0 |
| ESI_AS | 251 | 21 | 24 | 45 | 28 |
| OSA | 369 | 68 | 149 | 11 | 88 |
| Total site | 1307 | 89 | 239 | 187 | 148 |
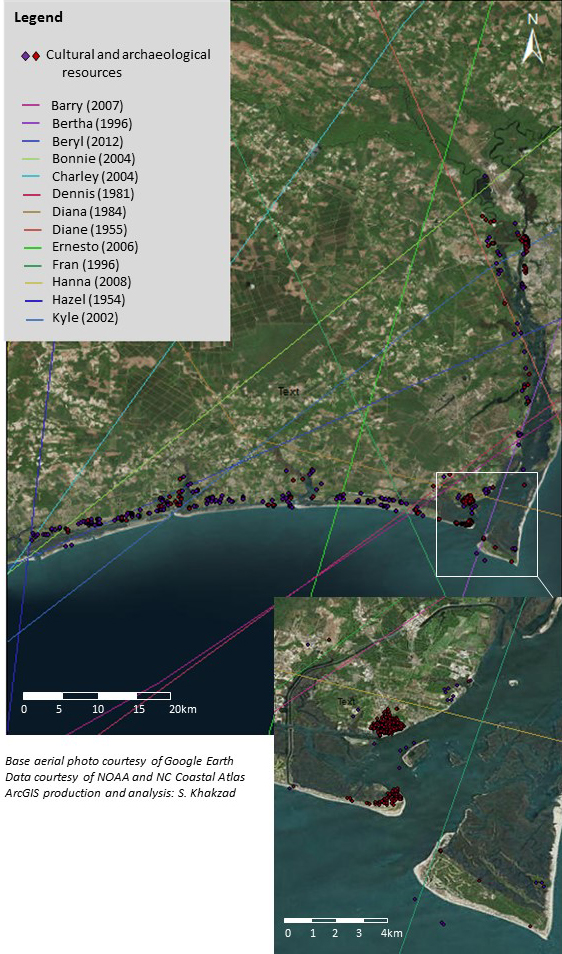
c. Hurricane and Archaeological—Cultural Data
According to the historic hurricane data, many hurricanes have affected Cape Fear area [Map 3]. Hurricanes Dennis (1981) and Barry (2007) had almost exact routes. However, their years of occurrence were far from each other. Bertha (1996) and Fran (1996) hit Cape Fear area in the same year very close to each other. Hanna (2008) also hit the Cape Fear area. In the western side of the Brunswick coast, the number of hurricanes which hit the coastal areas is also high. Hurricanes Beryl (2012), Bonnie (2004) and Charley (2004, cat. 4) hit the land in a very close distance from each other. Nevertheless, the lines on these maps show only the pattern of the hurricanes’ eyes, and the affected areas are far wider than these lines—sometimes tens of kilometers. In addition, the intensity of the hurricanes are also different. Since there is no prediction map available for future hurricanes, a risk map for future cannot be composed from the available data. Nonetheless, historic data shows that Brunswick County and especially Cape Fear are prone to hurricane. Considering that the concentration of heritage assets in Cape Fear and upstream in Cape River is high, the probability of cultural heritage being affected by hurricane is logically viable.
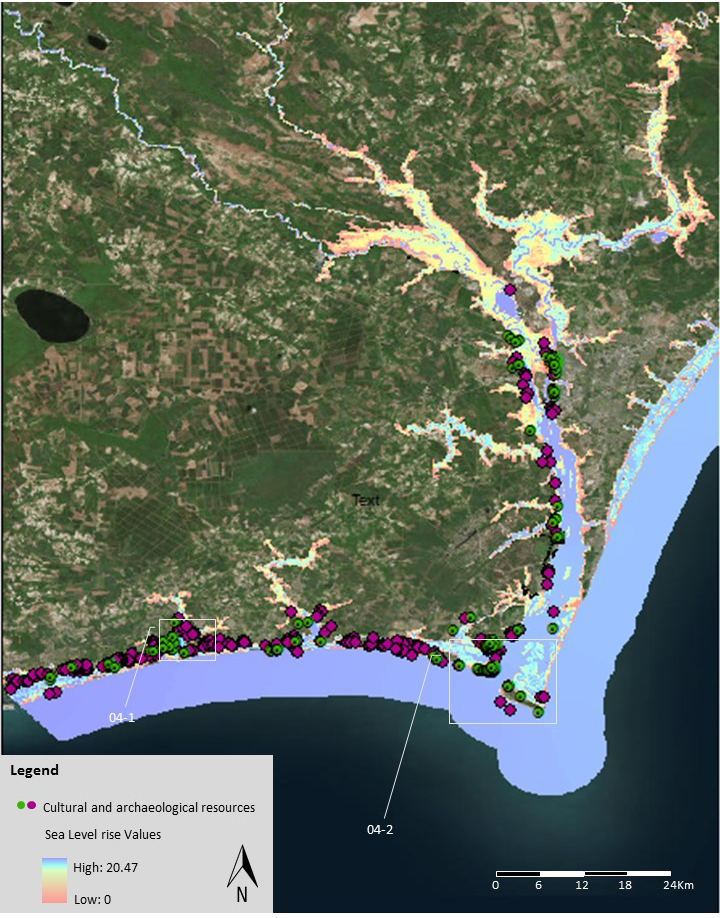
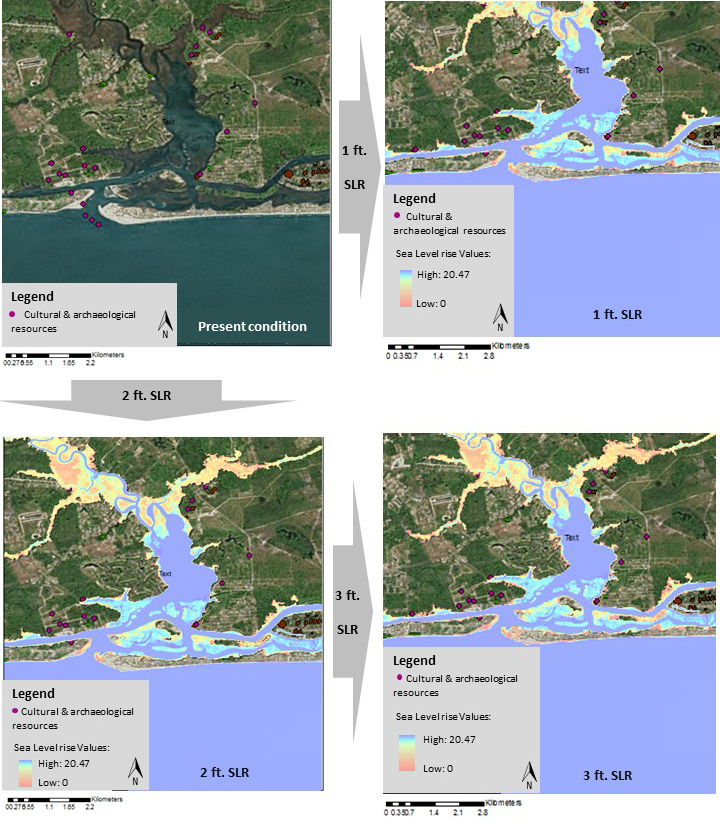
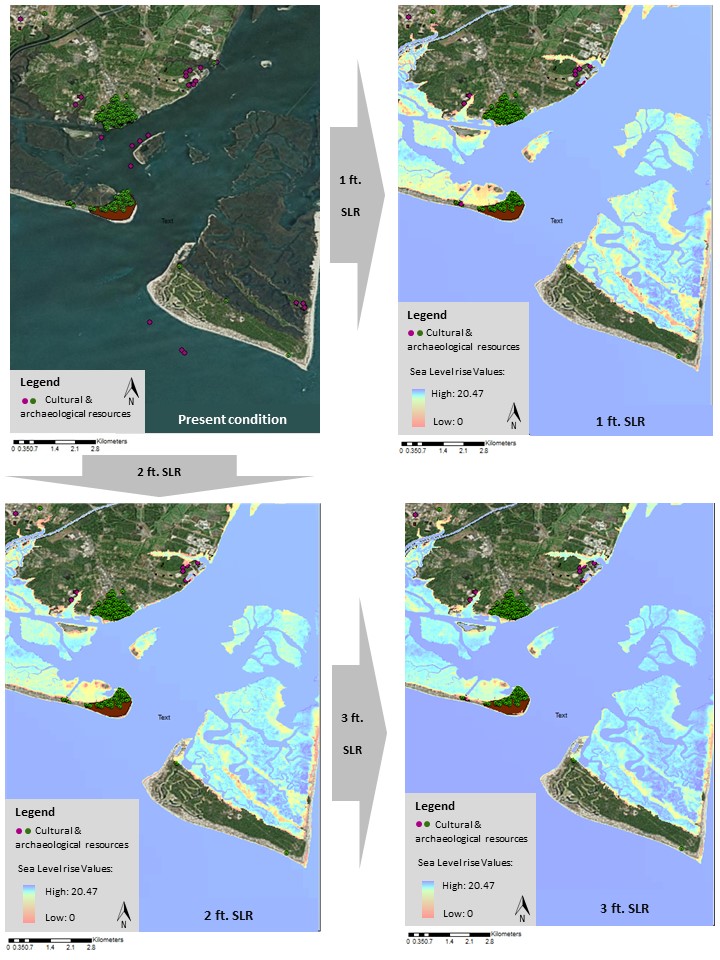
d. Sea-level Rise and Archaeological-Cultural Data
Sea level rise is a long-term risk and its impact on cultural heritage sites can be mitigated, if enough understanding of the extent of sea level rise and its damages on different types of heritage can be estimated. The sea-level rise data acquired from NOAA uses three scenarios of 1ft, 2ft and 3ft flood that were projected on the maps. These three layers were superimposed separately with the archaeological and historical data. General maps for 2 ft. sea-level rise scenario has been presented in Map 4. Some sections of the maps are zoomed in [Maps 5 and 6] to show the cultural heritage sites that get affected and inundated by sea rise in different scenarios. Although in some cases the water might not reach the sites or cause inundation, the proximity of these sites to water will increase the risk of by penetration of salt-water into these entities, which increase the risk of material and structural erosion.
Discussion
Present study applied an interdisciplinary approach and a synthesized methodology in order to create risk maps for coastal cultural heritage. The study and analysis showed that some conclusions regarding the level of natural-environmental factors affecting cultural resources could be drawn in order to prioritize actions for preservation and protection of cultural resources in risk areas. However, the research faced several challenges, which derive from the quality of existing data in fulfilling its objectives fully. One of the main challenges is that existing data is inadequate for detailed analyzing, planning, and management. The inadequacy of data was observed in existing data on archaeological and cultural heritage resources and in some natural and environmental datasets. Some of the issues that were faced are explained as follows.
One of the issues is with categorizing the cultural and archaeological sites. Archaeological data are categorized in two main groups of Points and Sites. Points are considered as those that were reported as individual findings, such as a sherd of pottery, shells, pipe, or other artifacts. Sites are more likely a vaster collection of findings and archaeological remains in a landscape. The sites and points were labeled as Historic (H), Pre-historic (P), and Both (PH). There are reports available about most of these items at the State Archaeology Office. However, many of the reports on these sites are from the environmental investigation reports. Therefore, the zoning system of these sites is based on the modern urban planning and blocks of housing, where each block was individually investigated for possible existence of archaeological and cultural remains before new construction, rather than considering the entire archaeological site. As a result, the number of sites are associated with the number of housing and urban blocks, not with the actual potential archaeological sites.
On the State Historic Preservation Office dataset one category of the sites are Destructed/Moved Sites. Since one important goal of the present research was to understand the impacting factors on the archaeological/cultural sites, the dataset was searched for the reasons that caused the destruction and damage of those sites. However, in the data set there was not many entities whose destruction/displacement reasons were explained or known. Since there is no record of all the factors that caused destruction/displacement of sites, no concrete conclusion can be drawn from analyzing these data to understand the major reasons of destruction/displacement of these sites. According to the NC Regional Supervisor, the Historic Preservation Office updates the information about sites, if only a third party reports about these buildings and sites. If a site/building is displaced or destructed, usually, there is no information available about the cause of its destruction/displacement (E-mail communication with Scott Power, Regional Supervisor, Eastern Office, N.C. State Historic Preservation Office, Department of Natural and Cultural Resources). If such information existed, a better analysis could be performed and factors that are affecting coastal cultural heritage could be better understood.
This study examined four major natural factors that affect coastal areas, independently, to estimate the extent of the risks to cultural and archaeological sites in Brunswick County. Several challenges were faced during the analysis. The data used for this study was accumulated from general existing natural and environmental data, and the datasets were not specifically managed for assessing their impact on cultural heritage. Moreover, the accuracy and availability of updated data for specific locations, in addition to the analysis technics were not ideal for the objectives of the present research. The ongoing development of modern technology can improve our collecting, interpretation and understanding of data. For example, studies showed that discrepancies in inundation predictions when using traditional contour-based surge maps compared to contemporary digital LiDAR-based inundation models are significant, which can greatly influence decision making (Allen et al, 2013). Moreover, risk to archaeological and cultural heritage sites can only roughly be characterized by just overlaying structures/sites and natural-environmental factors. The level of impact can vary depending on the sites elevation, material, architectural designs and sites stability. In addition, the author acknowledge that the level of threat and risk can be amplified, if all these factors affect cultural resources at the same time or during an extended period. In addition, GIS analysis also have its own challenges to depict the scope of risks and threats.
Some data sets are outdated. For example, the storm surge data acquired from NC OneMap and used for the present research have originally been accumulated and mapped with the technology and capability of the mid-1990s. This data was manually made by digitizing the original data onto topographic maps, using SLOSH model to estimate the areas that a surge might cover. Therefore, the accuracy of data and covered zones might not be exact. Furthermore, this data does not show the depth of inundation, or the force of storm surge and tides. Additionally, the impact of flood and inundation through sea level rise varies, depending on factors such as type of building or site, its material, its location, type of soil, and the vulnerability of buildings and sites to salt and water penetration through the soil and buildings’ foundation. In order to estimate the impact of flood on the cultural and archaeological sites, each site needs a separate study to understand all the above mentioned factors. The risk map here only demonstrates the site that can be affected by flood, but the impact factor does not consider the sites’ vulnerability.
Two sites are chosen here for more discussion in details. These sites are selected because there is more information available on the state of preservation and the factors affecting them.
Bald Head Island Boat House
This site is an old wooden boat house, listed on the National Register of Historic Places. It is listed as a property, associated with events (fishing, boatbuilding, etc.) which have made a significant contribution to the broad patterns of history as a structural marker in a long history of European settlement of the maritime Cape Fear region (NRHP, 2016). The registration form was prepared in 1997, which describes the site as the ca. 1915 Bald Head Creek Boathouse, a surviving member of a series of structures erected beginning in the late eighteenth century that signified efforts to provide safe ship passage in this treacherous stretch of the North Carolina coast. (National Register of Historic Places, registration Form).
This simple single-craft, rectangular frame, gable-roofed structure rests on wooden pilings. It was built to store supplies and boats. Due to the dramatic change of the shape and direction of the creek channel during the past ninety years, the boathouse location in relation to the water has changed. Presently, the boundary for the Bald Head Creek Boathouse includes a 25-foot swath surrounding the perimeter of the boathouse. The boathouse is situated in Bald Head Creek, a tidal creek which is constantly shifting. The 25-foot swath around the boathouse includes a portion of the creek and marshland. The natural changes, in addition to the changes to the social (i.e. more tourists and new comers versus fishermen) and urban (i.e. relocation of the fishing facilities) setting resulted in abandonment of the boathouse, and therefore its rapid deterioration.
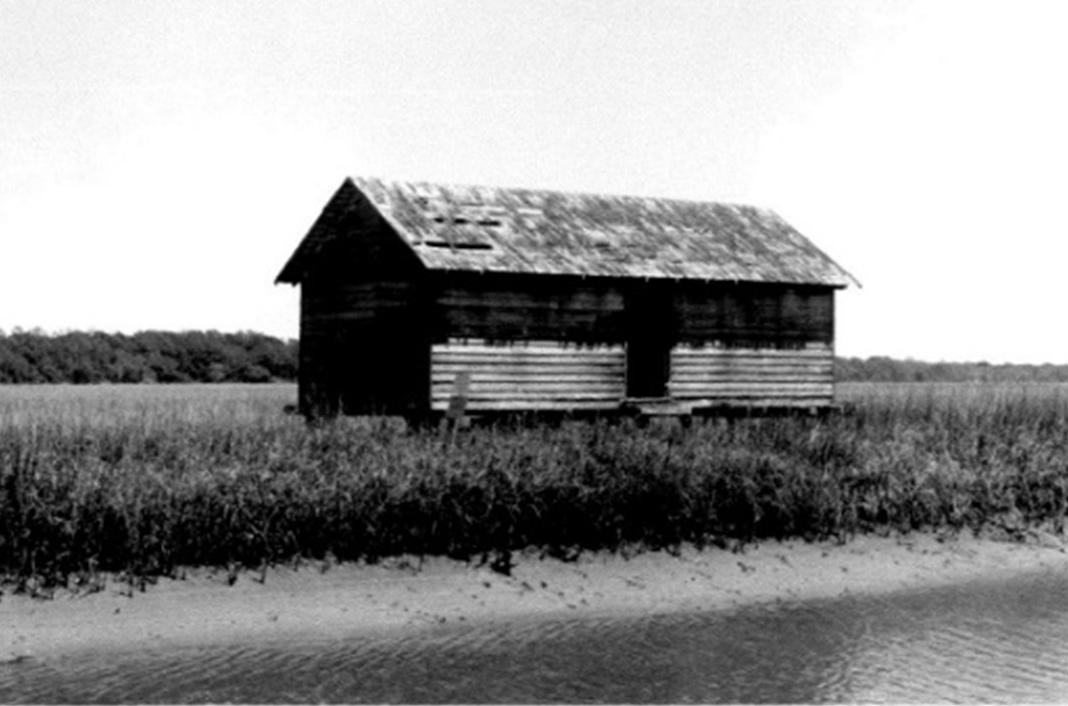
Although the site is one of the most popular paintings and photographic scenes on the island and it is a registered site, no action has been taken for its preservation, and its structure is suffering from deterioration. The fact that the building is standing on wooden pilings in tidal marsh suggests the stability of the building is questionable. The comparison between the pictures taken at the time of its registration form preparation (1997) with recent pictures (2015) shows the extent of its deterioration in about three decades [Fig. 1a and b]. In addition, considering the location of this building in lowland areas of Baldhead Island and the projection of sea-level rise and storm surge data, this building is in imminent risk of damage, if these scenarios take effect. The Creek Boathouse would be affected by one-foot sea-level rise scenario, which is the minimum predicted sea-level rise scenario, and cat12 storm surge, which is the worst-case scenario for storm surge.
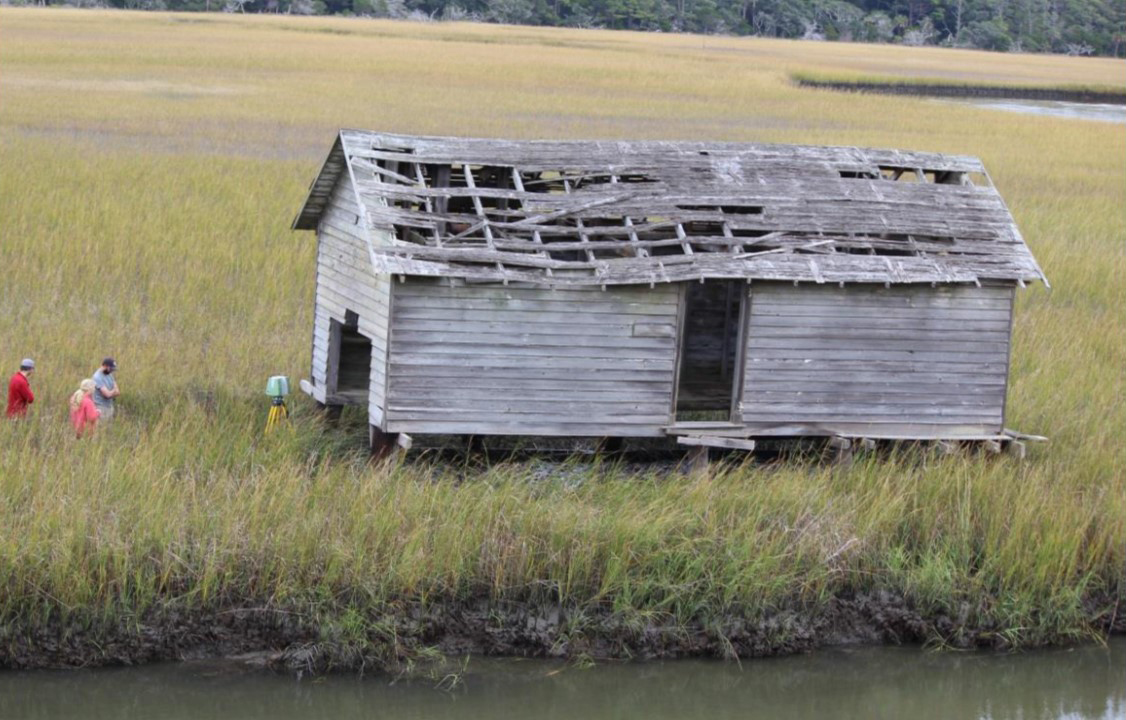
The boathouse case shows that natural factors, such as wind and dampness and the major shift of the river channel, combined with the lack of preservation effort are the main factors deteriorating the building. This building can suffer from these factors in short-term. Despite status as a National Registered building, no preservation efforts have taken place to date. Given the historic values of this site and natural factors that threatening this building, in addition to the efforts to document its present condition (East Carolina University ongoing Project), there is sufficient information available for arguing the need for its preservation. This information can help managers to make sound decision and take informed actions in regards to preservation and/or displacement of the Creek Boathouse.
Brunswick Town
Brunswick Town was settled about 1725. The town was erected at the previous (or adjacent to the previous) Charles Town, and some archaeological remains of Native Americans settlements (Lee, 1963). Brunswick Town was one of the most prominent port and political centers (Pedlow, 19797: 9). The site comprises historic houses and ruins, and remains of the port and wharves. The work, to actively save historic places from destruction or unsympathetic alteration, began with the establishment of the Brunswick Town State Historic Site in the 1950s (Landmark Preservation Associates, 2010). Brunswick Town is a Historic Registered Site.
Archaeological studies in Brunswick Town have identified the remains of four colonial wharves and the possible locations of five more. Cape Fear River experiences hydrological floods, which is a peak in river discharge following rain or snowmelt, and causes erosion along the river shoreline (Becker, Luettich, & Mallin, 2010). Jim McKee, historic interpreter for the Brunswick Town State Historic Site, stated that since 2010, due to the Cape Fear’s flooding and strong water flow, the banks of the river are constantly eroded, which results in the exposure of more wharves [Fig. 2]. Superimposition of this site on the risk maps shows that this site can be affected by one-foot sea-level rise scenario and cat12 storm surge. In addition, historic data shows that this site is located in a hurricane-prone region. The existing data shows that seasonally, there will be more severe river current and flood in the riverbank, which will result in more erosion and loss of material and structure.
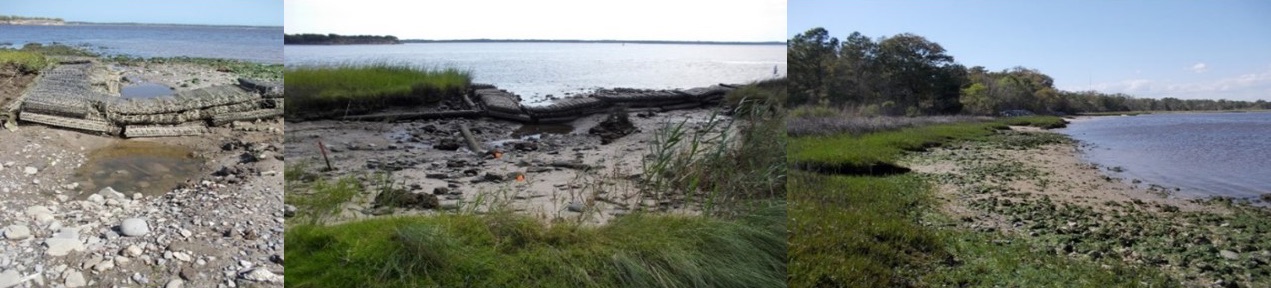
The preservation efforts aim to conserve 3,600 linear feet of coastline. This effort includes setting "Tensar Geogrid" marine mattresses, rock-filled mesh containers that offer a place for vegetation growth that absorbs the energy of constant wave motion, produced by tides and passing boats, as well as flooding. In order to protect the site, more preventive actions are required. The land is partially owned by the private sector and partially by the military. Disagreement among the owners is one of the issues that complicates the prospect of a unified strategy for management and preservation efforts (Star News, 2013). Existing information on this site and being aware of its historical values enhanced the possibilities of its protection. However, factors, such as funding and different ownerships, complicated decision-making.
In general, assessment of the state of existing sites, buildings and their structures will help to analyze the impact of each factor more accurately. The two mentioned case studies are example of a few fairly well documented sites and structures, with existing information about their present condition. Nevertheless, not all the cultural-archaeological entities hold the information about their structures and materials, which is necessary for decision-making. Therefore, the present analysis can only highlighted probable major factors that possibly affect cultural resources, not the extent and exact form of impact.
Conclusion
Several natural and anthropogenic factors, including storms, sea-level rise, flood and hurricane are threatening coastal areas of North Carolina. Through synthesizing data, the present study provided risk maps for different factors. These risk maps highlight the areas that are more at risk of flood in short term, might be suffering from the impact of sea-level rise in long term, and the probability of being affected by hurricanes and storms. In addition, interpretation of this data for assessing the probable risk of flood and storm surge on cultural properties only can provide a very basic understanding on the locality of the cultural sites in relation to different level of flood hazard. As aforementioned, for a proper mitigation and protection of cultural properties, it is necessary to have a better understanding of the nature of cultural properties, their state of preservation, their susceptibility to salt and fresh water penetration, their materials and structural stability. However, the cultural resources datasets do not provide these specifics. According to the risk maps, several significant cultural heritage sites are threatened by different factors in long term. The concern about sea level rise is multifaceted because it will cause salt-water penetration into different sites and material, and causes unpredictable changes in the environment. Hurricane data only show the historical and past hurricanes. No hurricane prediction map has yet been produced for Brunswick County. More studies on the changes in the categories of hurricane and possible prediction scenarios can help cultural heritage managers to create mitigation plans for hurricane.
The risk maps can be a practical way to guide managers (and other potential stakeholders) toward envisioning strategies and plans that preserve cultural heritage resources either through relocation of the sites, adaptation strategies, or in situ mitigation and protection policies. As previously mentioned, for such plans and strategies, accurate data on the state of cultural resources, their preservation and their level of social and cultural significance is necessary. In other word, before acquiring such data on each site and building, no site-specific mitigation or adaptation strategies could be recommended. The existing risk maps are the first steps that can only reveal what sites are threatened by natural-environmental factors, and show the level of severity of those factors, not the level of their impacts on cultural properties. This research can be considered as a benchmark for future reference for risk assessment, and provided a strategy to collect and perfect data. The proposed strategy can be expanded and applied for other sites, and can include other factors affecting cultural assets in this area, and other areas.
Acknowledgements
The author appreciates all the help and support that she received from her advisors at East Carolina University, including Drs Lynn Harris, David Griffith and Tom Allen. Also, many thanks to the University of West Florida, Florida Public Archaeology Network, especially Drs William Lees and Della Scott-Ireton for their scientific support.
Endnotes
References
- Allen, T. (2013). Visualization for Hurricane Storm Surge Risk Awareness and Emergency Communication. In: Approaches to Disaster Management — Examining the Implications of Hazards, Emergencies and Disasters.
- Beven II, J., Avila, L., Blake, E., Brown, D., Franklin, J., Knabb, R., Pasch, R., Rhome, J. and Stewart, S. (2007). Atlantic Hurricane Season of 2005. Monthly Weather Review, 136, 1109-1173.
- BIMP, (2011). N.C. Beach and Inlet Management Plan Final Report, Section VIII, Region 1. Accessible at: https://ncdenr.s3.amazonaws.com/s3fs-public/Coastal%20Management/documents/PDF/BIMP/BIMP%20Section%20VIII%20-%20Region%201%20Formatted.pdf
- Campbell, H. (2000). Sustainable Development: Can the Vision be Realized?. Planning Theory & Practice, 1(2), 259-284. http://dx.doi.org/10.1080/14649350020008422
- Coastal Atlas. (2016): https://www.nccoastalatlas.org/
- Daire, M., Lopez-Romero, E., Proust, J., Regnauld, H., Pian, S., & Shi, B. (2012). Coastal Changes and Cultural Heritage (1): Assessment of the Vulnerability of the Coastal Heritage in Western France. The Journal Of Island And Coastal Archaeology, 7(2), 168-182. doi:10.1080/15564894.2011.652340
- De la Torre, M. (2002). Assessing the Values of Cultural Heritage. Los Angeles: Getty Conservation Institute.
- Digital Coast-Sea Level Rise (2016): https://coast.noaa.gov/digitalcoast/tools/slr
- Elsner, J.B., Kossin, J.P., Jagger, T.H. (2008). The increasing intensity of the strongest tropical cyclones. Nature 455, 92–95.
- Emanuel, K. (2005). Increasing destructiveness of tropical cyclones over the past 30 years. Nature 436, 686–688.
- Emanuel, K. (2000). A statistical analysis of tropical cyclone intensity. Mon. Wea. Rev. 128, 1139–1152.
- Engelhart, S.E., Horton, B.P., Douglas, B.C., Peltier, W.R., Tornqvist, T.E. (2009). Spatial variability of late Holocene and 20th century sea-level rise along the Atlantic coast of the United States. Geology 37, 1115-1118.
- Erlandson, J. (2008). Racing a Rising Tide: Global Warming, Rising Seas, and the Erosion of Human History. The Journal of Island And Coastal Archaeology, 3(2), 167-169. doi:10.1080/15564890802436766 FEMA.flood-zones, 2016: https://www.fema.gov/flood-zones
- FEMA, (2003). Federal Emergency Management Agency, URS Consultants, US Army Corps of Engineers. Slosh Display Training Technical Manual. http://www.fema.gov/pdf/plan/prevent/nhp/slosh_display_training.pdf (Accessed 15 September 2012).
- Ford, B. (Ed.) (2011). Introduction, The Archaeology of Maritime Landscapes, Springer, pp: 1-9.
- Houston, S., and Powell, M. (1994). Observed and modeled wind and water-level response from Tropical Storm Marco (1990). Weather and Forecasting, 9(3) 427-39.
- HPO.NCDCR.Data, 2016: http://www.hpo.ncdcr.gov/gis/CountyDisclaimers.html#DataDownload
- HPO.NCDCR.County, 2016: http://www.hpo.ncdcr.gov/gis/CountyDisclaimers.html
- Interreg :: Archimed — Home. (2016). 3kps.interreg.gr. Retrieved 7 July 2016, from http://3kps.interreg.gr/default.aspx?lang=en-GB&page=314.
- Khakzad, S. (2014). Re-evaluation of Native American Maritime Cultural Landscape: Cape Fear, Southeastern North Carolina, Maritime Archaeology and Historical Society Newsletter, Vol. 25:2.
- Khakzad, S., Pieters, M. and Van Balen, K. (2015). Coastal cultural heritage: A resource to be included in integrated coastal zone management, Journal of Coastal and Ocean Management, Volume 118, Part B, December 2015, Pages 110–128.
- Luchsinger, H. (2008). GEOARCHAEOLOGY, Encyclopedia of Archaeology, Academic Press, pp. 1409–1414.
- Mallinson, D., Smith, C., Culver, S., Riggs, S., & Ames, D. (2010). Geological characteristics and spatial distribution of paleo-inlet channels beneath the outer banks barrier islands, North Carolina, USA. Estuarine, Coastal And Shelf Science, 88(2), 175-189. http://dx.doi.org/10.1016/j.ecss.2010.03.024
- Mallinson, D.J., Riggs, S.R., Culver, S.J., Ames, D.V., Walsh, J.P., Smith, C.W. (2008). Past, Present and Future Inlets of the Outer Banks Barrier Islands, North Carolina. East Carolina University Printing Press, Greenville, NC. 28 pp. – available online at http://www.coastal.geology.ecu.edu/NCCOHAZ/downloads/Past%20Present%20and%20Future%20Inlets.pdf
- Mallinson, D., Riggs, S., Thieler, E.R., Culver, S.J., Foster, D.S., Corbett, D.R., Farrell, K., and Wehmiller, J.F. (2005). Late Neogene and Quaternary evolution of the northern Albemarle embayment (mid-Atlantic continental margin, U.S.A.) Marine Geology, 217: 97-117.
- Mallinson, D., Burdette, K., Mahan, S., and Brook, G. (2008). Optically stimulated luminescence age controls on late Pleistoceneand Holocene coastal lithosomes: North Carolina, USA. Quaternary Research, 69: 97-109.
- Martin, J.E. and Parris, D.C. (Eds.) (2007). Geology and Palenthology of Late Cretaceous Marine Deposits of Dakotas: Geological Society of America Special paper 427. doi:10.1130/2007.2427(02).
- McVey, J., & Erlandson, J. (2012). As the world warms: rising seas, coastal archaeology, and the erosion of maritime history, Coast Conservation, 16:137–142 doi:10.1007/s11852-010-0104-5.
- Murphy, P., Thackray, D., & Wilson, E. (2009). Coastal heritage and climate change in England: assessing threats and priorities. Conservation and Management of Archaeological Sites, 11 (1), 9–15.
- NAS, 2016: http://nauticalarchaeologysociety.org/
- National Hurricane Center (2016): http://www.nhc.noaa.gov/
- NC Coastal Atlas (2016): https://www.nccoastalatlas.org/
- NC Coastal Atlas maps (2016): https://www.nccoastalatlas.org/maps
- NCDCM (2016). Coastal Erosion Study Division of Coastal Management, North Carolina Department of Environmental Quality, N.C. Division of Coastal Management
- "Nc1map_Hurricanes (Mapserver)". Services.nconemap.gov. N.p., 2016. Web. 15 Sept. 2016. https://services.nconemap.gov/secure/rest/services/NC1Map_Hurricanes/MapServer
- NHC—NOAA, 2016. Retrieved 15 September 2016, from http://www.nhc.noaa.gov
- NHC.NOAA, 2016a: http://www.nhc.noaa.gov/aboutsshws.php
- NHC.NOAA, 2016b: http://www.nhc.noaa.gov/outreach/history/
- NOAA, (2004). North Carolina Bathymetry/Topography Sea level Rise Project: Determination of Sea Level Trends, NOAA Technical Report NOS CO-OPS 041
- NOAA.About, 2016: http://www.noaa.gov/about-our-agency
- NOAA Hurricane category, 2016: http://oceanexplorer.noaa.gov/edu/learning/14_hurricanes/activities/hurricane_categories.html
- NOAA, Maritime Heritage Program, 2013: http://sanctuaries.noaa.gov/maritime/cultures.html
- NOAA, Nuisance flooding, 2016: http://oceanservice.noaa.gov/facts/nuisance-flooding.html
- NOAA.vision, 2016: http://www.noaa.gov/our-mission-and-vision
- NOAA.Web, 2016: http://www.noaa.gov/
- NPS Criteria, 2016: http://www.achp.gov/nrcriteria.html
- NSP. CRGIS, 2016: https://www.nps.gov/hdp/standards/CRGIS/earthworks7.htm
- NPS.movingthelighthouse, 2016: https://www.nps.gov/caha/learn/historyculture/movingthelighthouse.htm
- NPS (2014). Preserving coastal heritage, Summery Report, The National Park Service
- NRHP, 2016, National Register of Historic Places. Accessible at: https://www.nps.gov/nr/ (Last access July 2016)
- Pearson, M. (2007). Climate change and its impacts on Australia’s cultural heritage, A paper for the Australia ICOMOS Extreme Heritage Conference: World Heritage Centre: 53, 65ff—extrapolated by the author for the Australian context.
- Pinder, D. & Vallega, A. (2003). Coastal cultural heritage and sustainable development: introduction. Journal Of Cultural Heritage, 4(1), 3-4. http://dx.doi.org/10.1016/s1296-2074(03)00003-7
- Pine, J.C., Mashriqui, H., Pedro, S., Meyer, J. (2005). Hazard mitigation planning using HAZUS-MH flood and wind hazards. Journal of Emergency Management, 2:11-16.
- Quality, N. (2016). NC DEQ: Sea Level Rise. Deq.nc.gov. Retrieved 8 July 2016, from http://deq.nc.gov/about/divisions/coastal-management/coastal-management-hot-topics/sea-level-rise
- Riggs, S. (2011). The Battle for North Carolina's Coast. Chapel Hill: University of North Carolina Press.
- Riggs, S., Cleary, W., & Snyder, S. (1995). Influence of inherited geologic framework on barrier shoreface morphology and dynamics. Marine Geology, 126(1-4), 213-234. http://dx.doi.org/10.1016/0025-3227(95)00079-e
- Riggs, S.R., Rudolph, G.L., and Ames, D.V. (2000). Erosional scour and geological evolution of Croatan Sound, northeastern North Carolina. North Carolina Department of Transportation, Report no. FHWA/NC/2000-002, 117 p.
- Riggs, S., & Ames, D. (2003). Drowning the North Carolina coast. Raleigh, N.C.: North Carolina Sea Grant.
- Roberts, P., Trow, S. (2002). Taking to the water: English Heritage’s initial policy for the management of maritime archaeology in England. English Heritage, London.
- Salmons, B.A. (2007). Integrated Coastal Zone Management and Cultural heritage: a literature review, Pol Sci. 542: Policy and Politics of Coastal Areas. Iowa State University.
- Simpson, R. H. (1974). The Hurricane Disaster-Potential Scale. Weatherwise, 27, 169.
- Slocum, T., McMaster, R., Kessler, F.C., and Howard, H.H. (2009). Thematic Cartography and Geovisualization. Third edition, Upper Saddle River: Prentice Hall.
- sshw.NOAA, 2016: http://www.nhc.noaa.gov/pdf/sshws_2012rev.pdf
- State Coastal Zone Boundaries, 2012. Accessible at: https://coast.noaa.gov/czm/media/StateCZBoundaries.pdf
- Sweet, W.V. and Park, J. (2014). From the extreme and the mean: Acceleration and tipping points of coastal inundation from sea level rise. Earth Futures, 2 579‐600. doi:10.1002/2014EF000272
- Sweet, W.V., Park, J., Marra, J. J., Zervas, C. and Gill , S. (2014). Sea level rise and nuisance flood frequency changes around the United States. In NOAA Technical Report NOS COOPS 73, 53 pp.
- Saffir, H. S. (1973). Hurricane Wind and Storm Surge and the Hurricane Impact Scale, The Military Engineer, Jan-Feb. No. 423
- Smith, J., Dolan, R., Lins, J. (2006). Hurricane History of the North Carolina Outer Banks (USA), 1586 to 2004. Shore and Beach, 74(3), 19-23.
- Star News (2013): http://www.starnewsonline.com/article/20130224/articles/130229824
- Vallega, A. (2003). The coastal cultural heritage facing coastal management. Journal of Cultural Heritage, Volume 4, Issue 1, Pages 5–24, January.
- Webster, P.J., Holland, G.J., Curry, J.A., and Chang, H.R. (2005). Changes in tropical cyclone number, duration, and intensity in a warming environment. Science 309, 1844–1846.
- Westerdahl, C. (2011). Maritime cultural landscape, In: A., Ford, B., and Hamilton, D., (Eds.), Oxford Handbook of Maritime Archaeology, Catsambis, Oxford University Press, New York, NY.